
EB Weekly Portfolio Report - Sunday, July 5, 2020
Upcoming Earnings Reports
According to Zacks.com, the following companies will be reporting earnings this week and each is a component of one of our portfolios:
Monday, July 6: None
Tuesday, July 7: None
Wednesday, July 8: None
Thursday, July 9: None
Friday, July 10: None
PLEASE NOTE: The above companies were provided after scanning the Zacks Earnings Calendar. My research is limited to what Zacks provides and I also can make a mistake from time to time, so please check for earnings dates for all companies that you own. We do hold our portfolio stocks through one earnings report, but every EarningsBeats.com member must make their own investing/trading decisions about holding stocks into earnings reports as it's the most volatile (risky) time to own a stock.
Portfolio Rules and Objectives
Here are the common traits and objectives of each portfolio, some of these were changed for our May 19th "draft" day recently (changes for the May 19 to August 19 quarter are in bold italics):
- We have removed the Character Change portfolio and added a new Strong AD portfolio
- There are 10 leading stocks from up to 10 leading industries in each portfolio (at the time of selection). Generally, there will only be one stock per industry group, but there could be exceptions.
- They are held for an entire 90 day period, with no stops in place. We strive for consistency, transparency, and simplicity in our portfolios. EB.com members may hold these stocks for the entire 90 days, trade them, use stops, etc., but for purposes of our calculation, we will make no exceptions to our "buy and hold for three months" strategy.
- Every stock will generally be held through ONE earnings report
- The expectation is that relative winners will carry the portfolio to outperformance
- They will all be entered into as of close on Tuesday, May 19th; members may choose to try to time better entries, but EB.com will "purchase" as of May 19th's closing price
- Primary objective is to outperform the benchmark S&P 500
Here are several considerations for EB members:
- I would expect the Strong AD and Aggressive portfolios to be the riskiest, followed by the Model portfolio, and then the Income portfolio
- The Strong AD portfolio will be selected from a combination of rising accumulation/distribution lines and SCTRs above 80 at the time of selection. It will be our only portfolio that does NOT require a revenue and EPS beat in its most recent quarterly earnings report
- The Income portfolio stocks will all pay dividends, with the expected average dividend yield to be at least 1.5%
- Drawdowns (losses) should be much milder on the Income portfolio, with more volatility expected on the other three; please review inception-to-date charts below to gain an idea of the volatility associated with each
- I believe the larger drawdown on the Income portfolio last quarter was an anomaly occurring as a result of the pandemic as many defensive, higher-yielding companies uncharacteristically underperformed during a market decline.
- You should own or trade these stocks in whatever manner is most comfortable for you; while we will buy all 10 stocks in the manner identified above, feel free to trade certain stocks or wait for pullbacks if the stocks are overbought
- We have no idea what risk each member is willing or able to take. We are not registered investment advisors so be sure you understand the risk you take. Please consult your financial advisor.
- EarningsBeats.com shareholders/employees may own all or some of the portfolio stocks from time to time.
Weekly Snapshot
Here's a weekly recap:
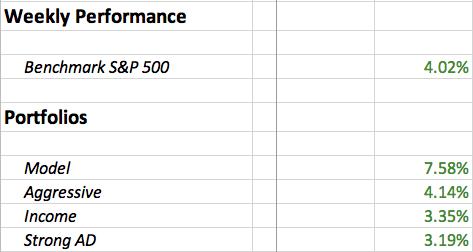
It was a strong week for U.S. stocks, including the benchmark S&P 500. Likewise, our portfolios also performed well, most notably our Model Portfolio, which continues to distance itself from the S&P 500.
Weekly Summary
Benchmark S&P 500:
The S&P 500 gained 4.02% last week. Leadership was quite strange, however, as materials (XLB), real estate (XLRE), and utilities (XLU) paved the way to higher prices. Financials (XLF) were the weakest group as treasury yields remain under pressure despite the strong jobs data out on Wednesday (ADP employment report) and Thursday (nonfarm payrolls).
Materials have done well since the U.S. Dollar Index ($USD) topped in mid-March. Personally, I do not expect this to last very long as the USD remains in a longer-term uptrend. But the short-term dollar weakness has played perfectly into XLB relative strength the past 3-4 months:
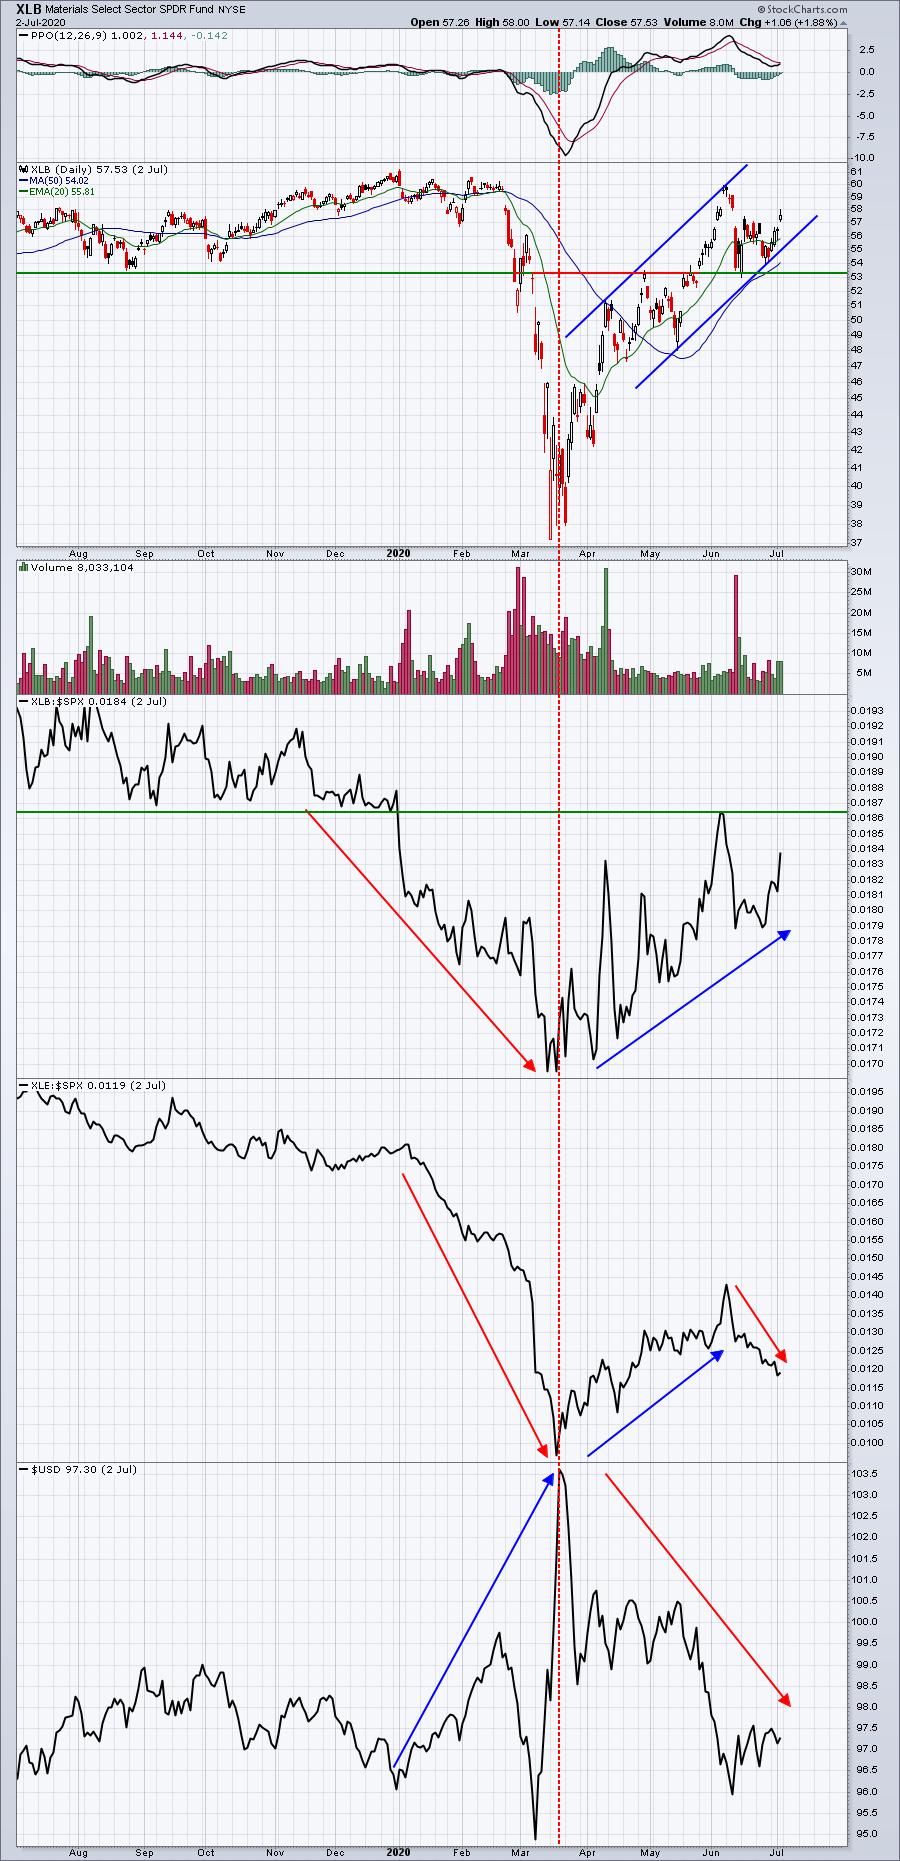
Energy (XLE) also got a lift for a couple months, but that group has already rolled back over on a relative basis. I'd remain exceptionally cautious of both the XLB and the XLE, unless the dollar loses major long-term trendline support. I'd watch the USD at 94-95. As long as that level holds, I'd continue to expect the dollar to rise in the second half of 2020 and both the XLE and XLB to underperform on a relative basis.
Model Portfolio:
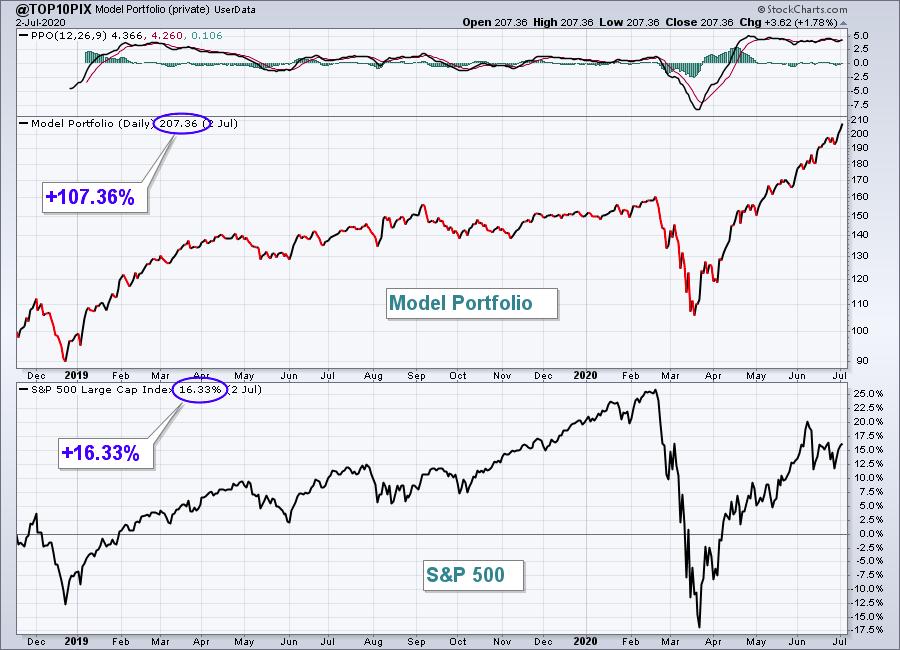
The Model portfolio surged another 7.58% last week, bringing its quarter-to-date return to 23.49% (vs. the S&P's 7.08%). Here's the updated inception-to-date chart of the portfolio:
Here are how the Model portfolio component stocks performed last week (these weekly summary results include the last 5 trading days, which technically includes Friday, June 26th - just an FYI):
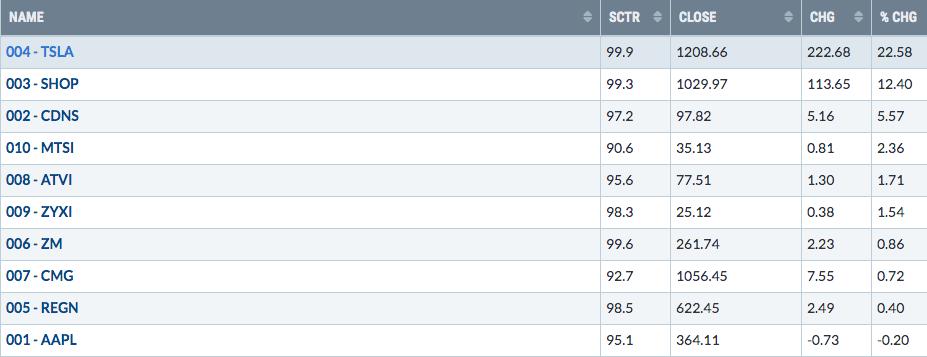
Tesla (TSLA) and Shopify (SHOP) set new all-time highs last week, carrying the Model Portfolio to further significant gains and relative outperformance.
Aggressive Portfolio:
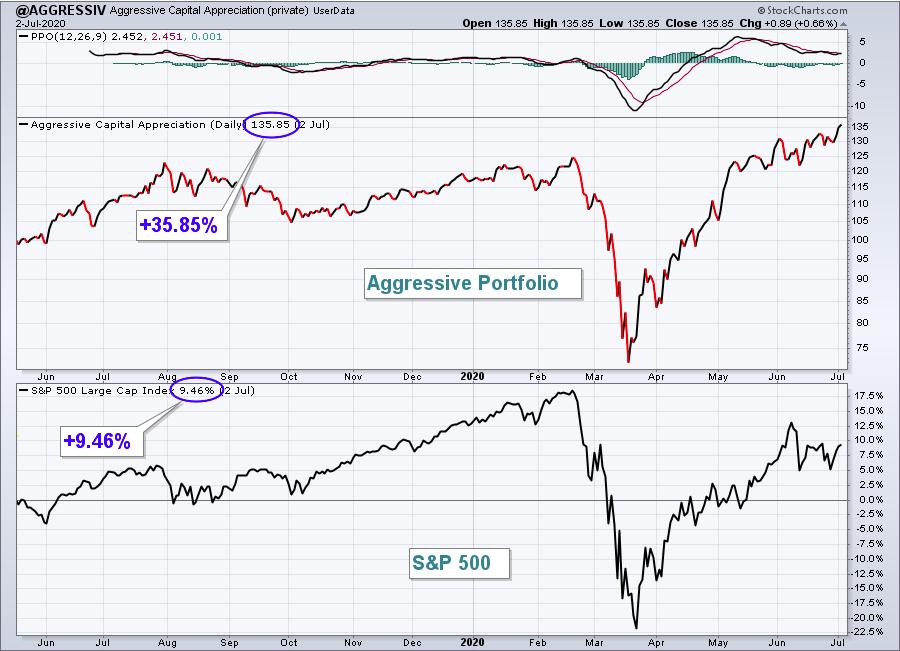
The Aggressive portfolio rose 4.14%, edging the benchmark S&P 500. Here's the Aggressive portfolio chart since its inception on May 19, 2019:
Here are how the Aggressive portfolio component stocks performed last week:
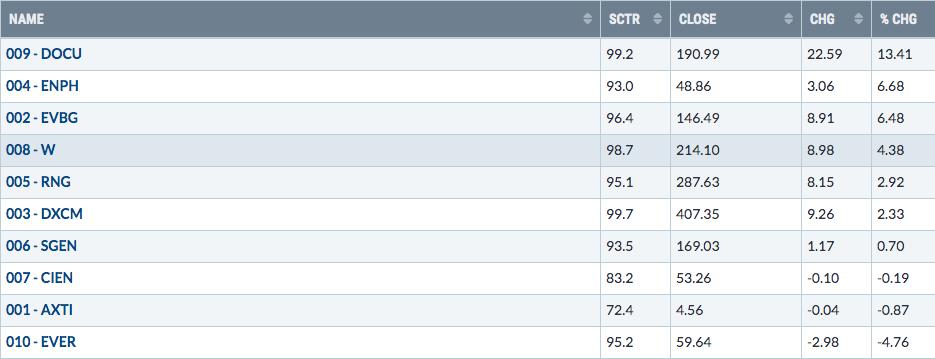
DOCU surged again last week as Wall Street undoubtedly expects to see robust earnings growth when the company reports its results on September 3rd.
Income Portfolio:
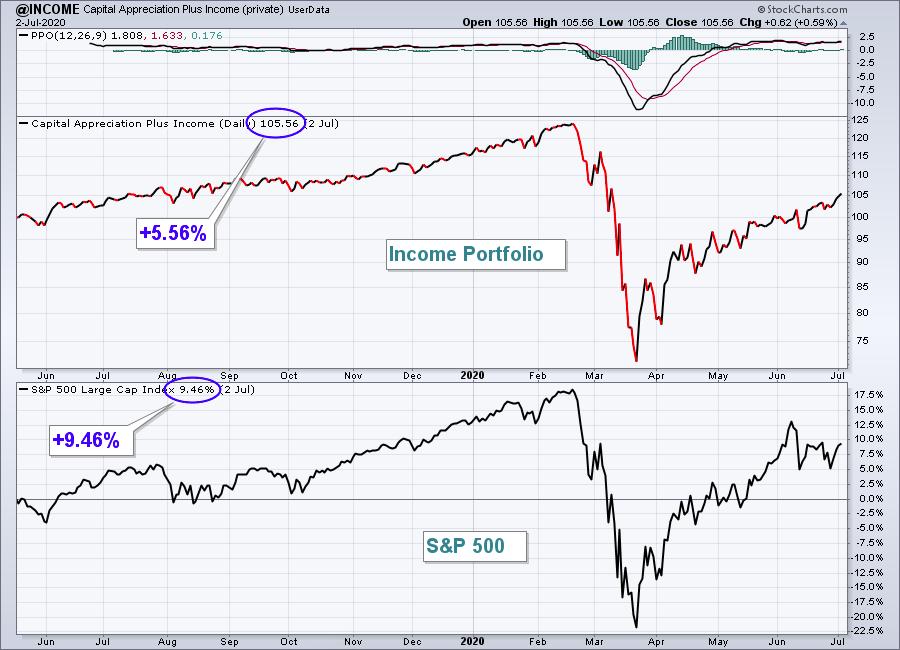
The Income portfolio rose 3.35% last week, which underperformed the benchmark, but we did see mostly strength from its component stocks . Here's a look at the inception-to-date chart:
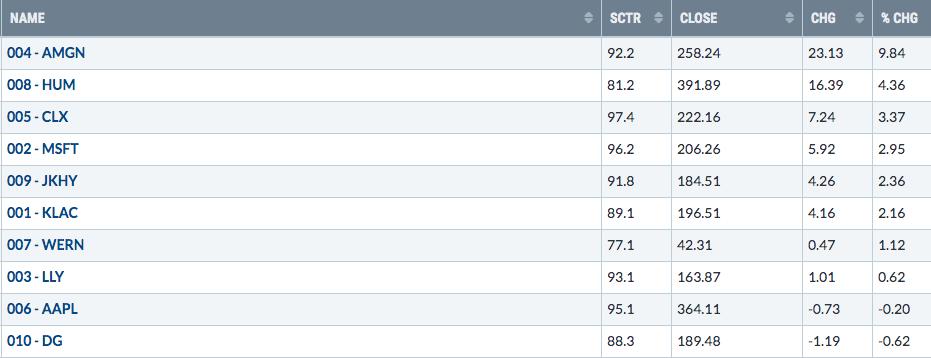
Here are how the Income portfolio component stocks performed last week:
Strong AD Portfolio:
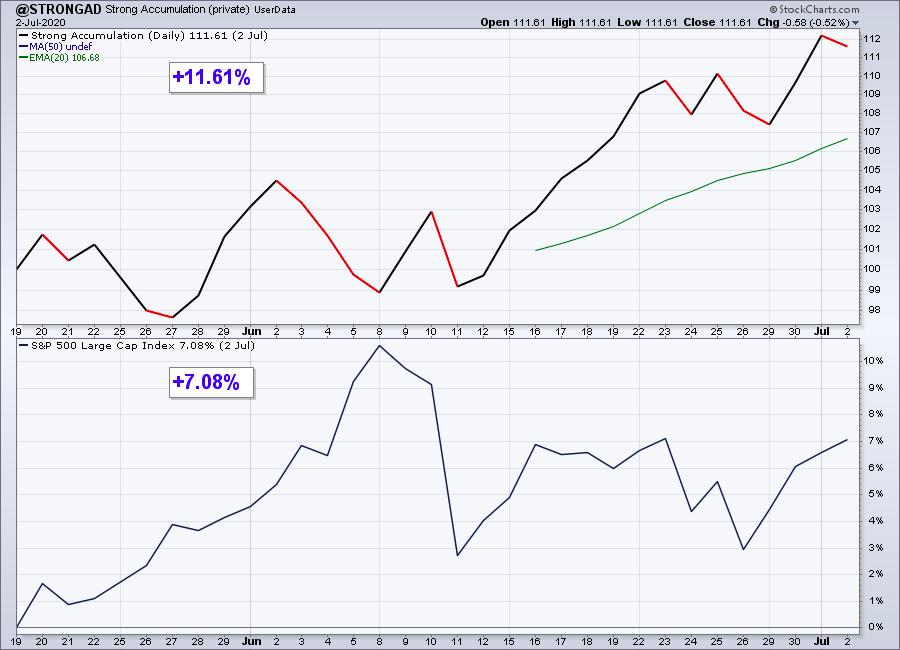
The Strong AD Portfolio climbed 3.19% last week, but trailed the S&P 500 by just under 1 percentage point. Here's a look at the inception-to-date chart:
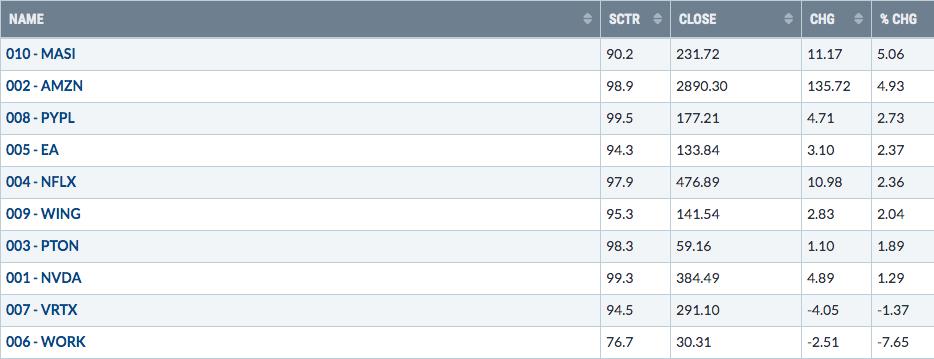
Here are how the Strong AD portfolio component stocks performed last week:
WORK has been one of the most challenging stocks in our portfolios. I do have to say, though, that the strong accumulation landed WORK on the Strong AD ChartList and, despite all the recent selling, its AD line remains exceptionally strong. Are institutions buying into this weakness? It appears to me that they are:
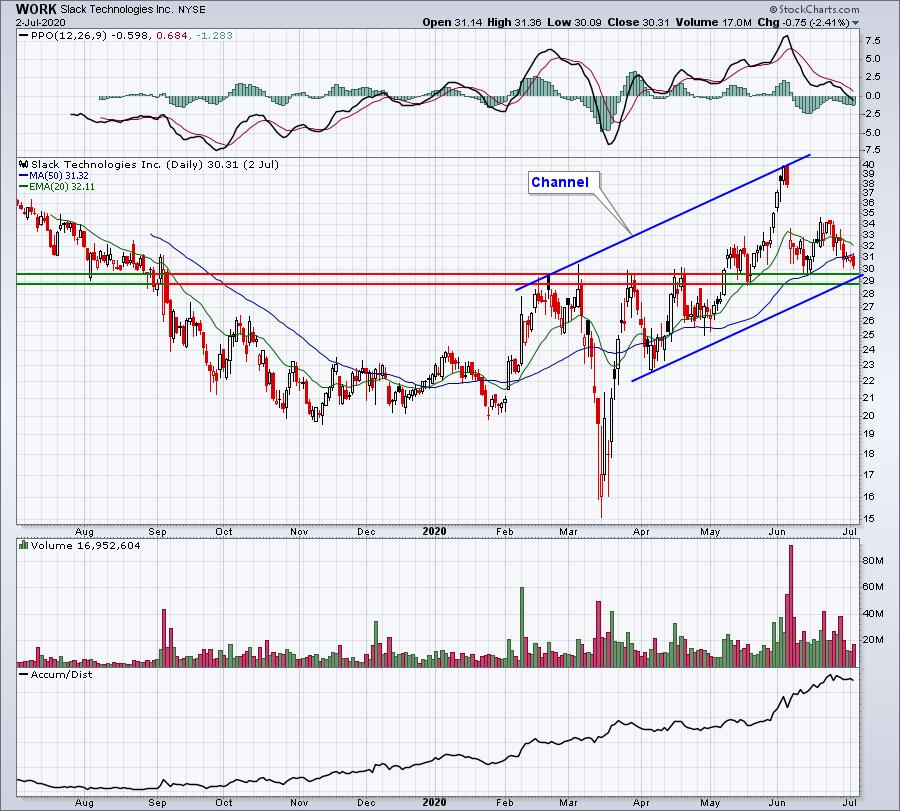
Since earnings - where WORK beat top and bottom line, by the way - the AD line has surged higher! Price action certainly seems weak, but that AD line might be painting a different story. The next week or two will be very interesting here as WORK remains in an up channel and is slightly above key price support. A close below 29 would begin to test the most bullish technicians, however.
Summary
Significant growth expectations are being built into areas of the market. Many of the industry groups that we've been discussing for a few months now - software, computer hardware, semiconductors, biotechs, toys, broadline retailers, specialty retailers, home improvement, etc. - are leading U.S. stocks higher and it's not by coincidence. Prepare for an onslaught of blowout earnings reports in these areas and others. Shopify (SHOP) has gained 250% since the March bottom. Wall Street knows the earnings will be explosive, not to mention the likelihood of significantly raised guidance.
I'm very bullish, as most of you know by now. I'm not bullish all stocks. Rather, I'm bullish the areas we've been discussing. I'd continue to stay away from airlines, cruise lines, hotels, gambling, REITs, banks, etc. The disparity in earnings reports will be shocking. It will likely be at least another quarter or two before we can truly assess the damage inflicted in these relative laggards. For now, I continue to look for the NASDAQ 100 to lead.
Keep in mind one thing. The absolute BEST of bull markets occurs when (1) the 10 year treasury yield ($TNX) is rising as money rotates from bonds to stocks and (2) small caps ($SML) and transportation stocks ($TRAN) are leading on a relative basis. We're seeing very little of that right now. I'll be speaking much more about this in tomorrow's "2020 2nd Half Market Outlook" webinar. Tune in if you get the chance. Otherwise, it'll be recorded and you can review it later at your convenience.
Happy trading!
Tom Bowley, Chief Market Strategist
EarningsBeats.com
"Better timing. Better trades."