
EB Weekly Portfolio Report - Sunday, July 12, 2020
Upcoming Earnings Reports
According to Zacks.com, the following companies will be reporting earnings this week and each is a component of one of our portfolios:
Monday, July 13: None
Tuesday, July 14: None
Wednesday, July 15: None
Thursday, July 16: NFLX
Friday, July 17: None
PLEASE NOTE: The above companies were provided after scanning the Zacks Earnings Calendar. My research is limited to what Zacks provides and I also can make a mistake from time to time, so please check for earnings dates for all companies that you own. We do hold our portfolio stocks through one earnings report, but every EarningsBeats.com member must make their own investing/trading decisions about holding stocks into earnings reports as it's the most volatile (risky) time to own a stock.
Portfolio Rules and Objectives
Here are the common traits and objectives of each portfolio, some of these were changed for our May 19th "draft" day recently (changes for the May 19 to August 19 quarter are in bold italics):
- We have removed the Character Change portfolio and added a new Strong AD portfolio
- There are 10 leading stocks from up to 10 leading industries in each portfolio (at the time of selection). Generally, there will only be one stock per industry group, but there could be exceptions.
- They are held for an entire 90 day period, with no stops in place. We strive for consistency, transparency, and simplicity in our portfolios. EB.com members may hold these stocks for the entire 90 days, trade them, use stops, etc., but for purposes of our calculation, we will make no exceptions to our "buy and hold for three months" strategy.
- Every stock will generally be held through ONE earnings report
- The expectation is that relative winners will carry the portfolio to outperformance
- They will all be entered into as of close on Tuesday, May 19th; members may choose to try to time better entries, but EB.com will "purchase" as of May 19th's closing price
- Primary objective is to outperform the benchmark S&P 500
Here are several considerations for EB members:
- I would expect the Strong AD and Aggressive portfolios to be the riskiest, followed by the Model portfolio, and then the Income portfolio
- The Strong AD portfolio will be selected from a combination of rising accumulation/distribution lines and SCTRs above 80 at the time of selection. It will be our only portfolio that does NOT require a revenue and EPS beat in its most recent quarterly earnings report
- The Income portfolio stocks will all pay dividends, with the expected average dividend yield to be at least 1.5%
- Drawdowns (losses) should be much milder on the Income portfolio, with more volatility expected on the other three; please review inception-to-date charts below to gain an idea of the volatility associated with each
- I believe the larger drawdown on the Income portfolio last quarter was an anomaly occurring as a result of the pandemic as many defensive, higher-yielding companies uncharacteristically underperformed during a market decline.
- You should own or trade these stocks in whatever manner is most comfortable for you; while we will buy all 10 stocks in the manner identified above, feel free to trade certain stocks or wait for pullbacks if the stocks are overbought
- We have no idea what risk each member is willing or able to take. We are not registered investment advisors so be sure you understand the risk you take. Please consult your financial advisor.
- EarningsBeats.com shareholders/employees may own all or some of the portfolio stocks from time to time.
Weekly Snapshot
Here's a weekly recap:
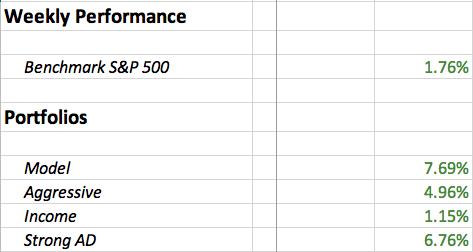
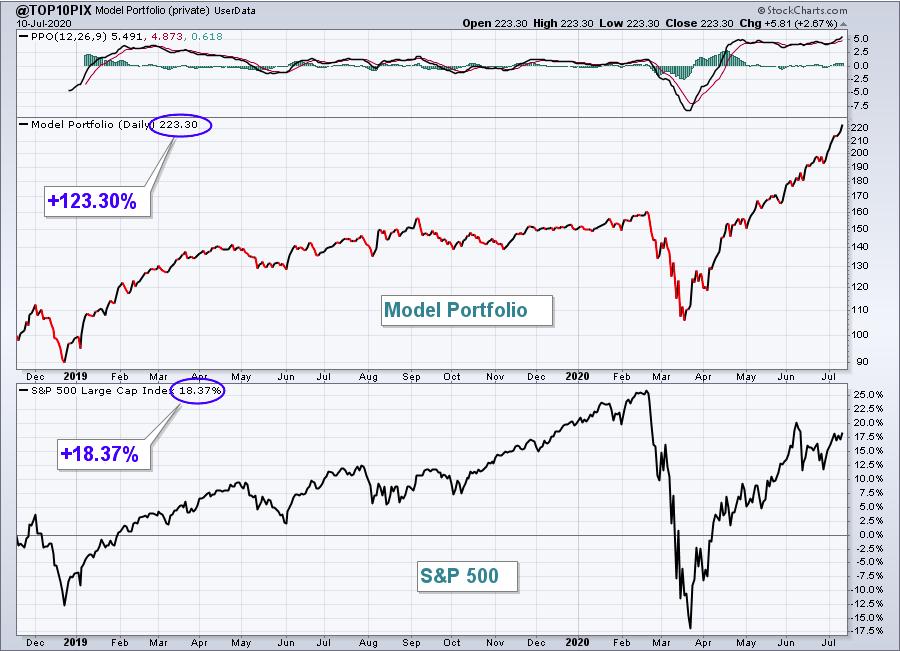
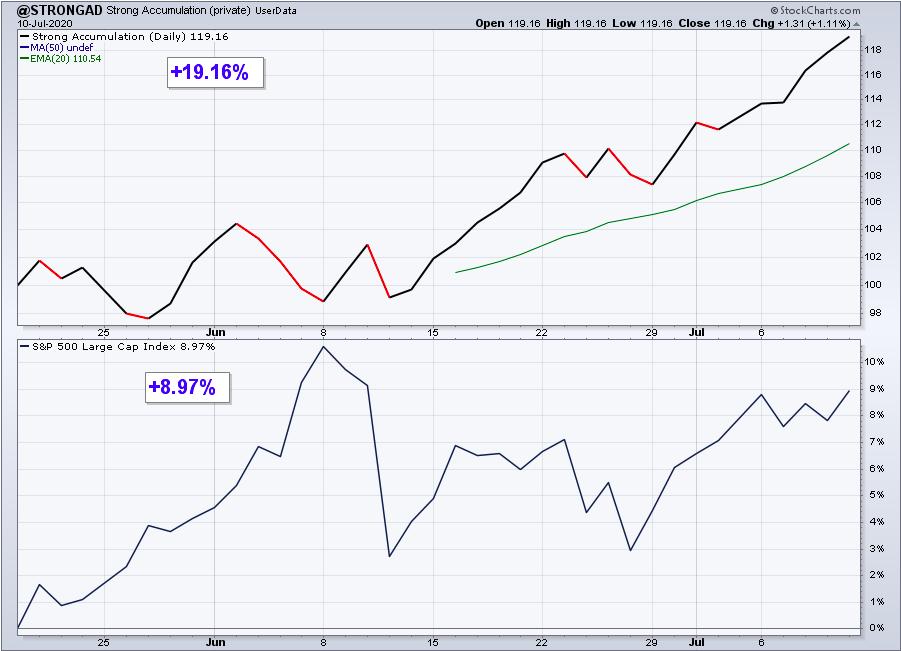
It was another solid week for U.S. equities, but an even better week for our EarningsBeats.com portfolios. The Model Portfolio and Strong AD Portfolio are simply steamrolling the S&P 500 this quarter. The Model Portfolio is now up more than 123% since its inception on November 19, 2019. That compares quite favorably with the S&P 500's rise of just over 18%. This quarter alone, the Model Portfolio is up 32.98% now (in less than 8 weeks!), while the S&P 500 has also risen nicely at 8.97%. When I say "this quarter", I'm referring to our portfolio quarter, which runs from May 19th through August 19th, not a calendar quarter.
The Strong AD has been very impressive as well, considering that it fell behind by 10-11 percentage points after its first three weeks of existence. If you recall, this quarter began with many of the beaten-down groups seeing big rallies and those COVID-19 paradigm shift stocks suffering mightily on a relative basis. That went completely against the grain of the purpose of this portfolio, which was to concentrate in many of the best performing pandemic stocks - those that showed tremendous accumulation back during the March/April market turmoil. Since June 8th, however, the Strong AD Portfolio has absolutely dominated the S&P 500. After falling behind by those 10-11 percentage points after 3 weeks, it has reversed course and has trounced the S&P 500 since June 8th, rising 20.51% since that time. How has the S&P 500 done since June 8th? -1.46%. I expected to see the pandemic stocks do much better as we headed towards Q2 earnings and I think recent performance is supporting this strategy. As strong as the Strong AD Portfolio has been since that June 8th low (again, +20.51%), it has trailed the Model Portfolio (+22.33%) over that same time frame. I can't stress enough that this outperformance has occurred with equal-weighted portfolios of 10 different stocks in varying industry groups. If I hadn't experienced and seen this with my own eyes, I would have said it was impossible to outperform like that over just a 5 week period. But we've been fortunate and we've done it.
Weekly Summary
Benchmark S&P 500:
The S&P 500 gained 4.02% last week.
Model Portfolio:
The Model portfolio spiked yet another 7.69% last week, on top of its 7.56% rise the week prior, and it crushed the S&P 500. Here's the updated inception-to-date chart of the portfolio:
Here are how the Model portfolio component stocks performed last week:
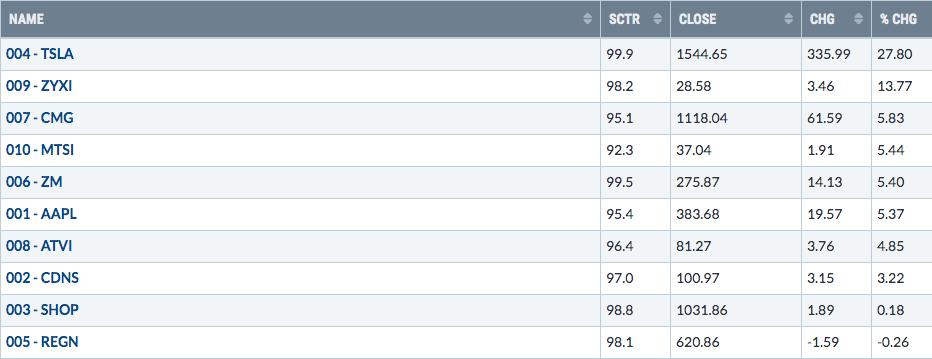
TSLA made what would be considered a great annual return during the past week. ZYXI tacked on another 13.7% last week as it gained 11% on Friday alone - and on increasing volume once again.
Aggressive Portfolio:
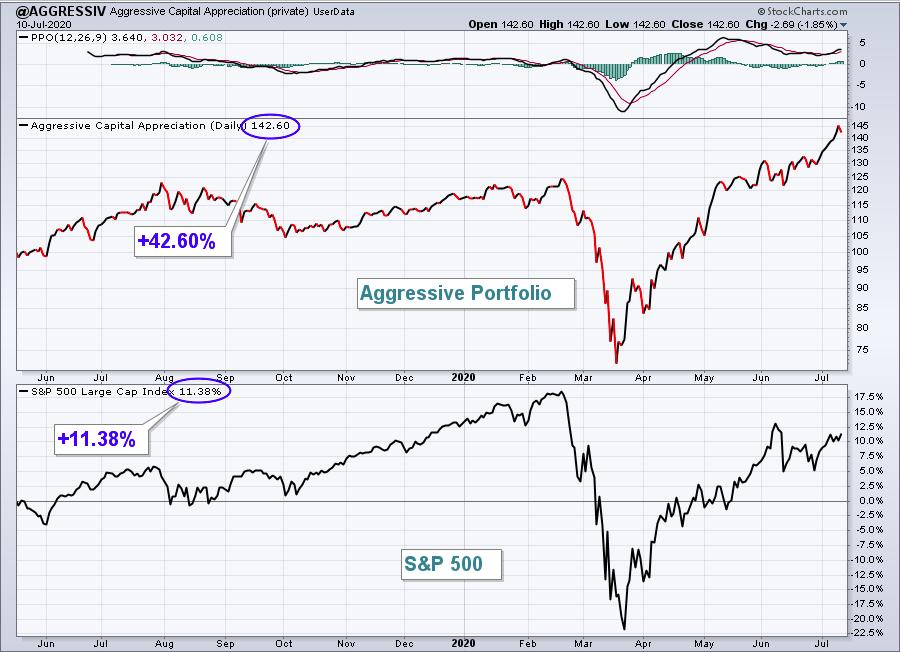
The Aggressive portfolio rose 4.96%, easily outpacing the benchmark S&P 500. Here's the Aggressive portfolio chart since its inception on May 19, 2019:
Here are how the Aggressive portfolio component stocks performed last week:
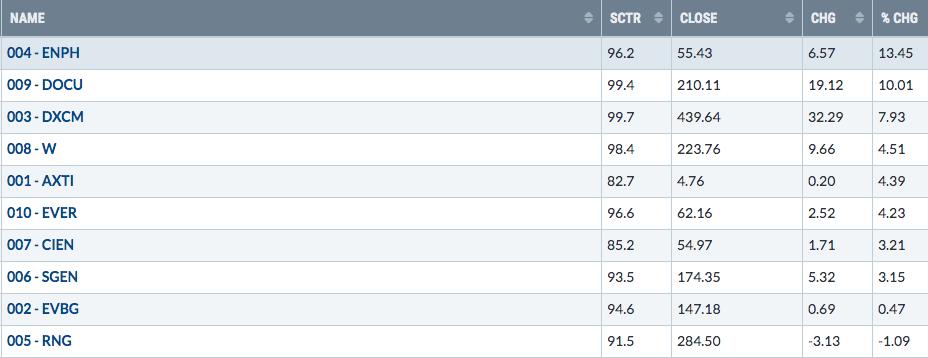
One question that frequently arises regarding our portfolios is "why don't you have stops in place?" Well, our answer is that (1) we want our portfolios to be simple in nature, and (2) we want these portfolios to be "buy and hold", but only for three months to appeal to those who are not traders at heart and many of whom work throughout the day and do not have time to monitor stock positions. It's quite honestly the best of both worlds for a longer-term "hands-off" type investor. Your portfolio is simply repositioned four times a year, which takes very little time, but you benefit from our philosophy of marrying strong fundamentals with excellent technicals. Your money is always invested in leading stocks. Why do I mention this here? Well, this past week ENPH was the Aggressive Portfolio's best performer, gaining 13.45%. If we had stops in place, ENPH surely would have been stopped out:
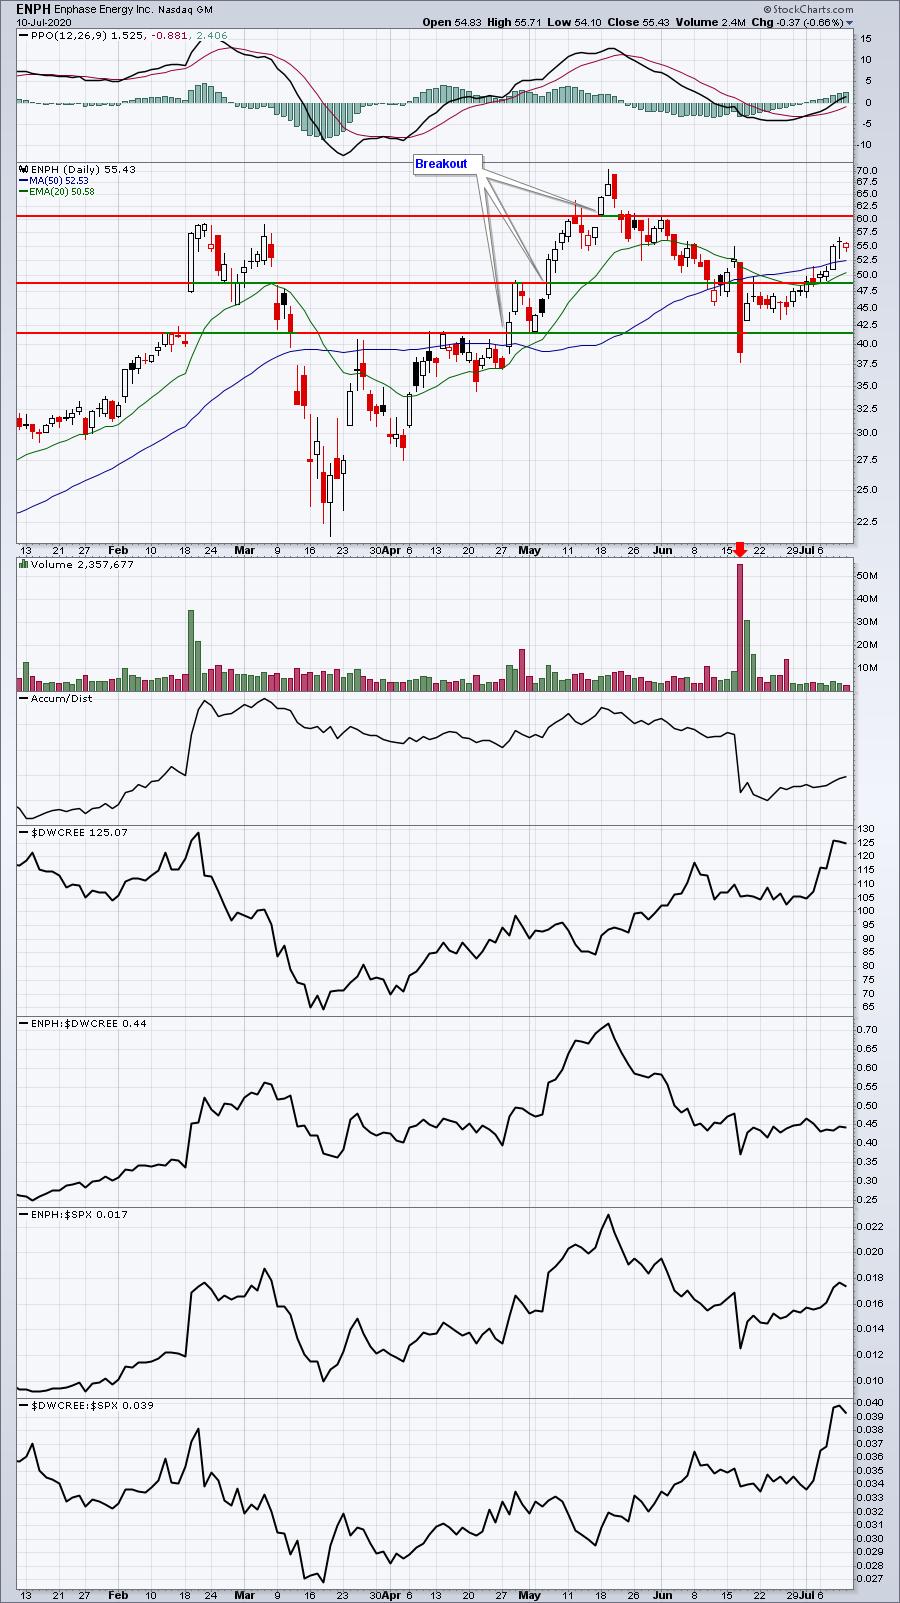
As a trader, there's no way that I'd have held ENPH throughout the entire downtrend from mid-May to mid-June. No chance. Zero. But these portfolios are not designed for frequent traders. That's the key. I trade the stocks in these 4 portfolios often. They are obviously many of my favorite stocks. If they weren't, they wouldn't be in the portfolios. So clearly those who invest in the portfolios must be of that longer-term, buy-and-hold mindset. Otherwise, you're going to ask that question over and over and over again......why are there no stops? The idea is to invest (not trade) in 10 leading stocks in 10 leading industries. Some days, weeks, months, and even quarters, this strategy isn't going to work. But you're in it for the long haul. It's a different mindset to be an investor vs. a trader. Please keep that in mind when deciding whether investing in these portfolios is right for you.
Income Portfolio:
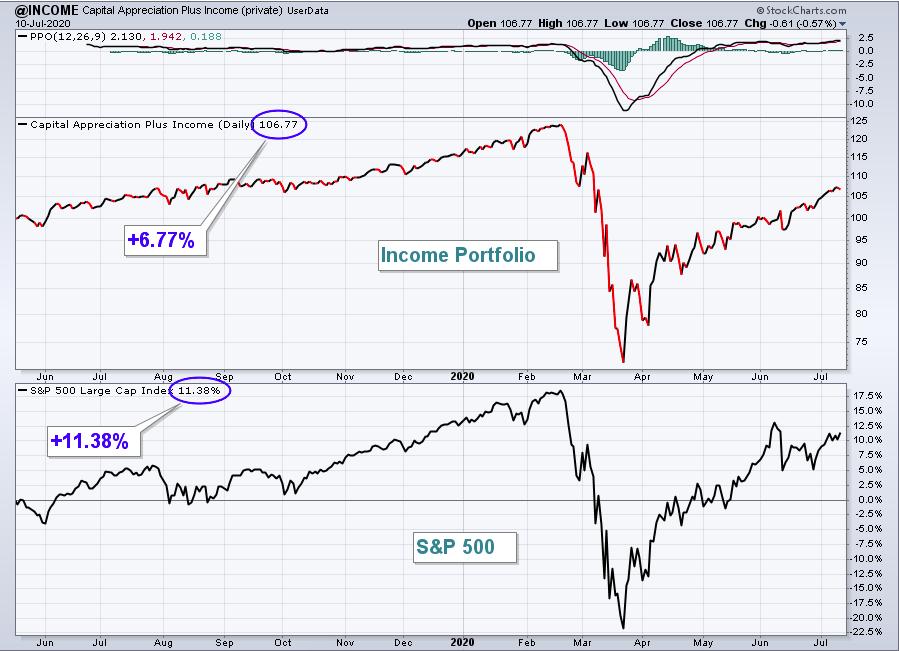
The Income portfolio rose 1.15% last week, which trailed the benchmark by a little more than a half percentage point. Here's a look at the inception-to-date chart:
Here are how the Income portfolio component stocks performed last week:
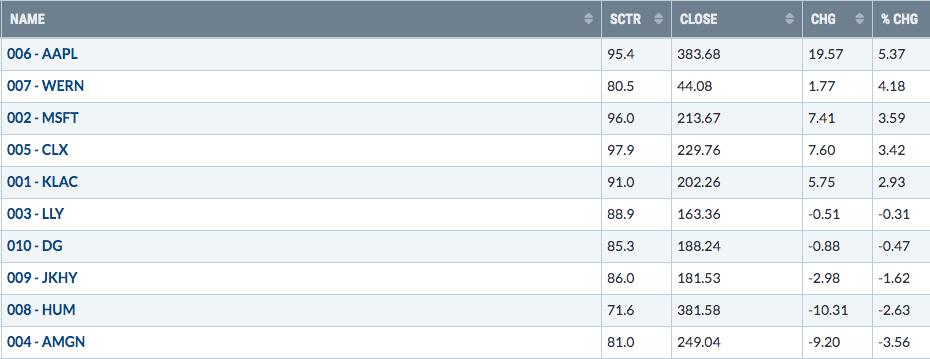
The Income Portfolio slightly underperformed the S&P 500 last week for one reason: Health care lagged. Our Income Portfolio is our only portfolio with 3 health care stocks - LLY, HUM, and AMGN. All three were down last week. While health care wasn't the worst sector last week, it did finish the week in negative territory:
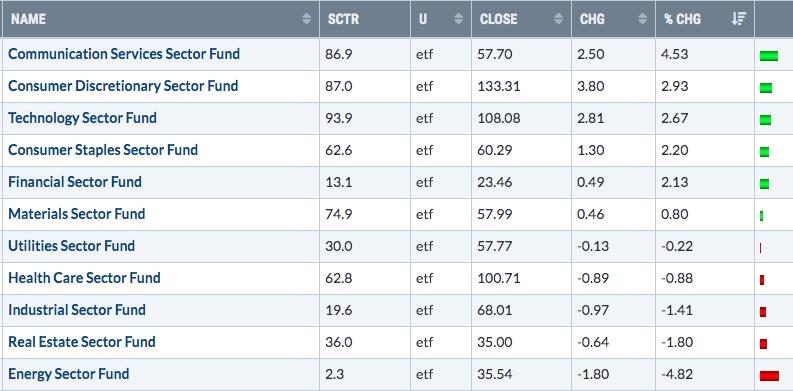
The positive for us, however, was that the leading sectors last week are very well represented in our portfolios.
Strong AD Portfolio:
The Strong AD Portfolio soared 6.76% last week, continuing its dominating outperformance of the S&P 500 since June 8th. Here's a look at the inception-to-date chart:
Here are how the Strong AD portfolio component stocks performed last week:
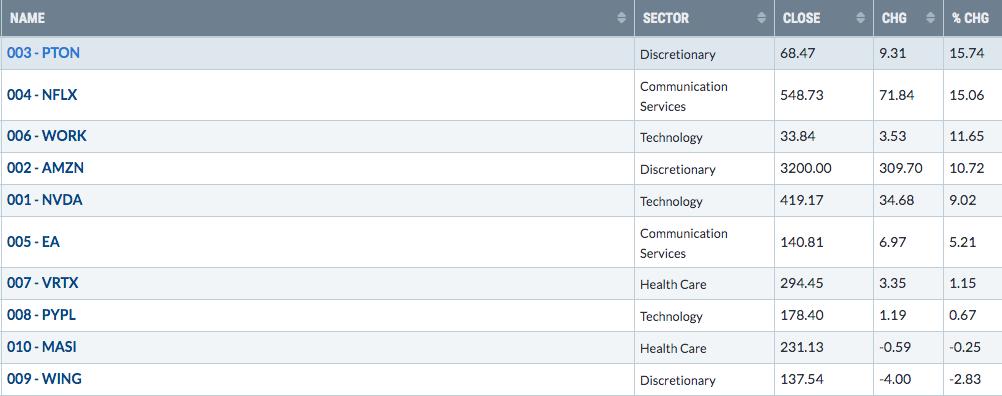
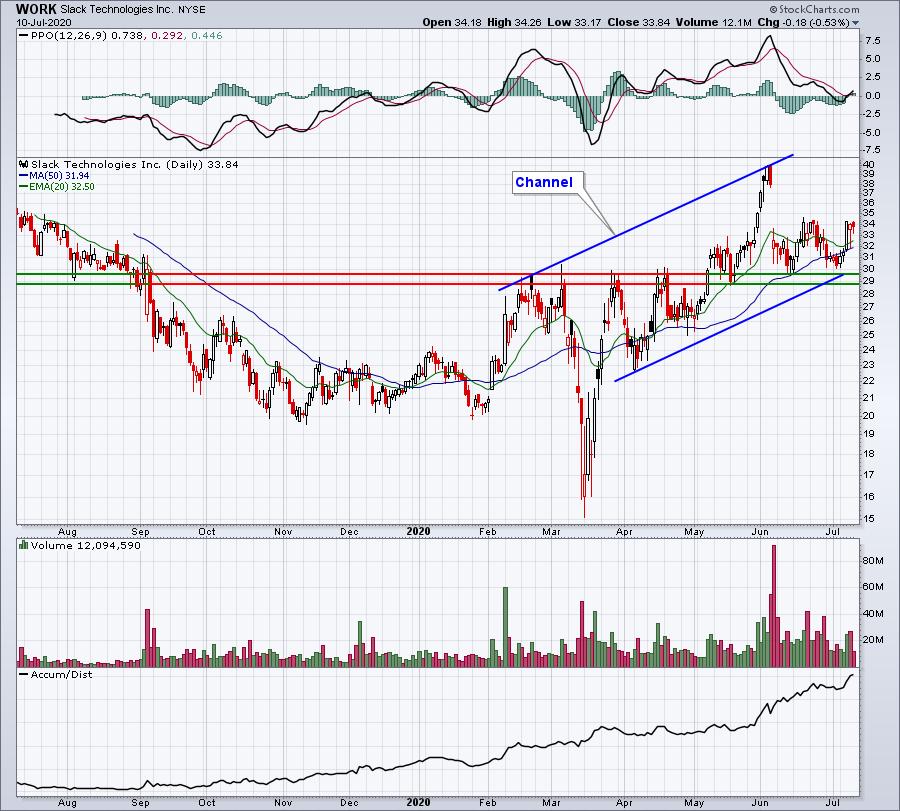
Four of our Strong AD Portfolio stocks gained more than 10%, including WORK, which I discussed in last week's EB Weekly Portfolio Report. As a refresher, I discussed the possible channel that WORK remained in and I also highlighted the fact that its post-earnings selloff was accompanied by a further rise in its AD (accumulation/distribution) line. It appeared that WORK was still under accumulation and this past week could be the start of another leg higher. A close above 34.50 would add to that argument:
Summary
The week ahead will be extremely interesting. Earnings will be in focus as we kickoff our next earnings season. Banks ($DJUSBK) will be immediately put on the hot seat with JP Morgan (JPM), Citigroup (C), Wells Fargo (WFC), Bank of America (BAC), and PNC Financial (PNC) all reporting results between Tuesday and Thursday. Then there's Delta Airlines (DAL) reporting on Tuesday. I'm not expecting much out of any of these companies, but they've been beaten up very badly on a relative basis the past several weeks, so much bad news is already built in. Therefore, the most important part of their reports is not necessarily their reports. It's the REACTION to their reports.
From an EarningsBeats.com perspective, the biggest key this week will be Netflix (NFLX), which reports its quarterly results on Thursday after the market closes. It's going to be BIG, but how big? Big enough to carry the stock higher after its already-huge pre-earnings run? NFLX has surged 35% higher in the past 5-6 weeks. I do not in any way, shape, or form, believe that the run in NFLX is over. I see NFLX going much, much higher. But will there be a pause after its earnings? That's the more perplexing question from a short-term trader's perspective. When you own a stock, there's not a lot of things more bullish than a major relative breakout vs. the S&P 500. After three equal relative highs in March, April, and May, NFLX broke out to a new relative high last week with a HUGE relative exclamation point on Friday.
I'm also very interested in watching how two transportation stocks report and the type of market reaction they receive. JB Hunt Transports (JBHT), a prominent trucking company ($DJUSTK), will report on Thursday after the bell and we'll get our first glimpse as to whether the strength we've been seeing in trucking is justified. I look for a very good report. Next, Kansas City Southern (KSU) reports on Friday before the opening bell. There's a very strong correlation between major surges in railroads ($DJUSRR) and S&P 500 melt ups over the years. A strong report by KSU and strong market reaction would be another excellent sign for U.S. equities as we move into the more treacherous summertime season.
Happy trading!
Tom Bowley, Chief Market Strategist
EarningsBeats.com
"Better timing. Better trades."