
EB Weekly Portfolio Report - Sunday, September 6, 2020
Upcoming Earnings Reports
According to Zacks.com, the following companies will be reporting earnings this week and each is a component of one of our portfolios:
Monday, September 7: None - market closed for Labor Day holiday
Tuesday, September 8: LULU
Wednesday, September 9: None
Thursday, September 10: PTON
Friday, September 11: None
PLEASE NOTE: The above companies were provided after scanning the Zacks Earnings Calendar. My research is limited to what Zacks provides and I also can make a mistake from time to time, so please check for earnings dates for all companies that you own. We do hold our portfolio stocks through one earnings report, but every EarningsBeats.com member must make their own investing/trading decisions about holding stocks into earnings reports as it's the most volatile (risky) time to own a stock.
Portfolio Rules and Objectives
Here are the common traits and objectives of our portfolios:
- There are 10 leading stocks from up to 10 leading industries in each portfolio (at the time of selection). Generally, there will only be one stock per industry group, but there could be exceptions.
- They are held for an entire 90 day period, with no stops in place. We strive for consistency, transparency, and simplicity in our portfolios. EB.com members may hold these stocks for the entire 90 days, trade them, use stops, etc., but for purposes of our calculation, we will make no exceptions to our "buy and hold for three months" strategy.
- Every stock will generally be held through ONE earnings report
- The expectation is that relative winners will carry the portfolio to outperformance
- They were all entered into as of the close on Wednesday, August 19th; members may choose to try to time better entries, but EB.com will "purchase" as of August 19th's closing price
- Primary objective is to outperform the benchmark S&P 500
Here are several considerations for EB members:
- I would expect the Strong AD and Aggressive portfolios to be the riskiest, followed by the Model portfolio, and then the Income portfolio
- The Strong AD portfolio will be selected from a combination of rising accumulation/distribution lines and SCTRs above 80 at the time of selection. It is the only portfolio that does NOT require a revenue and EPS beat in its most recent quarterly earnings report
- The Income portfolio stocks will all pay dividends, with the expected average dividend yield to be at least 1.5%
- Drawdowns (losses) should be much milder on the Income portfolio, with more volatility expected on the other three; please review inception-to-date charts below to gain an idea of the volatility associated with each
- I believe the larger drawdown on the Income portfolio at the beginning of the pandemic was an anomaly, occurring as many defensive, higher-yielding companies uncharacteristically underperformed during a market decline.
- You should own or trade these stocks in whatever manner is most comfortable for you; while we will buy all 10 stocks in the manner identified above, feel free to trade certain stocks or wait for pullbacks if the stocks are overbought
- We have no idea what risk each member is willing or able to take. We are not registered investment advisors so be sure you understand the risk you take. Please consult your financial advisor.
- EarningsBeats.com shareholders/employees may own all or some of the portfolio stocks from time to time.
Weekly Snapshot
Here's a weekly recap:
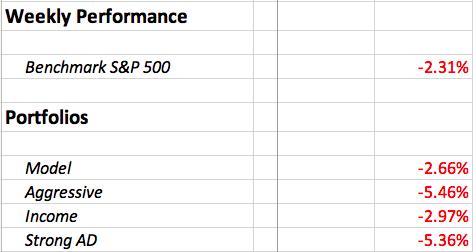
The growth vs. value trade (IWF:IWD) suffered last week as many growth names were hit hard, and that most certainly played a role in the underperformance of our portfolios. The Model and Income portfolios held up relatively well, but the Aggressive and Strong AD portfolios did not. It's been a particularly difficult quarter thus far for the Aggressive Portfolio, although I believe the stocks that comprise it should do relatively well over the coming weeks.
Weekly Summary
Benchmark S&P 500:
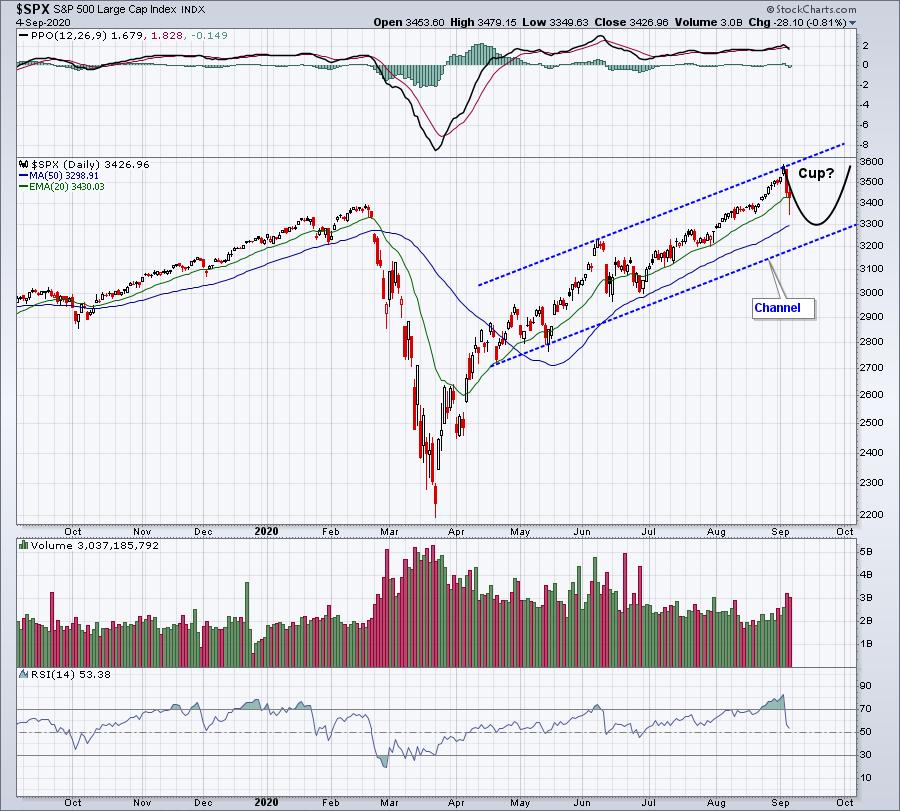
The benchmark S&P 500 fell 2.31% last week as the risk of rising volatility finally began to play out in the form of selling. It is quite possible that we've seen a significant short-term top in stock prices, marked by an initial heavy volume selloff:
Model Portfolio:
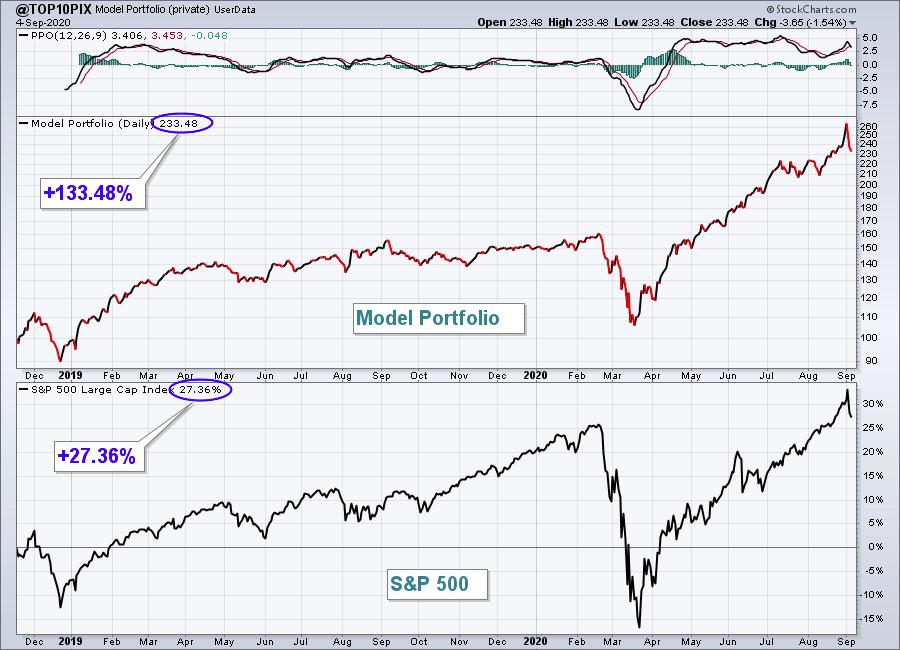
The Model portfolio fell 2.66%, trailing slightly the S&P 500. Here's the updated inception-to-date chart of the portfolio:
Here are how the Model portfolio component stocks performed last week:
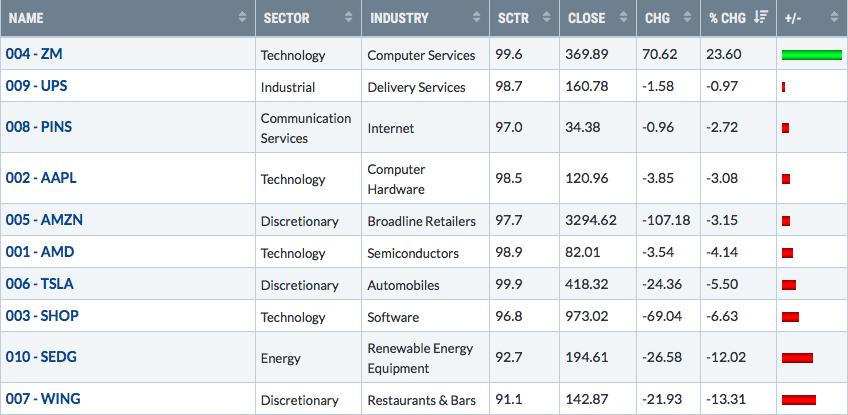
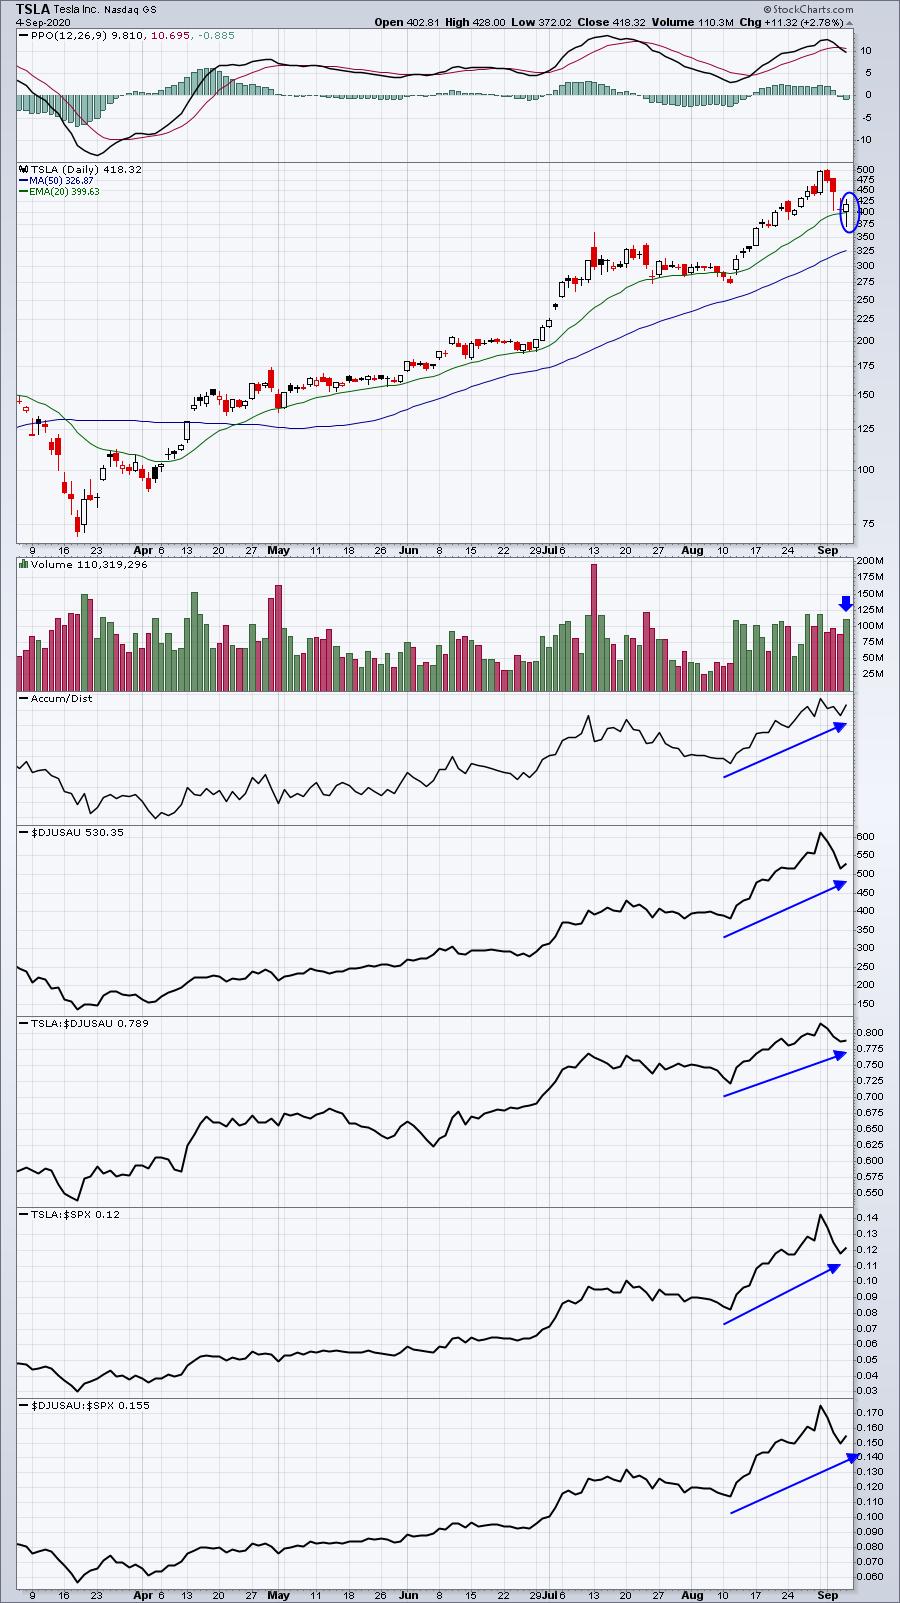
It was evident that the only reason the Model Portfolio kept up with the S&P 500 last week was due to the reaction to ZM's blowout quarterly earnings report. But there were other positives to take away as well. Tesla (TSLA), the target of many shorts and many market naysayers, finished on a very positive note Friday, printing a hammer on its 20 day EMA:
Aggressive Portfolio:
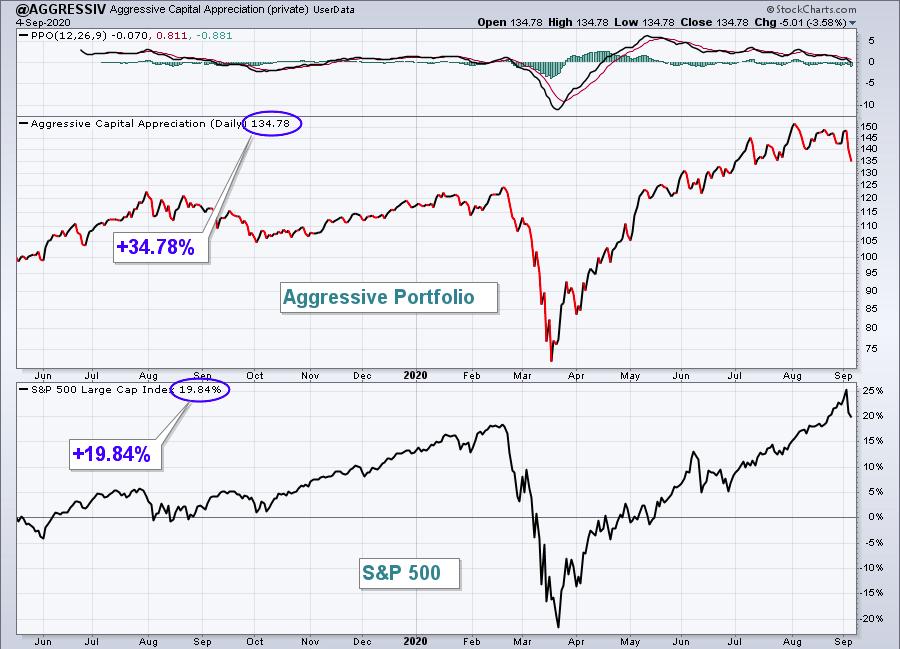
The Aggressive portfolio continued to struggle on both an absolute and relative basis last week, falling 5.46%.
Here's the Aggressive portfolio chart since its inception on May 19, 2019:
Here are how the Aggressive portfolio component stocks performed last week:
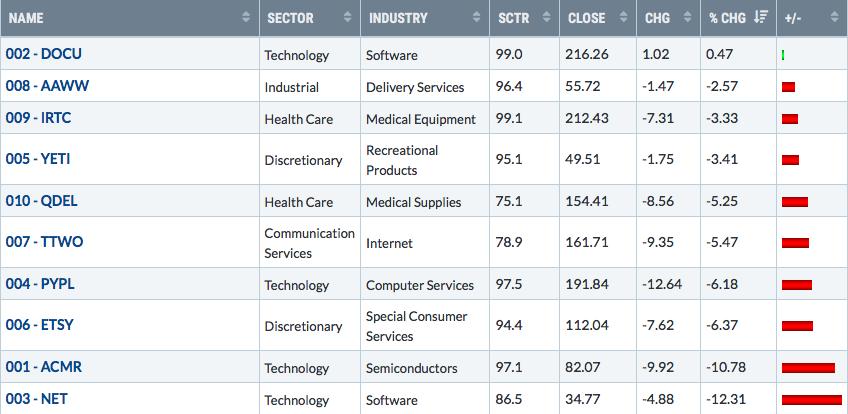
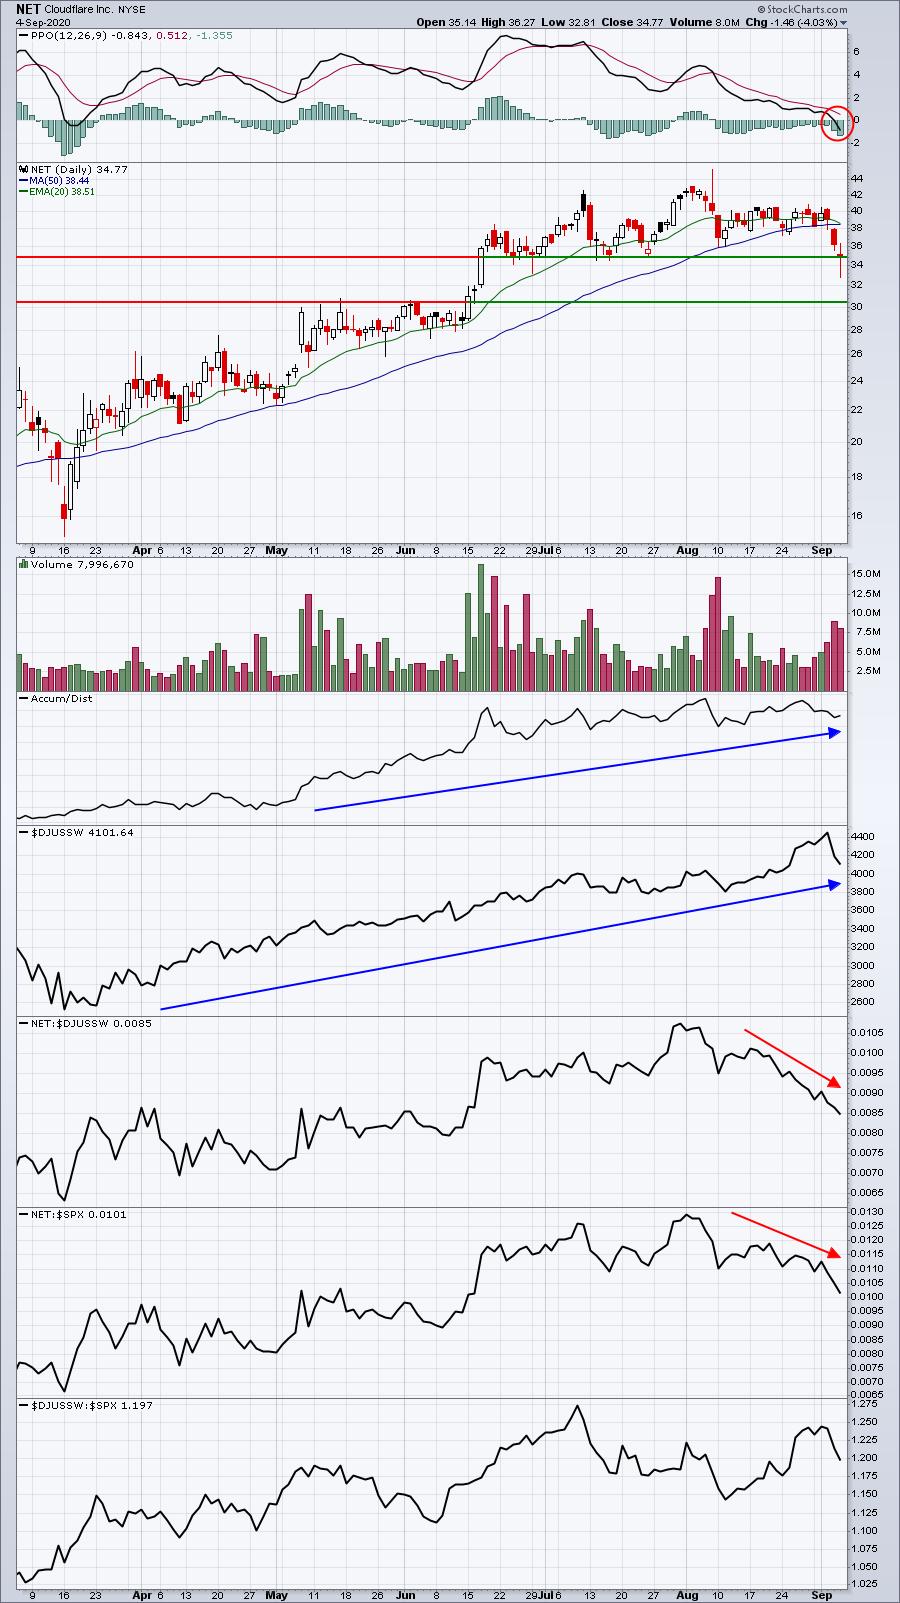
Outside of DOCU, technology stocks clearly had a detrimental effect on the Aggressive Portfolio last week. While overexposure of tech stocks has been beneficial throughout much of the pandemic, that was not the case last week. Only energy (XLE) underperformed technology (XLK) last week. Cloudflare (NET) had a particularly rough week, but did rebound to cling to near-term support. The two key support levels are provided below:
Income Portfolio:
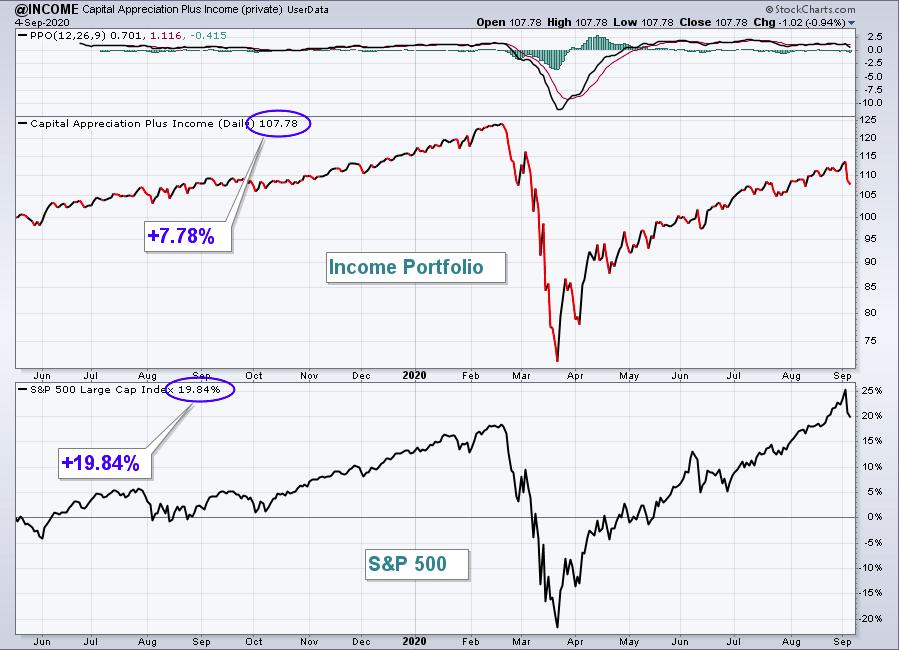
The Income portfolio dropped 2.97%, but managed to stay fairly close to the benchmark S&P 500's performance. Here's a look at the inception-to-date chart:
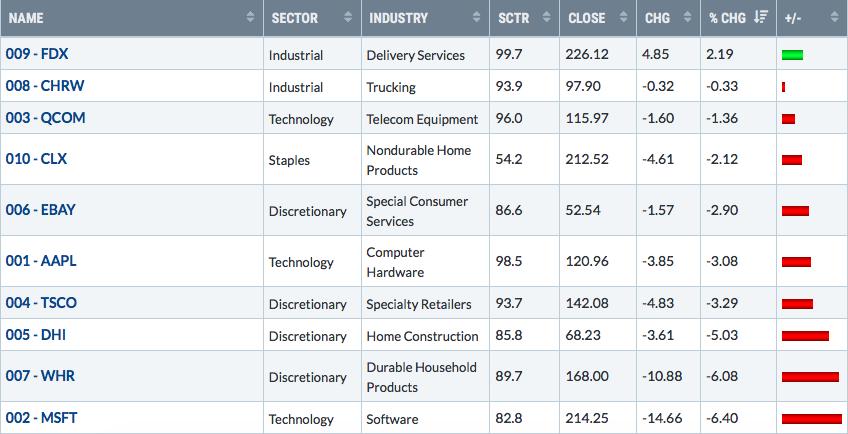
Here are how the Income portfolio component stocks performed last week:
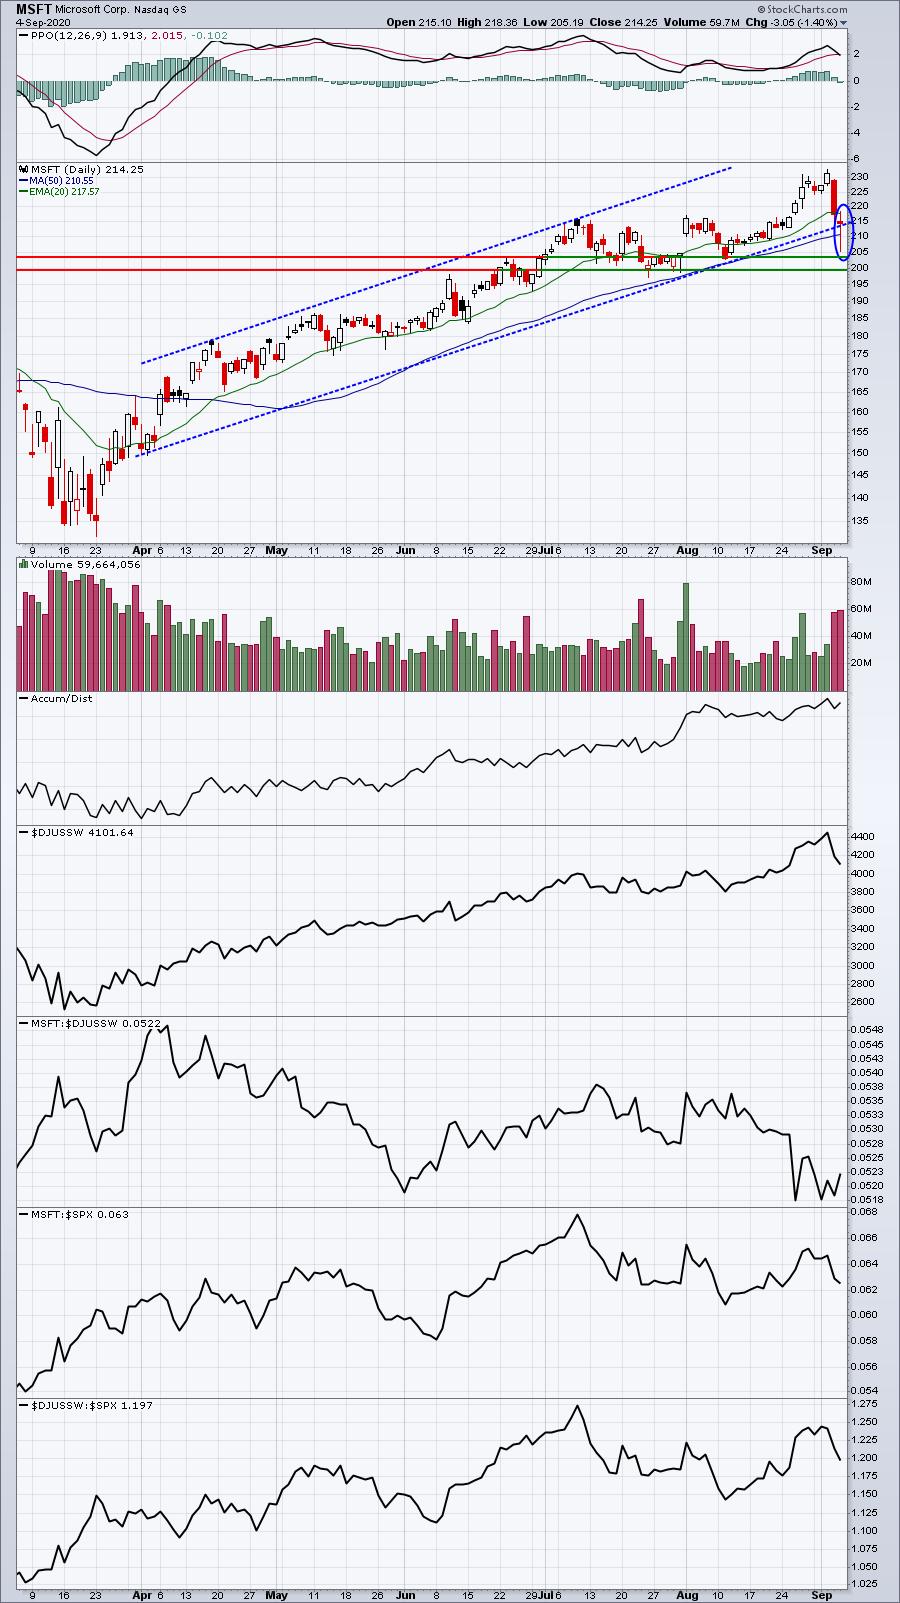
None of the Income Portfolio stocks had a disastrous week, but Microsoft (MSFT) did see its first 50 day SMA test since moving above this key moving average during the second week of April:
Strong AD Portfolio:
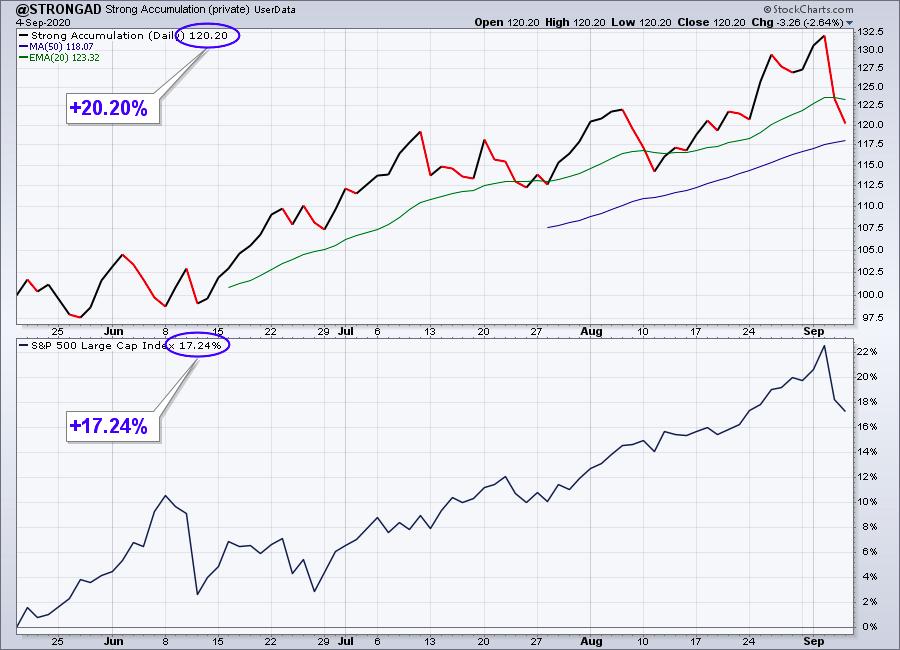
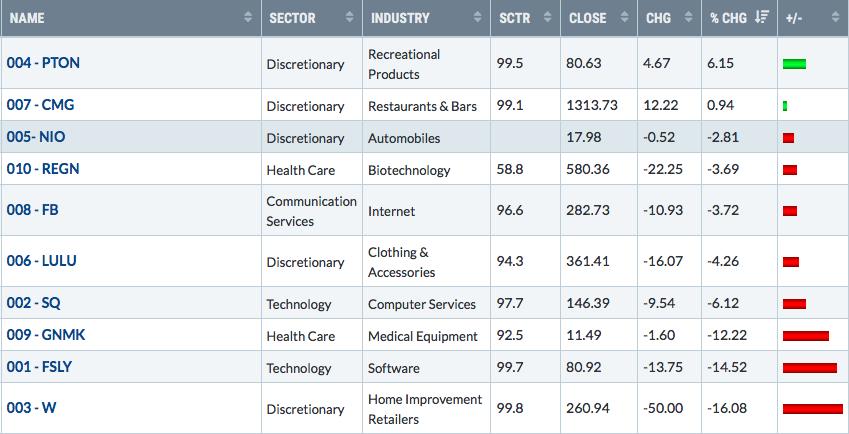
The Strong AD Portfolio, one of our best portfolios of late, tumbled 5.36% last week, as its significant outperformance since its inception narrowed. Here's a look at the inception-to-date chart:
Here are how the Strong AD portfolio component stocks performed last week:
One constant among many of our portfolio stocks, even the worst performers, is that their AD lines (accumulation/distribution) remain quite strong. GenMark Diagnostics (GNMK) is a perfect example of this. It's downtrending and below its 50 day SMA, its PPO is in negative territory and it still has further to go to reach a major support level, but there still appear to be many willing buyers as it falls:
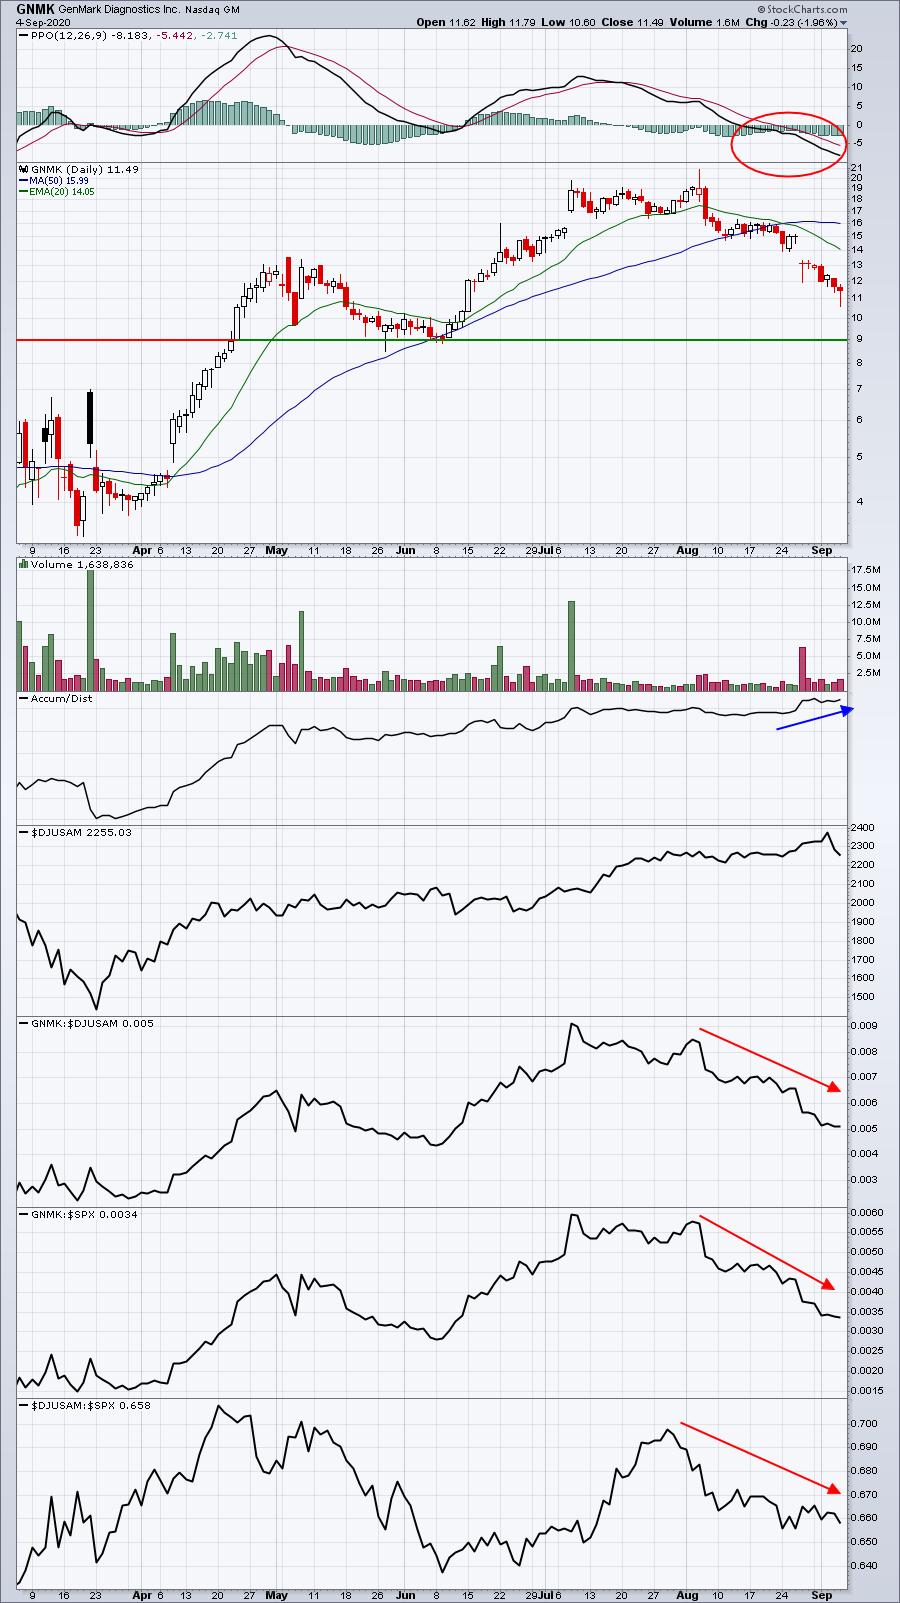
As you are aware (or should be aware), we take a "buy and hold" approach to all of our portfolio stocks. We will hold them all until November 19th. That might be a good thing for stocks like GNMK, allowing them time to recover, or it could have a major negative impact if the current downtrend continues. But our strategy is to hold them through the entire 90 day period, just as you would with the "buy and hold" strategy. We hear from many of our members who take different approaches with our portfolios, however, which is completely fine. Please do what's most comfortable for you. From a trading perspective, GNMK will likely see significant technical resistance at gap resistance and its declining 20 day EMA, currently in the 13-15 range.
Summary
I find this to be the most challenging time of the year. Historically, the market tends to grow more nervous as we work our way through the late-summer stage and there remain plenty of reasons to be nervous - from the pandemic and election to serious overbought conditions (though much less overbought after last week's rout on the NASDAQ).
Last week, I was issuing warnings about equity prices rising while the Volatility Index ($VIX) was also rising. That tends to lead to market weakness and it did so once again last week. While traders can take necessary precautions to minimize risk, we don't take any of those short-term precautions with our portfolios. We realize that may add risk from time to time, but keep in mind what our objective is with these portfolios.
Transparency. Simplicity. Consistency.
Absolutely feel free to apply various trading strategies if you'd like as they represent the very best stocks on our ChartLists, in my opinion. But for purposes of our portfolio performance, we will take a buy and hold approach. As such, we provide what we believe are the 10 best stocks for each portfolio and hold them for three months. I will continue to emphasize this as I am constantly fielding questions relating to stops and why we don't use them.
Happy trading!
Tom Bowley, Chief Market Strategist
EarningsBeats.com
"Better timing. Better trades."