
EB Weekly Portfolio Report - Sunday, September 20, 2020
Upcoming Earnings Reports
According to Zacks.com, the following companies will be reporting earnings this week and each is a component of one of our portfolios:
Monday, September 21: None
Tuesday, September 22: None
Wednesday, September 23: None
Thursday, September 24: None
Friday, September 25: None
PLEASE NOTE: The above companies were provided after scanning the Zacks Earnings Calendar. My research is limited to what Zacks provides and I also can make a mistake from time to time, so please check for earnings dates for all companies that you own. We do hold our portfolio stocks through one earnings report, but every EarningsBeats.com member must make their own investing/trading decisions about holding stocks into earnings reports as it's the most volatile (risky) time to own a stock.
Portfolio Rules and Objectives
Here are the common traits and objectives of our portfolios:
- There are 10 leading stocks from up to 10 leading industries in each portfolio (at the time of selection). Generally, there will only be one stock per industry group, but there could be exceptions.
- They are held for an entire 90 day period, with no stops in place. We strive for consistency, transparency, and simplicity in our portfolios. EB.com members may hold these stocks for the entire 90 days, trade them, use stops, etc., but for purposes of our calculation, we will make no exceptions to our "buy and hold for three months" strategy.
- Every stock will generally be held through ONE earnings report
- The expectation is that relative winners will carry the portfolio to outperformance
- They were all entered into as of the close on Wednesday, August 19th; members may choose to try to time better entries, but EB.com will "purchase" as of August 19th's closing price
- Primary objective is to outperform the benchmark S&P 500
Here are several considerations for EB members:
- I would expect the Strong AD and Aggressive portfolios to be the riskiest, followed by the Model portfolio, and then the Income portfolio
- The Strong AD portfolio will be selected from a combination of rising accumulation/distribution lines and SCTRs above 80 at the time of selection. It is the only portfolio that does NOT require a revenue and EPS beat in its most recent quarterly earnings report
- The Income portfolio stocks will all pay dividends, with the expected average dividend yield to be at least 1.5%
- Drawdowns (losses) should be much milder on the Income portfolio, with more volatility expected on the other three; please review inception-to-date charts below to gain an idea of the volatility associated with each
- I believe the larger drawdown on the Income portfolio at the beginning of the pandemic was an anomaly, occurring as many defensive, higher-yielding companies uncharacteristically underperformed during a market decline.
- You should own or trade these stocks in whatever manner is most comfortable for you; while we will buy all 10 stocks in the manner identified above, feel free to trade certain stocks or wait for pullbacks if the stocks are overbought
- We have no idea what risk each member is willing or able to take. We are not registered investment advisors so be sure you understand the risk you take. Please consult your financial advisor.
- EarningsBeats.com shareholders/employees may own all or some of the portfolio stocks from time to time.
Weekly Snapshot
Here's a weekly recap:
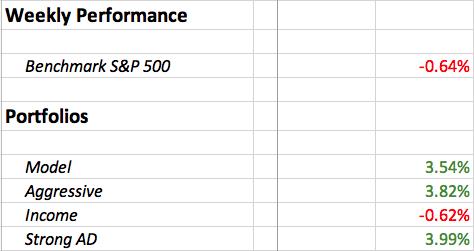
It was a very solid week for our portfolios, especially considering that growth stocks were mostly out of favor. Here's a weekly chart of the IWF:IWD to illustrate this point:
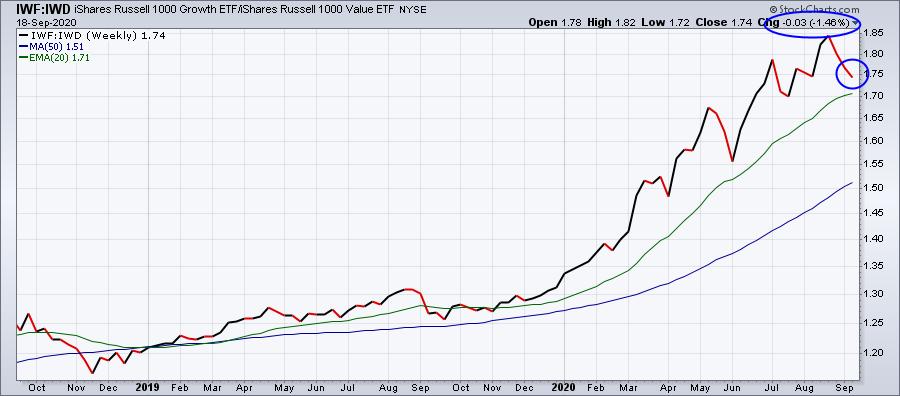
I believe growth stocks will continue to lead us in 2020/2021 as interest rates remain at historic lows.
Weekly Summary
Benchmark S&P 500:
The benchmark S&P 500 remained in its September consolidation. We've seen rotation into many areas previously beaten up and that's great news for the long-term health of this bull market. Unfortunately, this short-term rotation out of recent leaders is adding to a growing belief the market rally is over. That couldn't be further from the truth, in my humble opinion. So long as the growth story remains alive, valuations will move higher. I believe the growth story is just beginning.
Keep something in mind. The S&P 500 finished last week below where it was at its February high. The NASDAQ, which has obviously outperformed, is up maybe 12-13% from its February high. During the secular bull market of the 1980s and 1990s, the average annual gain was more than 15%. We had plenty of 20%-30% annual gains and higher. We were so programmed during the last secular bear market from 2000-2013 to believe that any growth in the stock market wasn't warranted that many cannot accept the fact that we're in the midst of an incredible bull market, one that will last another decade or more. When the masses figure that out and show no fear, it'll be time to grow much more conservative in our investing approach. For now, let's use inevitable weakness from time to time to invest and grow our investment worth.
Model Portfolio:
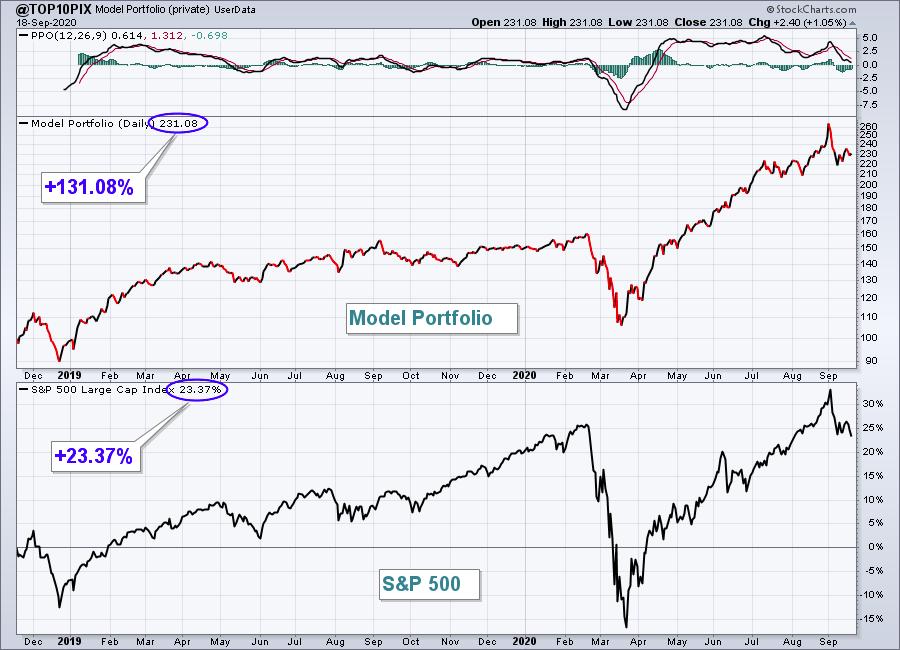
The Model portfolio jumped 3.54% last week, again distancing itself from the benchmark S&P 500. Here's the updated inception-to-date chart of the portfolio:
Here are how the Model portfolio component stocks performed last week:
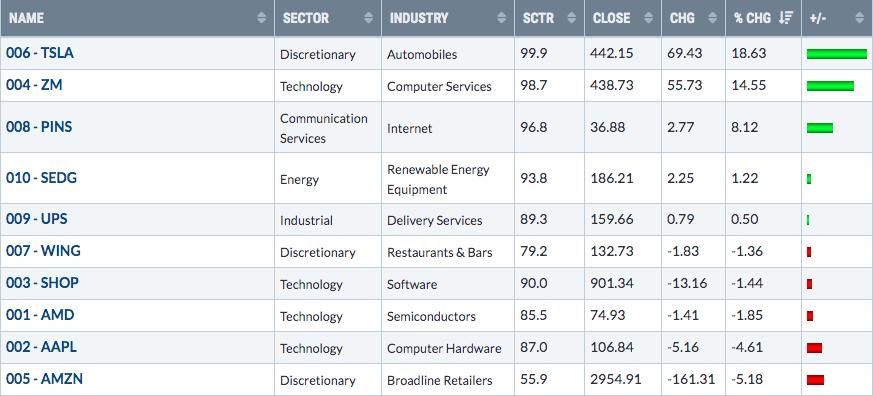
TSLA and ZM had huge weeks last week, going against the market grain. That enabled our flagship Model Portfolio to extend its huge advantage over the S&P 500 since the portfolio's inception nearly two years ago.
Aggressive Portfolio:
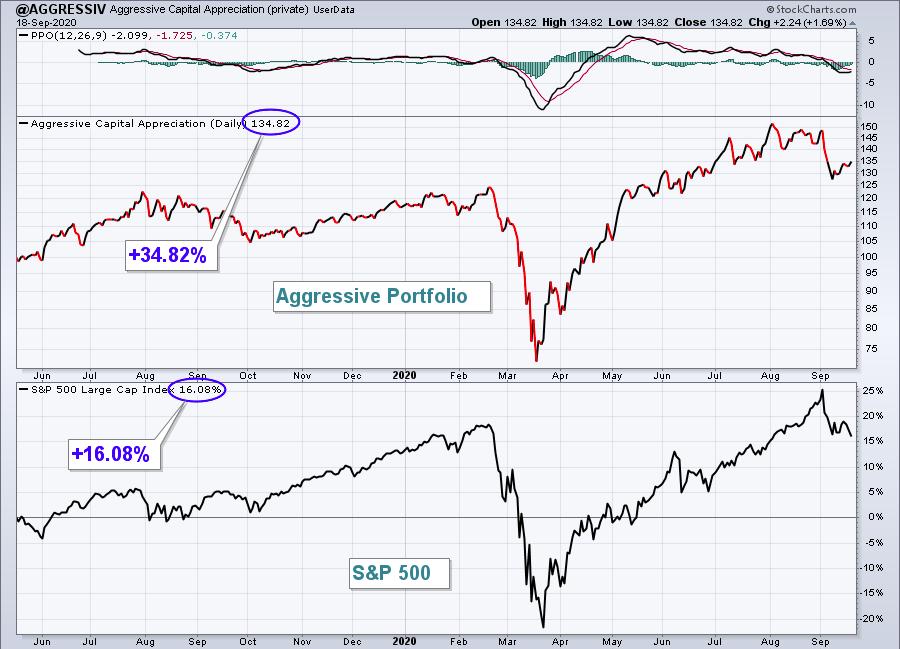
The Aggressive portfolio finally performed well, advancing 3.82% and making up some lost ground this quarter.
Here's the Aggressive portfolio chart since its inception on May 19, 2019:
Here are how the Aggressive portfolio component stocks performed last week:
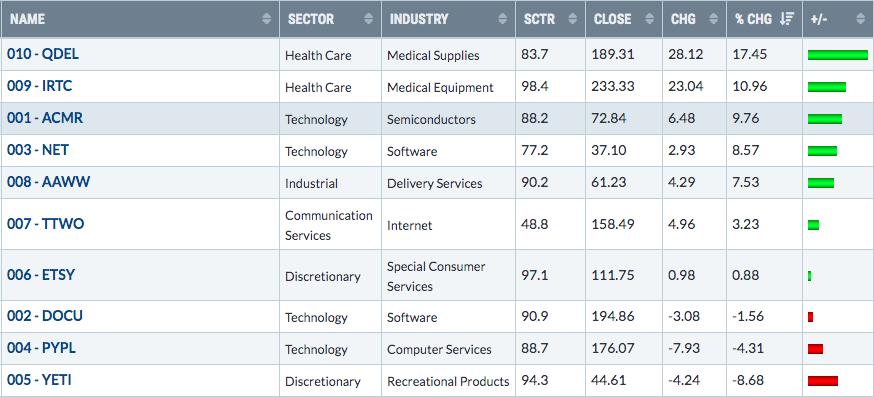
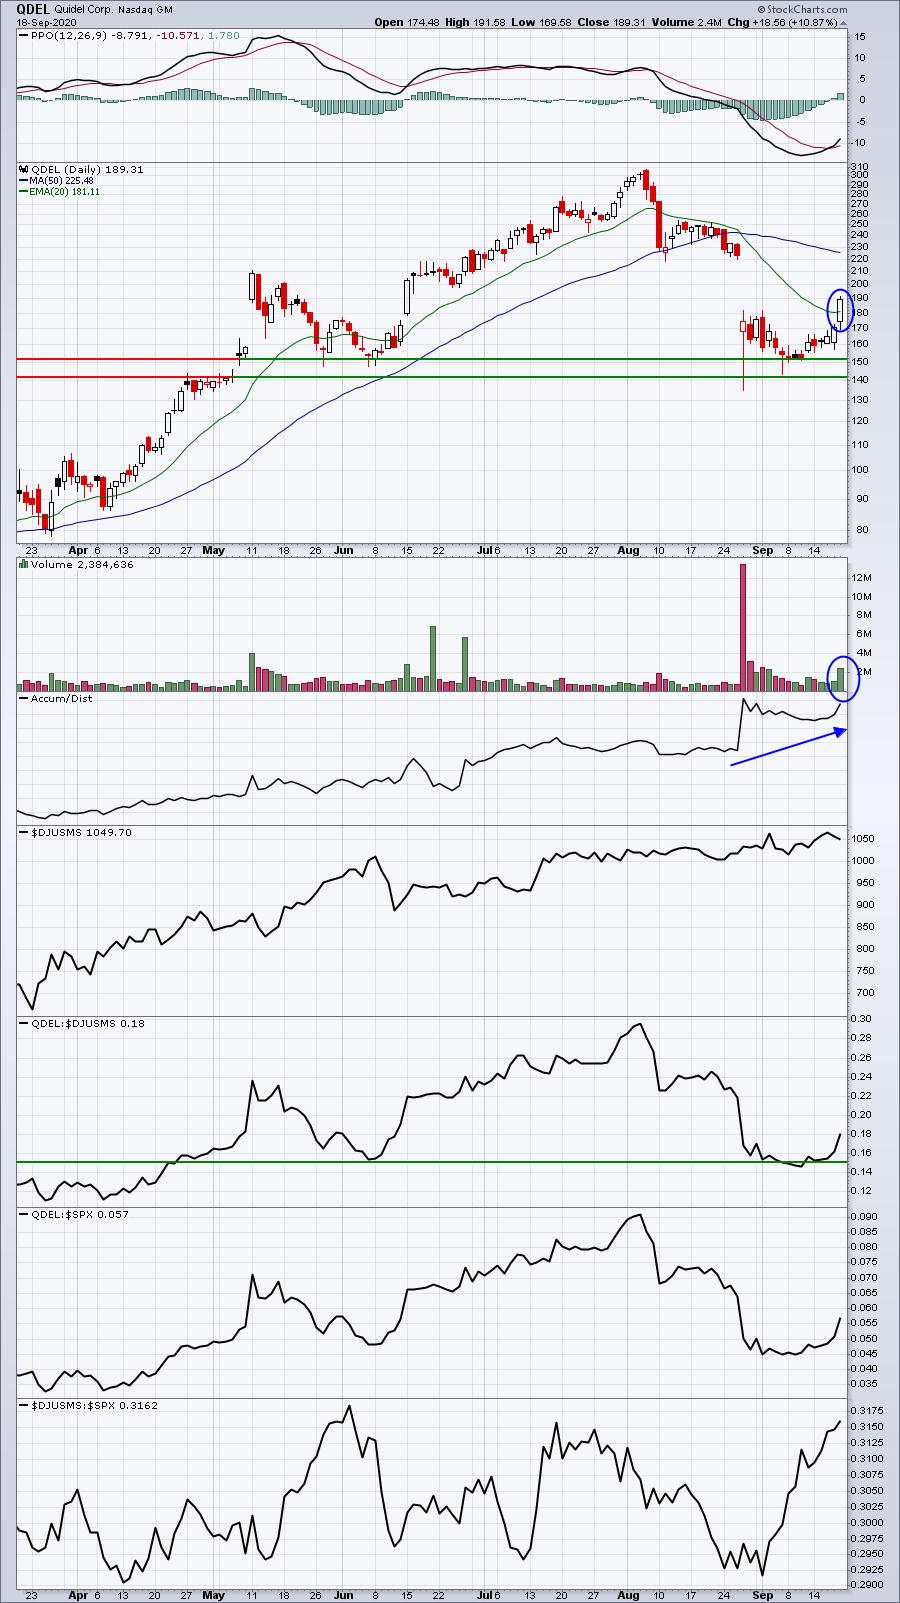
7 of our 10 Aggressive Portfolio stocks gained ground last week, despite the weak S&P 500. Volume returned as QDEL was able to clear its declining 20 day EMA:
Income Portfolio:
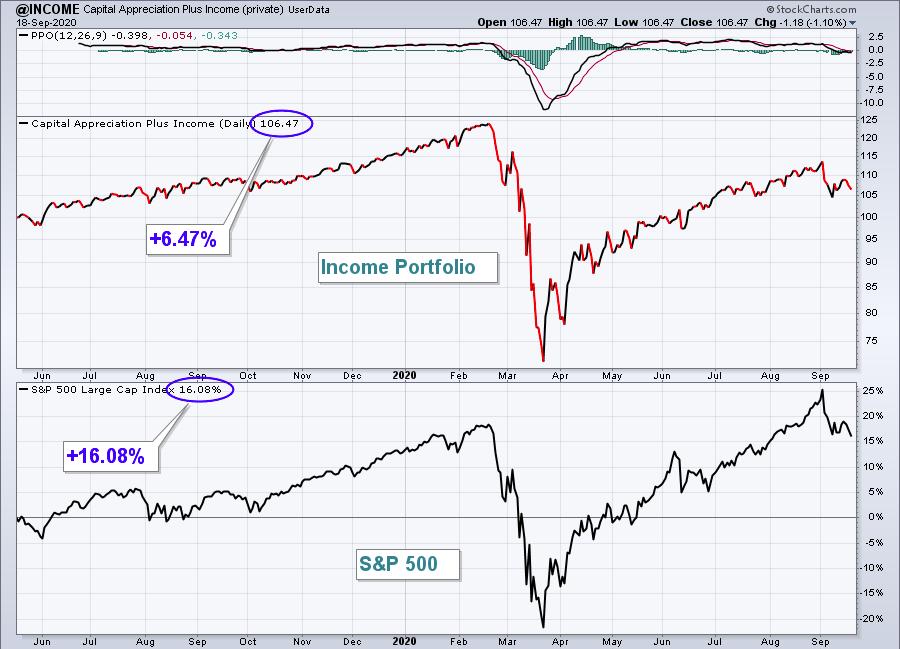
The Income portfolio dropped 0.62% to essentially ride along with the S&P 500's decline. Here's a look at the inception-to-date chart:
Here are how the Income portfolio component stocks performed last week:
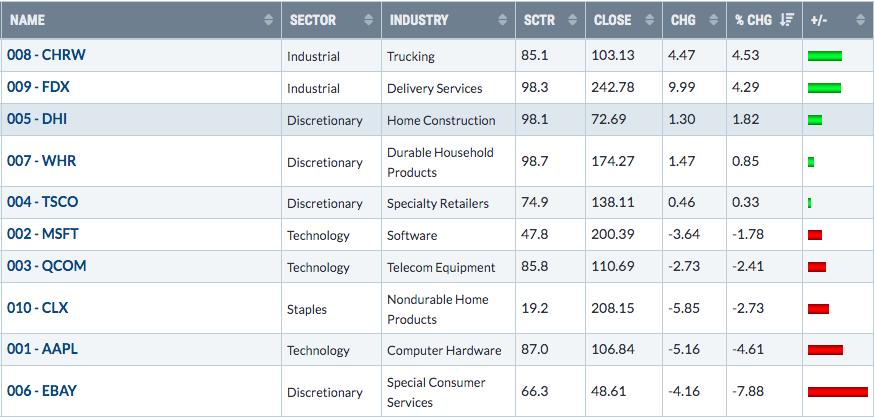
EBAY and AAPL kept the Income Portfolio from joining the other 3 in positive territory last week. While AAPL's drop is less concerning as I fully expect we'll see buyers return there, EBAY is the clear problem child technically:
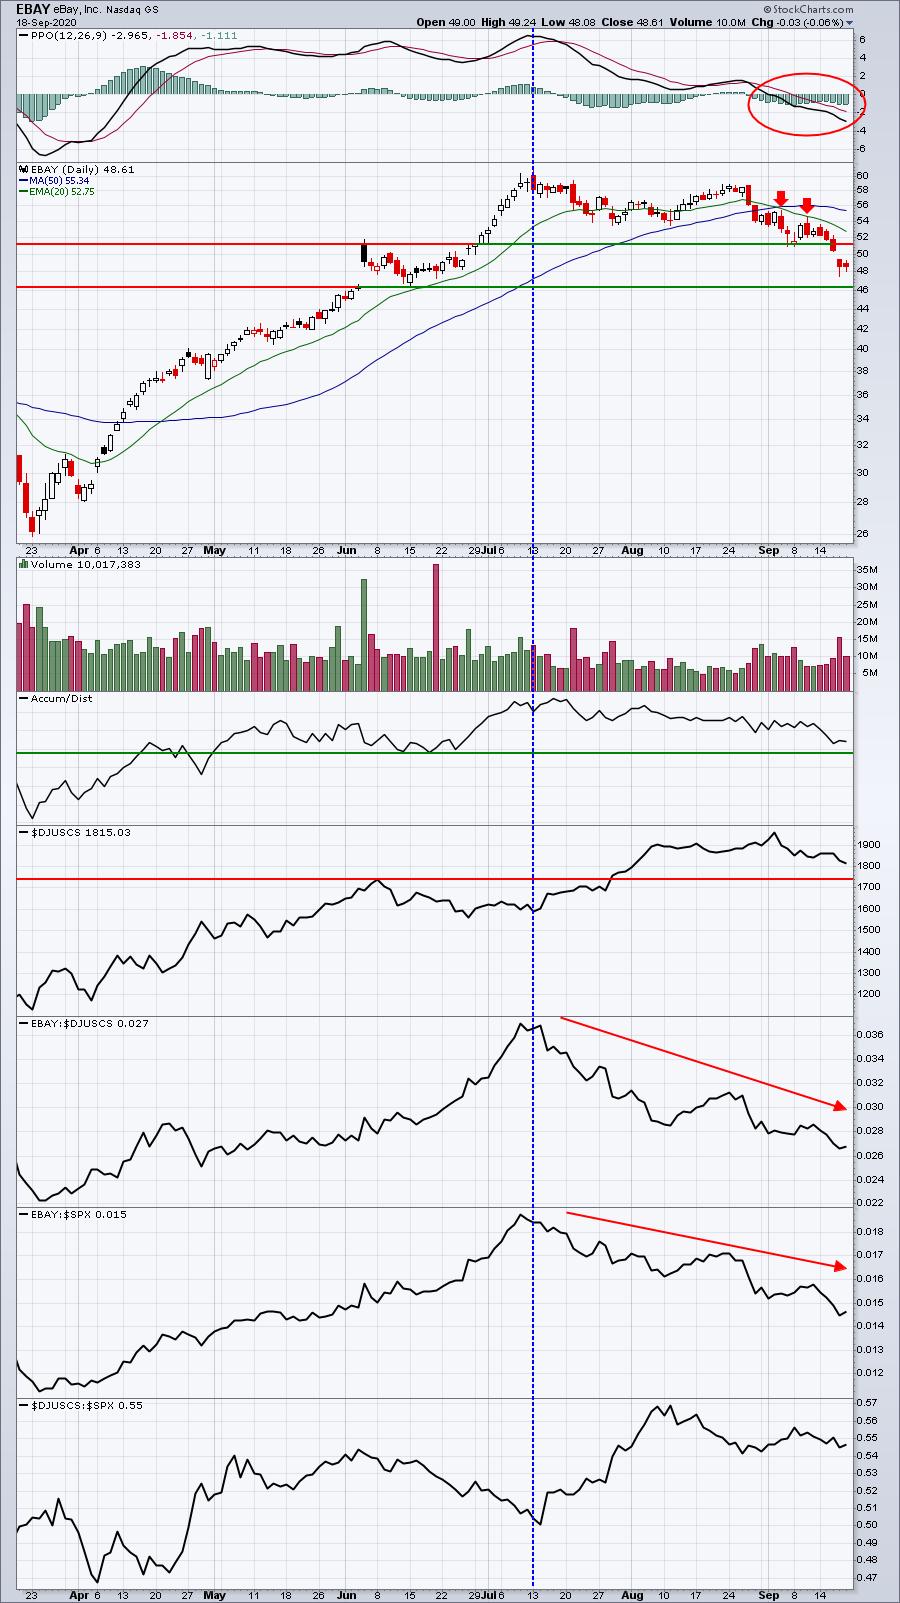
There are still plenty of reasons why we could see a turnaround here, the most likely would be key gap support holding closer to 46. I'd say my biggest technical worry here is how badly EBAY has been performing vs. its special consumer services peers ($DJUSCS). A turn higher in the group could help to lift EBAY's "boat", but I really want to see relative strength return.
Strong AD Portfolio:
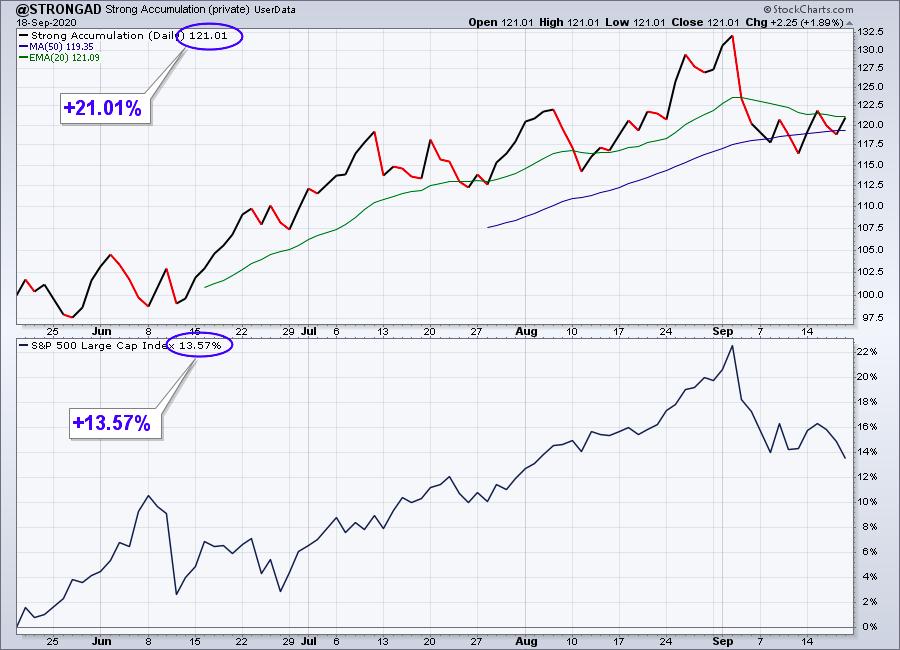
The Strong AD Portfolio surged 3.99% last week to lead all of our portfolios and easily outpace the S&P 500. Here's a look at the inception-to-date chart:
Here are how the Strong AD portfolio component stocks performed last week:
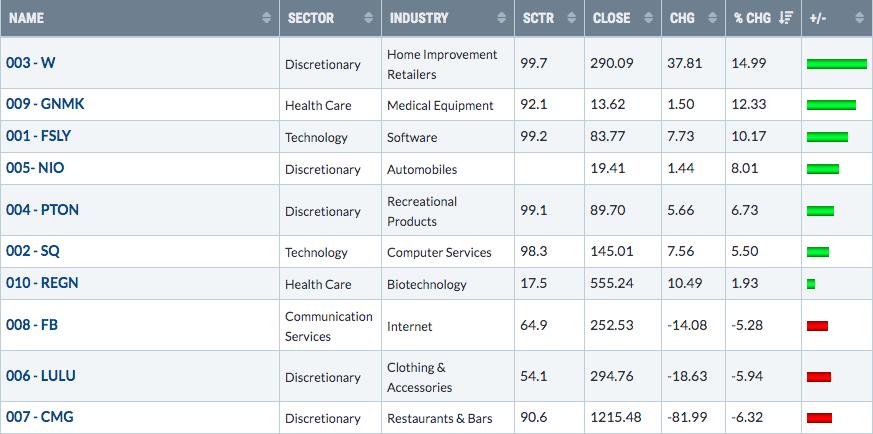
There was lots of volatility last week in the Strong AD Portfolio, but fortunately we saw more advancers than losers. Double-digit gains in W, GNMK, and FSLY more than offset weakness in FB, LULU, and CMG shares.
Summary
September is proving to be the challenge we thought it might be. We began the month with serious sentiment issues. Those really aren't as problematic any longer, although there does still remain some complacency among options traders. The bigger problem now deals with short-term technical conditions, which have turned more bearish as our key indices all trade beneath their 20 day EMAs and most are challenging 50 day SMA support. Personally, I'm focusing a bit more on rising 20 week EMAs. If we see an intraweek move below those moving averages and a close back above, I believe the worst will be behind us.
Happy trading!
Tom Bowley, Chief Market Strategist
EarningsBeats.com
"Better timing. Better trades."