
EB Weekly Portfolio Report - Sunday, September 27, 2020
Upcoming Earnings Reports
According to Zacks.com, the following companies will be reporting earnings this week and each is a component of one of our portfolios:
Monday, September 28: None
Tuesday, September 29: None
Wednesday, September 30: None
Thursday, October 1: None
Friday, October 2: None
PLEASE NOTE: The above companies were provided after scanning the Zacks Earnings Calendar. My research is limited to what Zacks provides and I also can make a mistake from time to time, so please check for earnings dates for all companies that you own. We do hold our portfolio stocks through one earnings report, but every EarningsBeats.com member must make their own investing/trading decisions about holding stocks into earnings reports as it's the most volatile (risky) time to own a stock.
Portfolio Rules and Objectives
Here are the common traits and objectives of our portfolios:
- There are 10 leading stocks from up to 10 leading industries in each portfolio (at the time of selection). Generally, there will only be one stock per industry group, but there could be exceptions.
- They are held for an entire 90 day period, with no stops in place. We strive for consistency, transparency, and simplicity in our portfolios. EB.com members may hold these stocks for the entire 90 days, trade them, use stops, etc., but for purposes of our calculation, we will make no exceptions to our "buy and hold for three months" strategy.
- Every stock will generally be held through ONE earnings report
- The expectation is that relative winners will carry the portfolio to outperformance
- They were all entered into as of the close on Wednesday, August 19th; members may choose to try to time better entries, but EB.com will "purchase" as of August 19th's closing price
- Primary objective is to outperform the benchmark S&P 500
Here are several considerations for EB members:
- I would expect the Strong AD and Aggressive portfolios to be the riskiest, followed by the Model portfolio, and then the Income portfolio
- The Strong AD portfolio will be selected from a combination of rising accumulation/distribution lines and SCTRs above 80 at the time of selection. It is the only portfolio that does NOT require a revenue and EPS beat in its most recent quarterly earnings report
- The Income portfolio stocks will all pay dividends, with the expected average dividend yield to be at least 1.5%
- Drawdowns (losses) should be much milder on the Income portfolio, with more volatility expected on the other three; please review inception-to-date charts below to gain an idea of the volatility associated with each
- I believe the larger drawdown on the Income portfolio at the beginning of the pandemic was an anomaly, occurring as many defensive, higher-yielding companies uncharacteristically underperformed during a market decline.
- You should own or trade these stocks in whatever manner is most comfortable for you; while we will buy all 10 stocks in the manner identified above, feel free to trade certain stocks or wait for pullbacks if the stocks are overbought
- We have no idea what risk each member is willing or able to take. We are not registered investment advisors so be sure you understand the risk you take. Please consult your financial advisor.
- EarningsBeats.com shareholders/employees may own all or some of the portfolio stocks from time to time.
Weekly Snapshot
Here's a weekly recap:
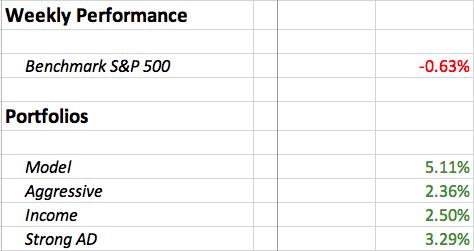
It was a very solid week for our portfolios as they each significantly outperformed the benchmark S&P 500. While sticking with leaders always makes sense in my mind, what really helped last week was the market rotation back towards growth stocks. The IWF:IWD ratio gained more than 4% last week. You can visually see the market's rotation by reviewing this chart:
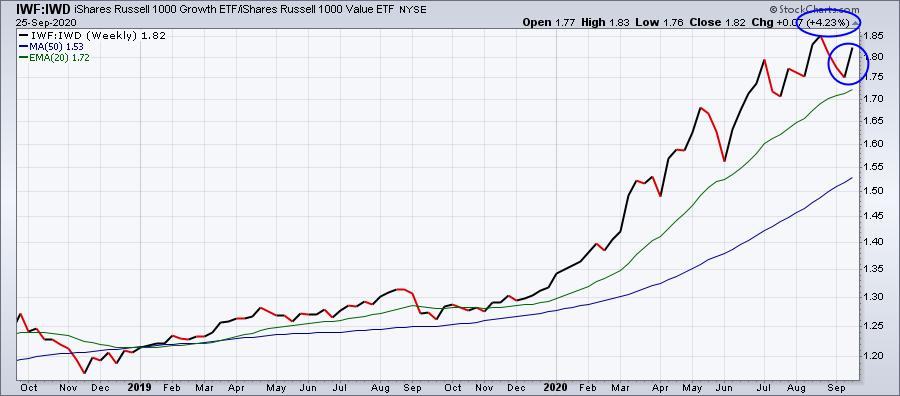
It's way too early to determine if last week's bounce is the start of another major relative surge in growth stocks, but for our portfolios, it certainly beat the alternative of a larger relative decline.
Weekly Summary
Benchmark S&P 500:
Last week, I suggested that an intraweek trip below the S&P 500's rising 20 week EMA and a close above it would be a bullish development. Well, that's exactly what we saw as U.S. equities ended the week on a very positive note, despite the S&P 500 losing ground last week on a net basis:
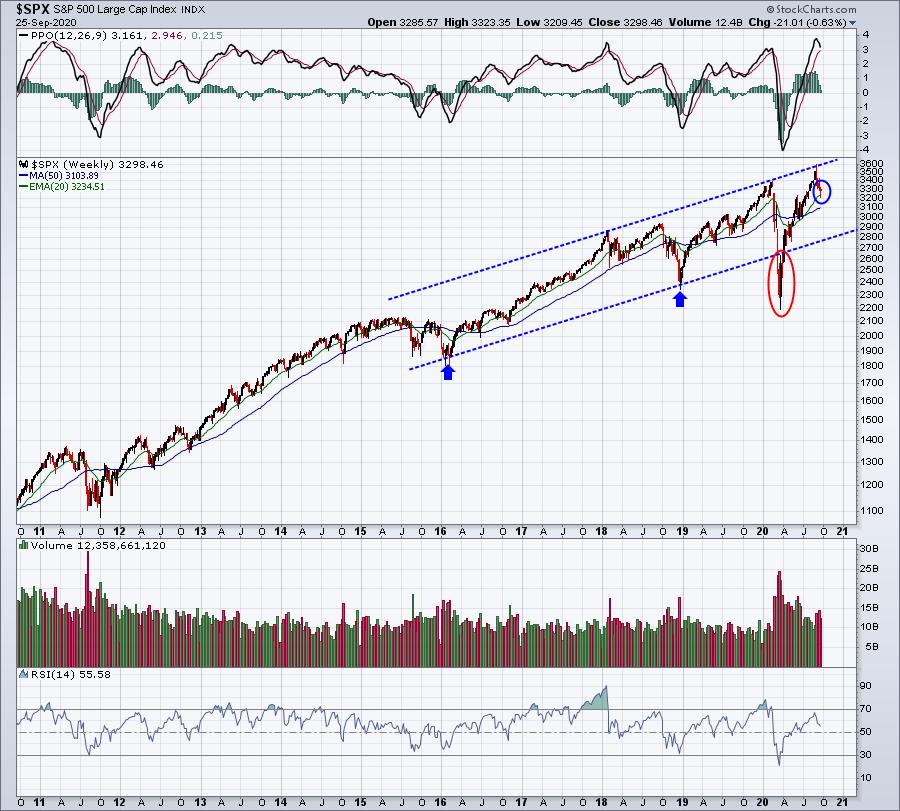
I've highlighted a longer-term channel that I believe we'll respect as we move forward. Based on this, I doubt we'll see my pre-2020 target of 4000 on the S&P 500. However, given the 100-year pandemic that we faced, which obviously was completely unexpected, I do believe we will finish higher on the year and likely finish in the 3600-3700 area. Longer-term, I really don't see anything on the horizon that will dampen the enthusiasm for U.S. stocks. Short-term, the virus remains the biggest concern as another severe outbreak this fall/winter has the potential to impact our GDP. I don't have the ability to forecast the severity of the virus, so in my view, this remains the biggest uncertainty. The election? I see little impact to the overall market. I could see a big difference in rotation and what leads the market, but I believe money flows will take the market higher regardless of which party wins the White House. That's just my opinion, of course. Feel free to disagree.
Model Portfolio:
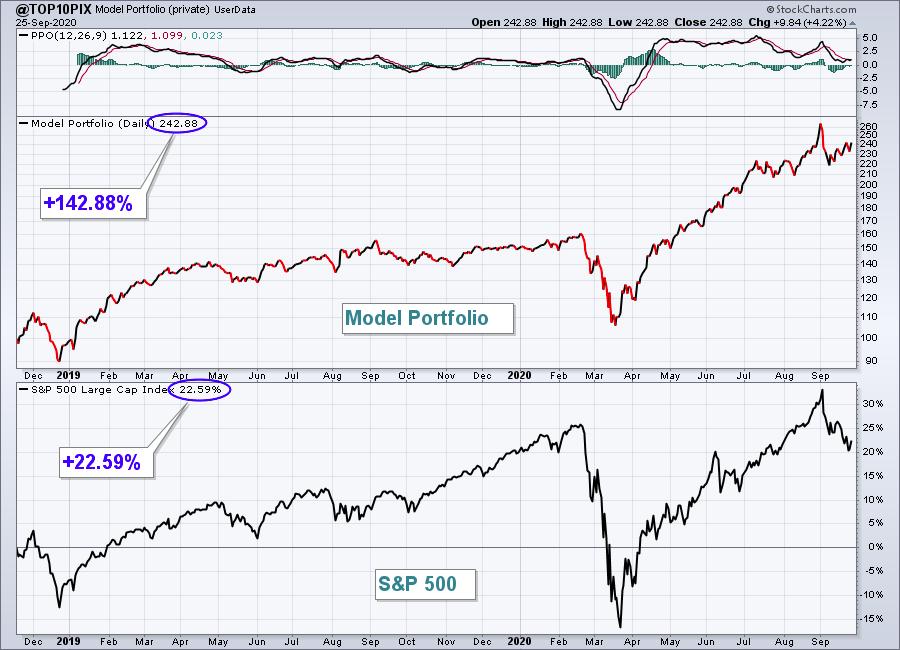
The Model portfolio jumped 5.11% last week, crushing the benchmark S&P 500. Here's the updated inception-to-date chart of the portfolio:
Here are how the Model portfolio component stocks performed last week:
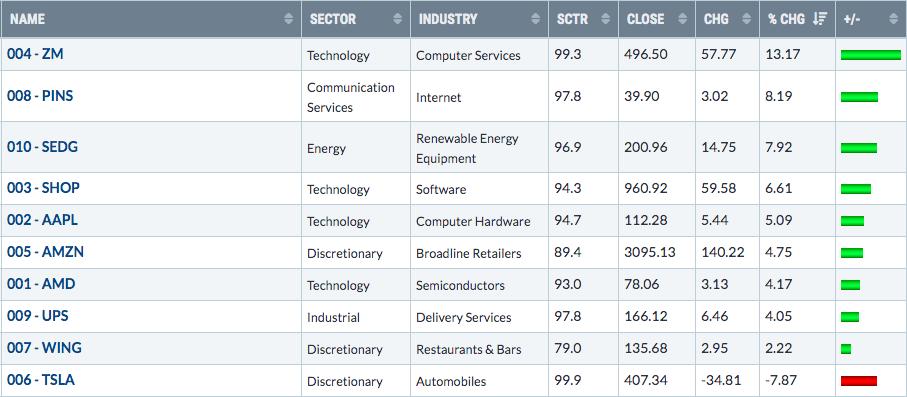
ZM had easily the best week among Model Portfolio stocks as it broke out into record territory again, but I believe PINS made the better breakout as it cleared resistance after a period of consolidation:
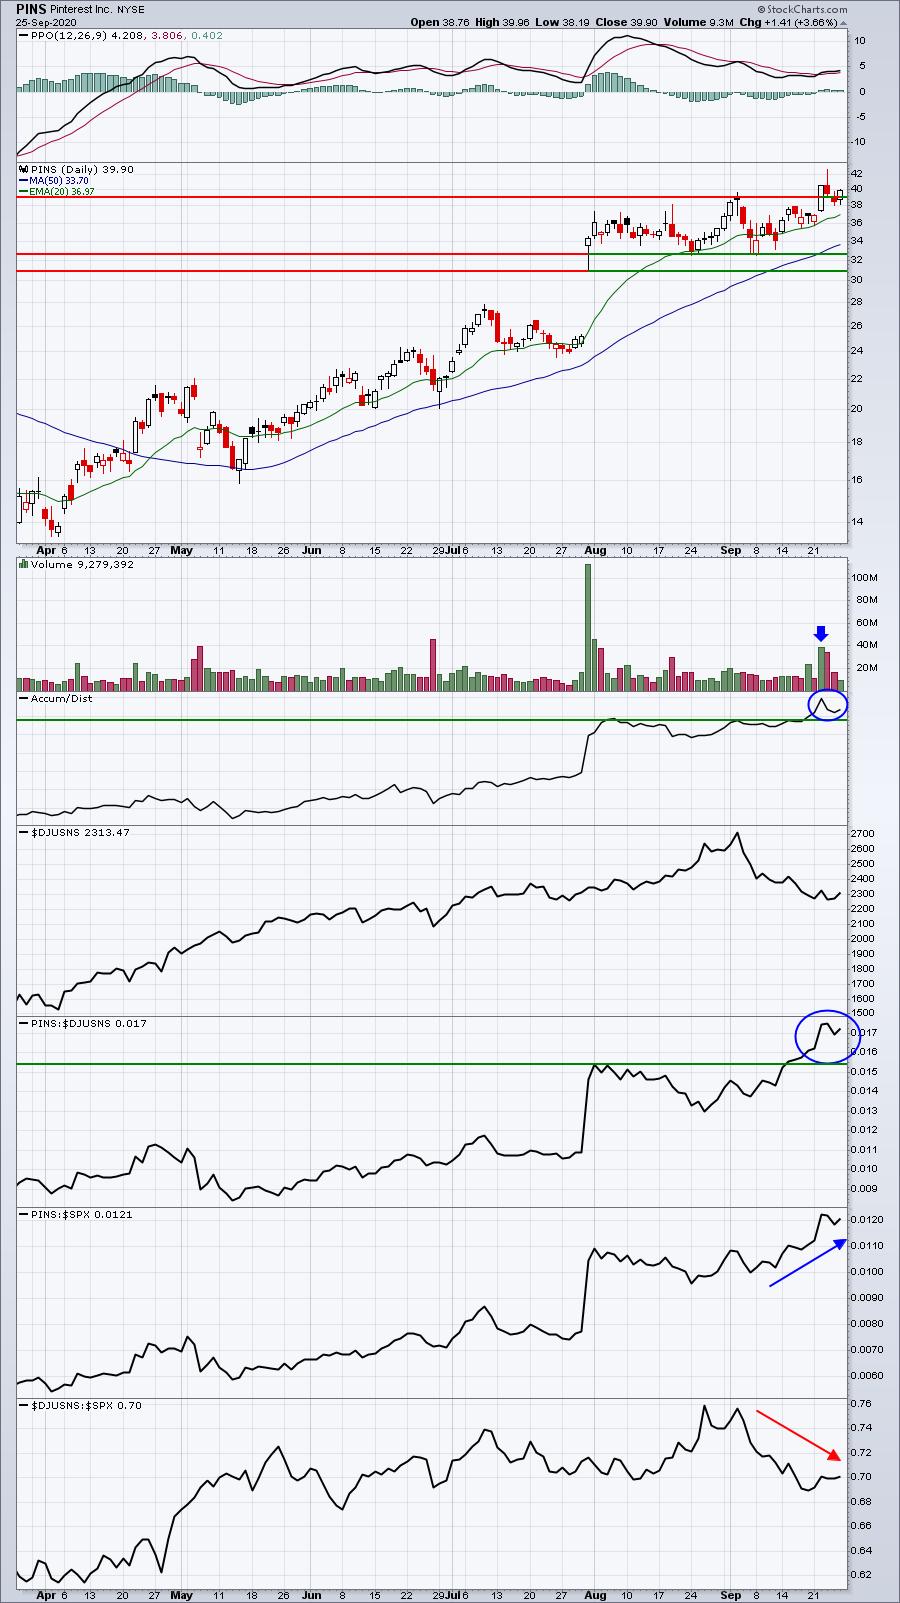
I loved seeing the 40 million shares accompany the breakout. Also, check out the weak performance in internet stocks ($DJUSNS) in September. That hasn't held back PINS as we own one of the best internet stocks.
Aggressive Portfolio:
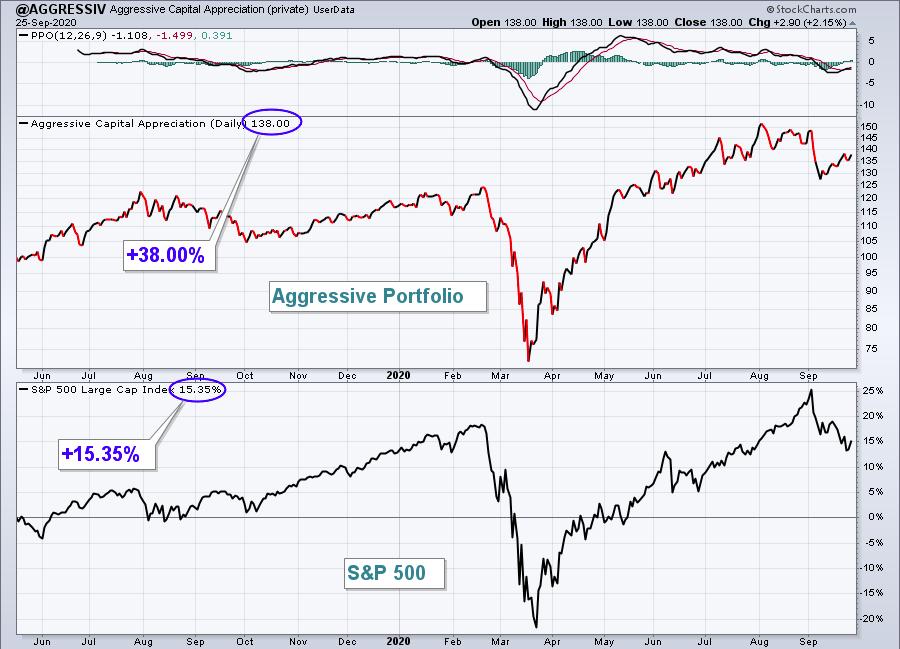
The Aggressive portfolio advanced 2.36%, outpacing the S&P 500 by 3 percentage points.
Here's the Aggressive portfolio chart since its inception on May 19, 2019:
Here are how the Aggressive portfolio component stocks performed last week:
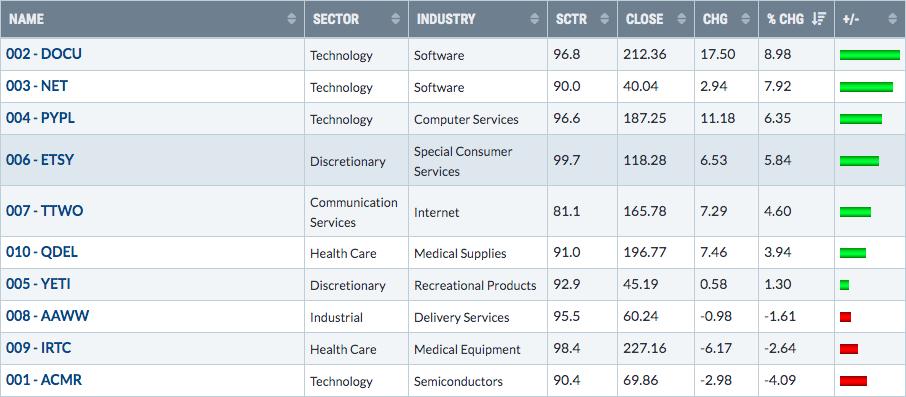
Clearly, the strength in the Aggressive Portfolio last week can be primarily attributable to its software components, DOCU and NET. Both had been dead weight, but last week's sizable gains helped to rectify that situation.
Income Portfolio:
The Income portfolio tacked on 2.50%, making up some much-needed ground vs. the S&P 500. Here's a look at the inception-to-date chart:
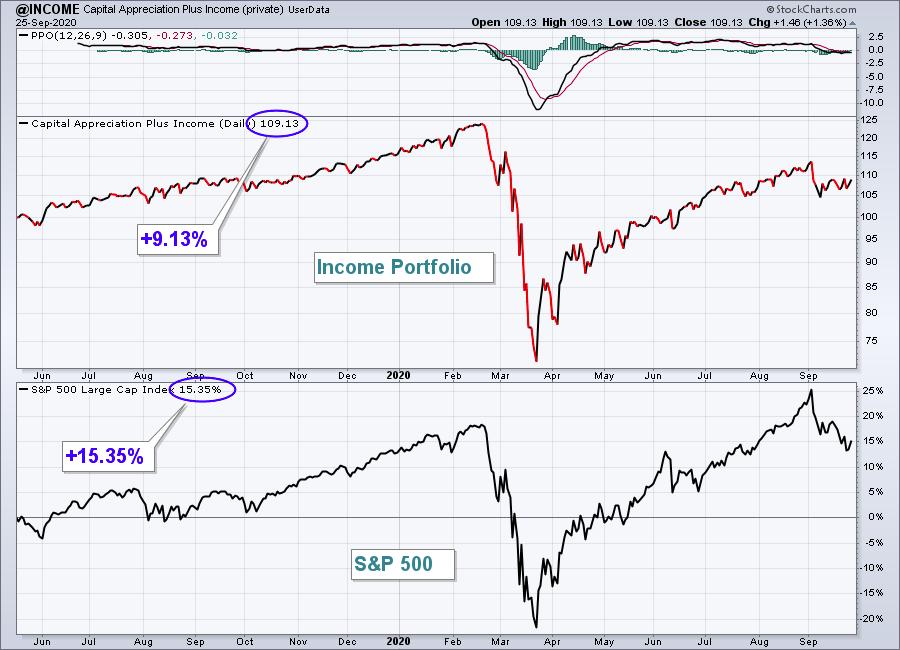
Here are how the Income portfolio component stocks performed last week:
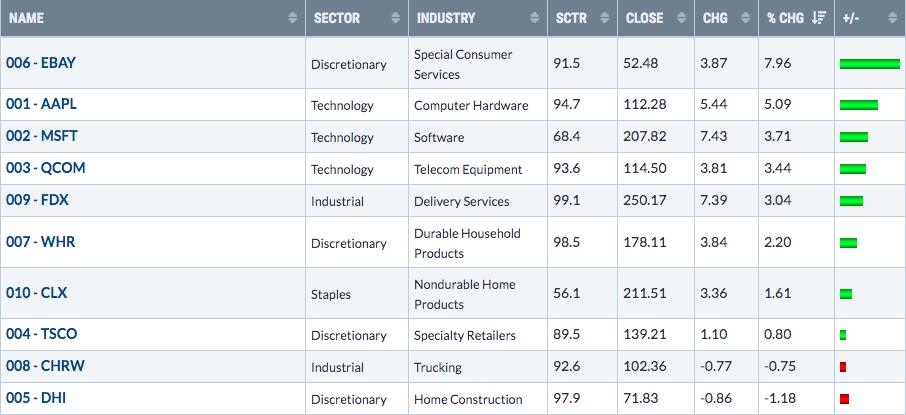
What a difference a week makes! Last week, I was left looking at the two laggards - EBAY and AAPL. This week, I get to discuss their solid recoveries. That strength was most impressive on EBAY, which had really fallen apart technically. It's certainly not out of the woods quite yet, but the repair to its chart is at least off to a great start:
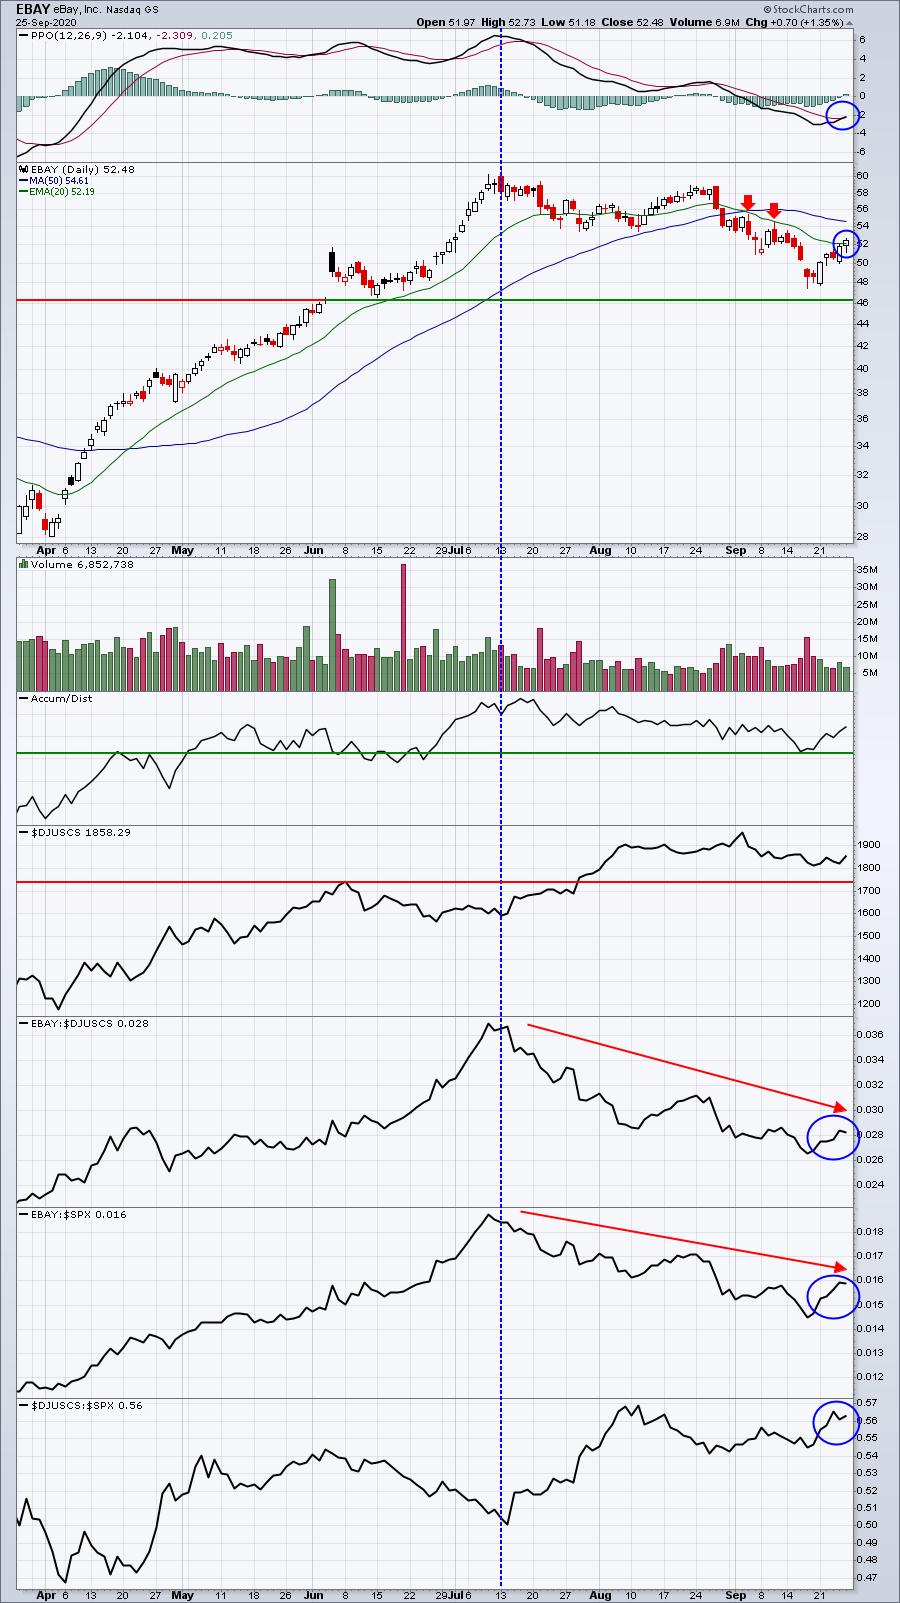
There were several bullish developments last week. The two biggest were the short-term PPO crossover back above its trigger line and the price closing the week above its declining 20 day EMA. I'm usually not a big fan of this technical development when it occurs below the centerline, but because of our strategy of holding our portfolio stocks the full 90 days, it's a very necessary development to get the stock back on track. That latter development is a big deal, however, as stocks should be considered downtrending so long as they're beneath a declining 20 day EMA. That's no longer the case for EBAY and I'll be watching to see if EBAY can maintain its price action above this key moving average.
Strong AD Portfolio:
The Strong AD Portfolio had another banner week, gaining 3.29% and creating more distance from the benchmark S&P 500 as it's now nearly doubled that index since its May 19th inception. Here's a look at the inception-to-date chart:
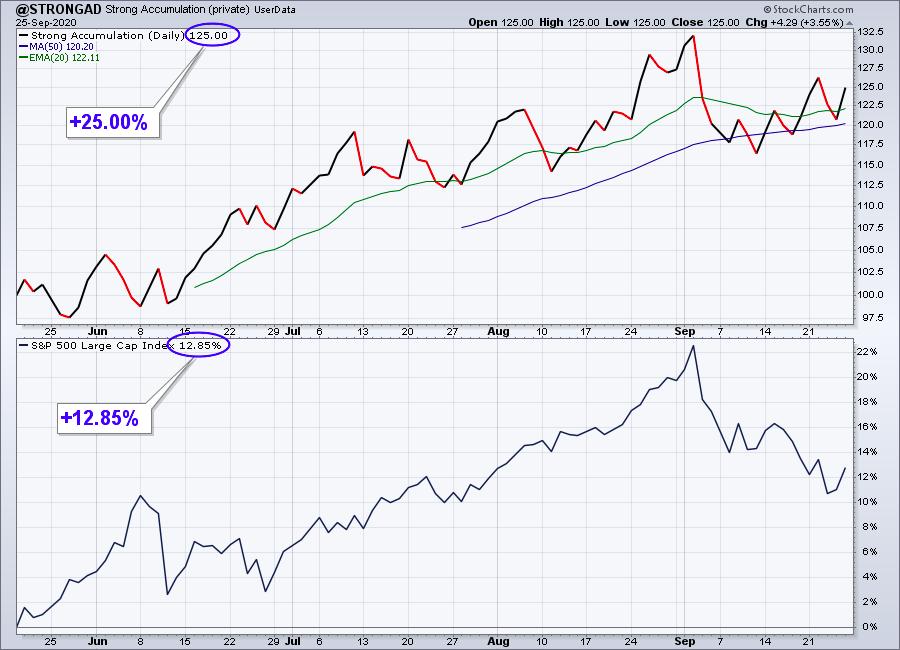
Here are how the Strong AD portfolio component stocks performed last week:
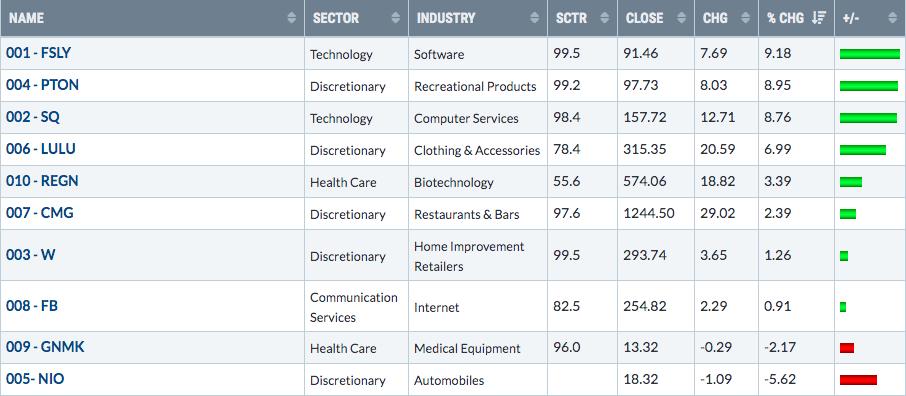
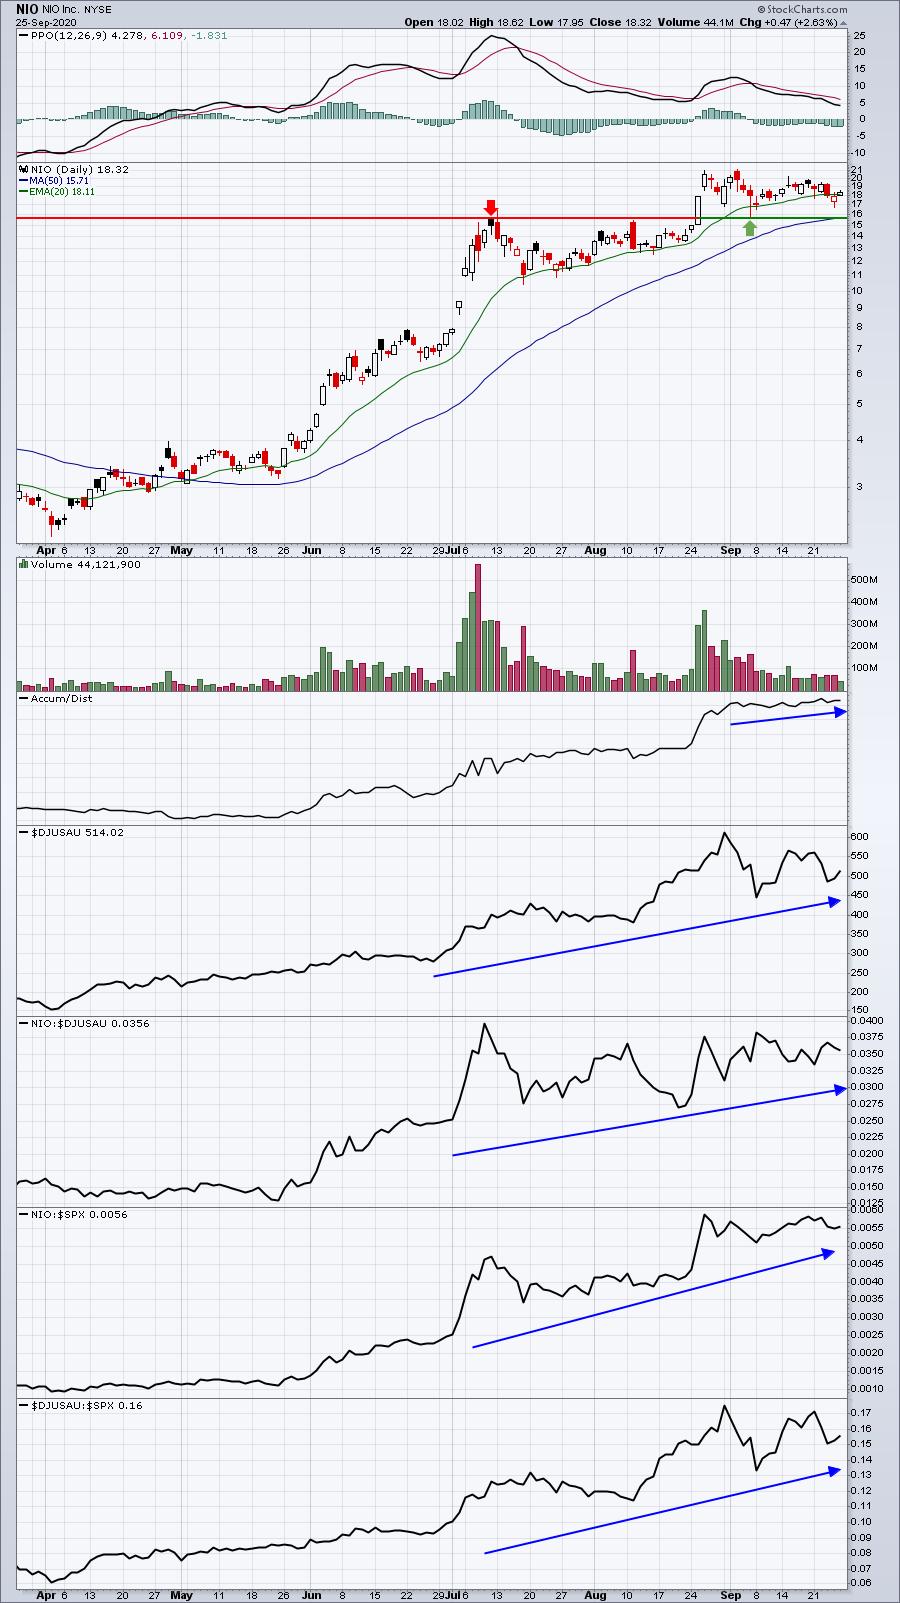
Autos ($DJUSAU) had a rough week last week, dropping just over 8%. So it's no wonder that our two weakest portfolio stocks were TSLA (Model Portfolio) and NIO. Despite the underwhelming performance, NIO really has no technical worries at this point, consolidating well above key price support at 15.61. Though it's been building a base, its relative strength remains quite strong, as does its AD line:
Summary
September is nearly in our rear view mirror. From a trader's perspective, let me just say "YAY!!!!" September always worries me, and I'd say our portfolios escaped mostly unscathed this month thus far, especially relative to S&P 500 performance. The month-to-date performance in September has been as follows:
Benchmark S&P 500: -5.77%
Model Portfolio: -2.65%
Aggressive Portfolio: -3.34%
Income Portfolio: -2.25%
Strong AD Portfolio: -1.82%
Losing money is never our objective, but market selloffs are inevitable if you're always invested, which our portfolios are. The best you can hope for is that they outperform during such periods, or that they come roaring back when the market returns to its bullish ways. We've seen the former in September and hope to see the latter in October.
Happy trading!
Tom Bowley, Chief Market Strategist
EarningsBeats.com
"Better timing. Better trades."