
EB Weekly Portfolio Report - October 4, 2020
Upcoming Earnings Reports
According to Zacks.com, the following companies will be reporting earnings this week and each is a component of one of our portfolios:
Monday, October 5: None
Tuesday, October 6: None
Wednesday, October 7: None
Thursday, October 8: None
Friday, October 9: None
PLEASE NOTE: The above companies were provided after scanning the Zacks Earnings Calendar. My research is limited to what Zacks provides and I also can make a mistake from time to time, so please check for earnings dates for all companies that you own. We do hold our portfolio stocks through one earnings report, but every EarningsBeats.com member must make their own investing/trading decisions about holding stocks into earnings reports as it's the most volatile (risky) time to own a stock.
Portfolio Rules and Objectives
Here are the common traits and objectives of our portfolios:
- There are 10 leading stocks from up to 10 leading industries in each portfolio (at the time of selection). Generally, there will only be one stock per industry group, but there could be exceptions.
- They are held for an entire 90 day period, with no stops in place. We strive for consistency, transparency, and simplicity in our portfolios. EB.com members may hold these stocks for the entire 90 days, trade them, use stops, etc., but for purposes of our calculation, we will make no exceptions to our "buy and hold for three months" strategy.
- Every stock will generally be held through ONE earnings report
- The expectation is that relative winners will carry the portfolio to outperformance
- They were all entered into as of the close on Wednesday, August 19th; members may choose to try to time better entries, but EB.com will "purchase" as of August 19th's closing price
- Primary objective is to outperform the benchmark S&P 500
Here are several considerations for EB members:
- I would expect the Strong AD and Aggressive portfolios to be the riskiest, followed by the Model portfolio, and then the Income portfolio
- The Strong AD portfolio will be selected from a combination of rising accumulation/distribution lines and SCTRs above 80 at the time of selection. It is the only portfolio that does NOT require a revenue and EPS beat in its most recent quarterly earnings report
- The Income portfolio stocks will all pay dividends, with the expected average dividend yield to be at least 1.5%
- Drawdowns (losses) should be much milder on the Income portfolio, with more volatility expected on the other three; please review inception-to-date charts below to gain an idea of the volatility associated with each
- I believe the larger drawdown on the Income portfolio at the beginning of the pandemic was an anomaly, occurring as many defensive, higher-yielding companies uncharacteristically underperformed during a market decline.
- You should own or trade these stocks in whatever manner is most comfortable for you; while we will buy all 10 stocks in the manner identified above, feel free to trade certain stocks or wait for pullbacks if the stocks are overbought
- We have no idea what risk each member is willing or able to take. We are not registered investment advisors so be sure you understand the risk you take. Please consult your financial advisor.
- EarningsBeats.com shareholders/employees may own all or some of the portfolio stocks from time to time.
Weekly Snapshot
Here's a weekly recap:
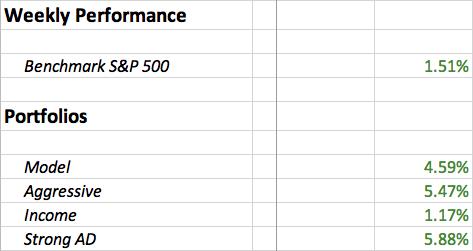
We saw mostly very solid outperformance in our portfolios last week as our Model, Aggressive, and Strong AD portfolios stretched their lead over the benchmark S&P 500 by another 3-4 percentage points. The Income Portfolio came up just short of the benchmark, but still had a relatively decent week.
Weekly Summary
Benchmark S&P 500:
Now that we've seen the S&P 500 bounce off its late-September low close to 3200 and recover to print a nice weekly gain of 1.51%, I expect that we're looking at a fairly narrow short-term trading range of 3320-3325 to the downside and 3400 to the upside based on the following hourly chart:
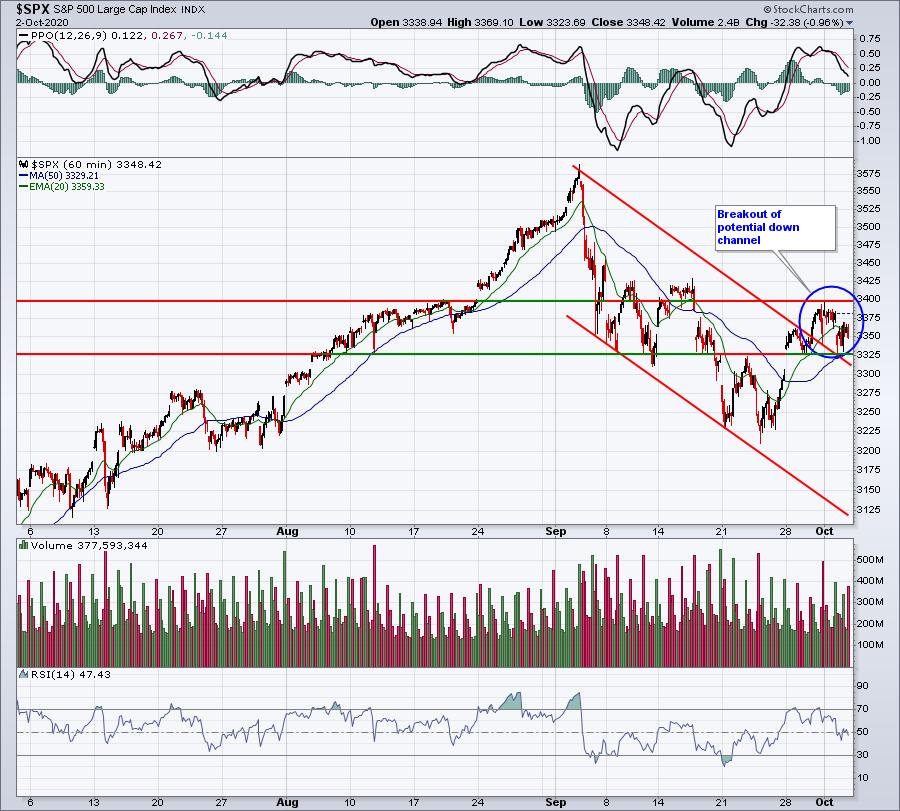
Keep in mind this is an hourly chart and a breakdown or a breakout of an intraday chart shouldn't be viewed with excessive confidence. To me, it would simply be a short-term signal that we could see near-term follow through in the direction that we break.
Model Portfolio:
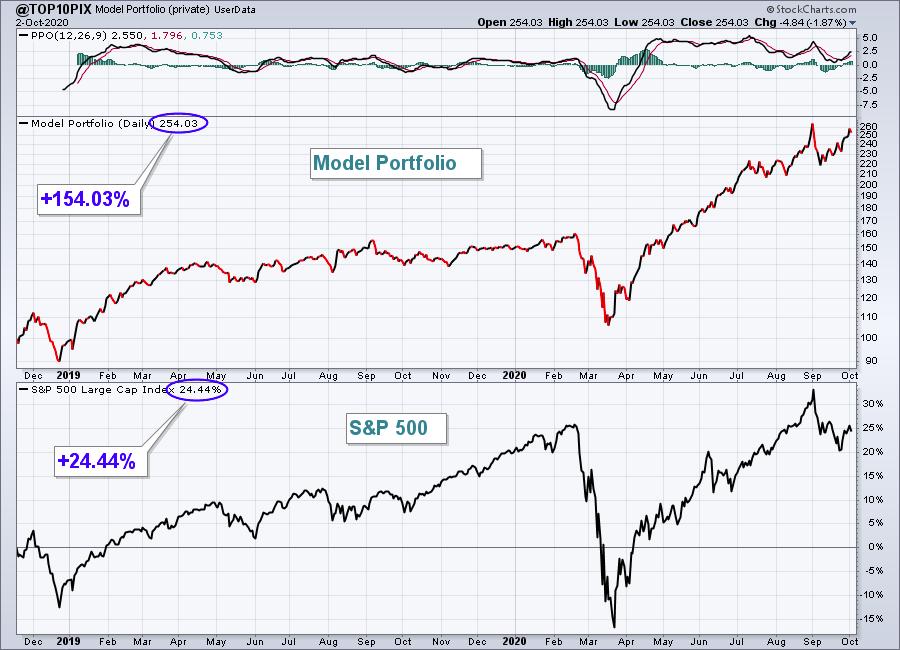
The Model portfolio jumped another 4.59%, and is within reach of its all-time high established at the beginning of September. Here's the updated inception-to-date chart of the portfolio:
Here are how the Model portfolio component stocks performed last week:
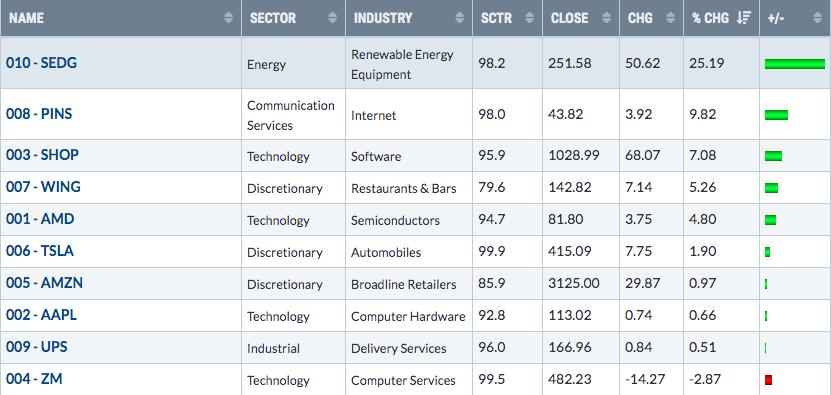
Last week, I pointed out that PINS' breakout was more impressive than ZM's, because of the base that had been built. PINS' performance this week confirmed it as the stock surged almost 10%, extending its dominance of the internet space ($DJUSNS). Renewable energy ($DWCREE) gained nearly 8%, however, and one of its leaders is SolarEdge Technologies (SEDG), which exploded off of last week's near 20 week EMA test:
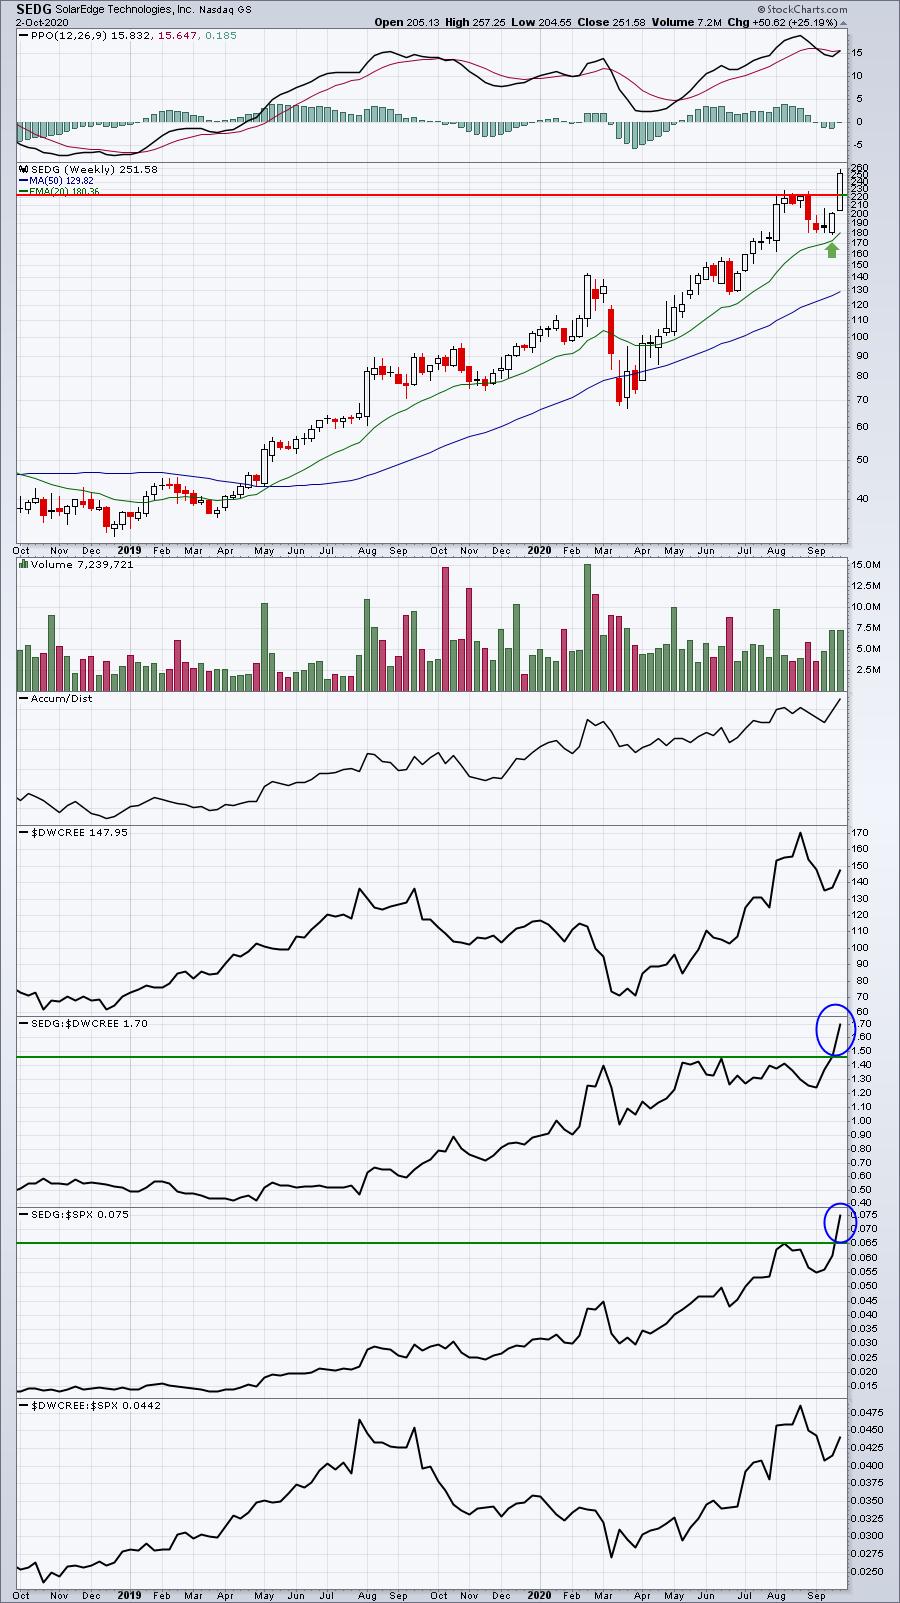
In addition to breaking out on a relative basis, SEDG also broke out on an absolute basis - great action in a market that is sideways consolidating.
Aggressive Portfolio:
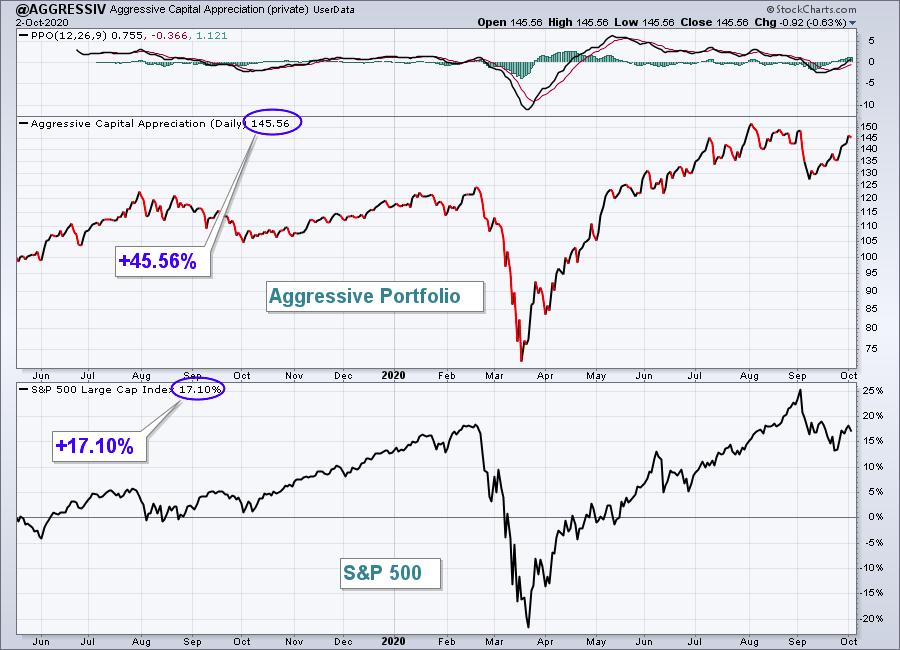
The Aggressive portfolio surged higher by 5.47%, making up a lot of ground on the S&P 500.
Here's the Aggressive portfolio chart since its inception on May 19, 2019:
Here are how the Aggressive portfolio component stocks performed last week:
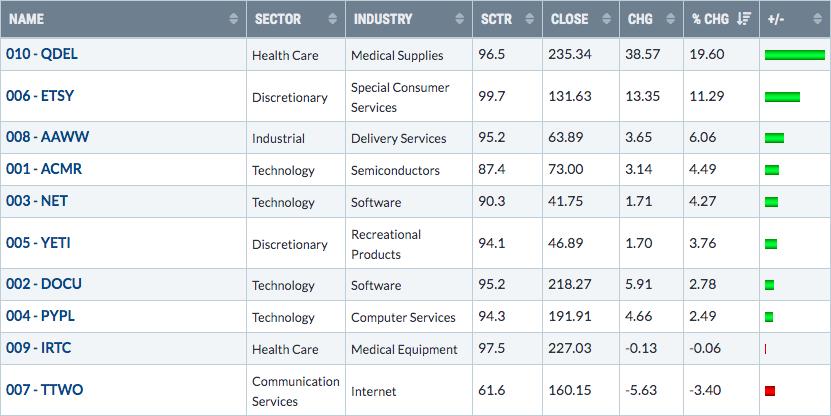
QDEL and ETSY both gained significantly last week to carry the Aggressive Portfolio higher and to narrow its underperformance vs. the S&P 500 this quarter. At one point earlier this quarter, the Aggressive Portfolio trailed the S&P 500 by more than 10 percentage points. That underperformance is now down to less than 1% and QDEL is a big reason why as it's recovered since that huge gap down in late-August:
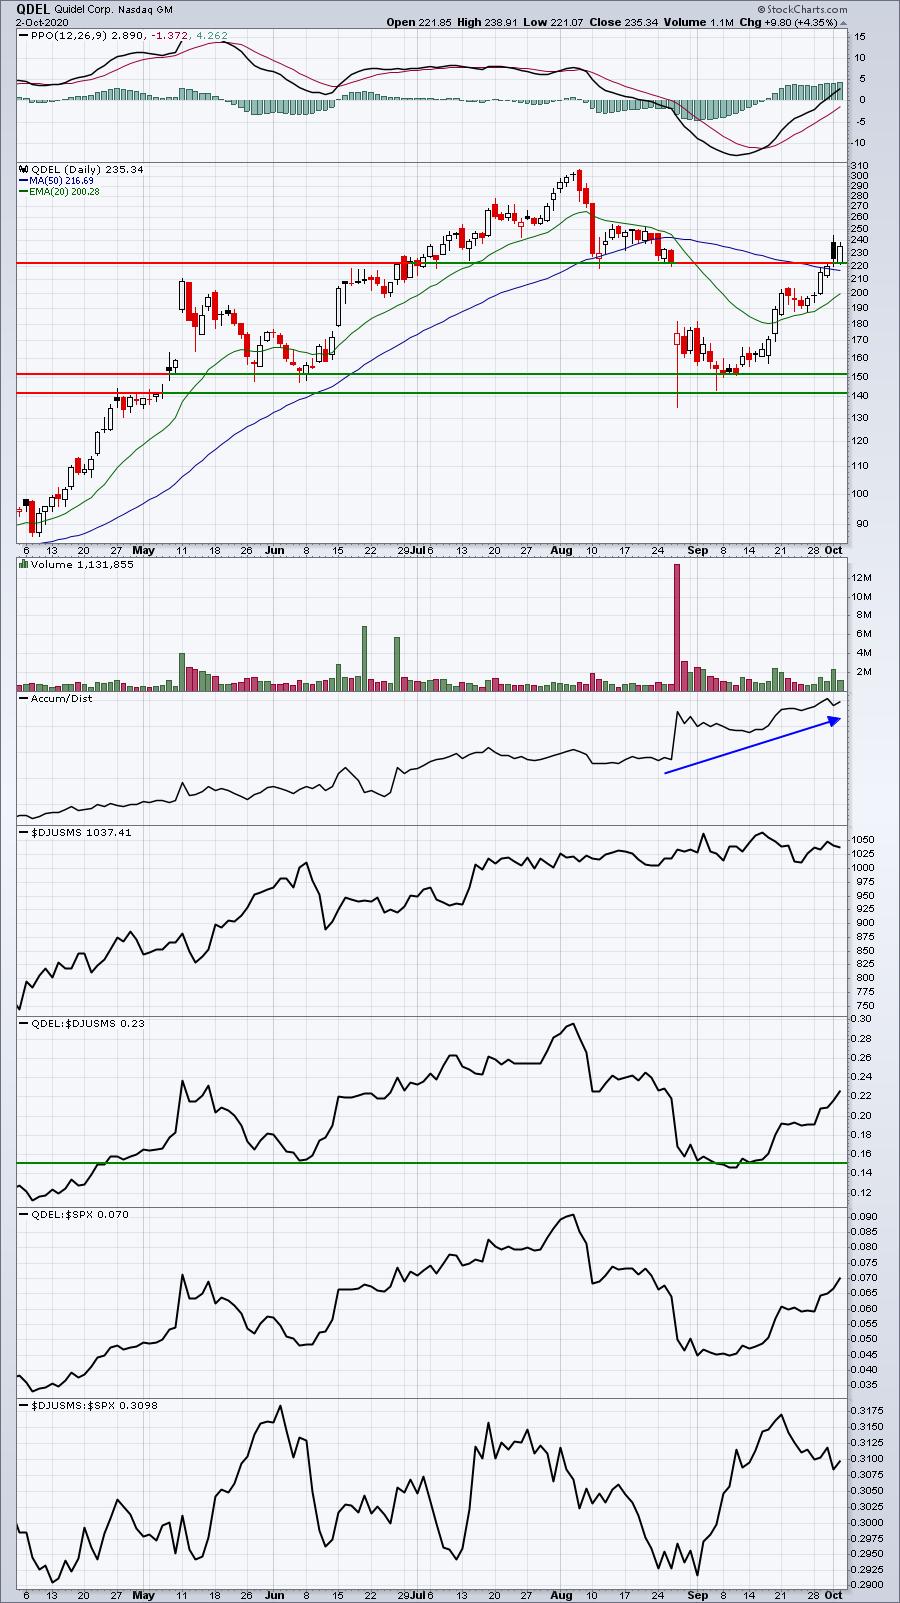
Relative strength is now uptrending, the daily PPO has turned positive, and the AD line is setting new highs - all of which are quite bullish, in my view.
Income Portfolio:
The Income portfolio rose 1.17%, still trailing the S&P 500, but performing well nonetheless. Here's a look at the inception-to-date chart:
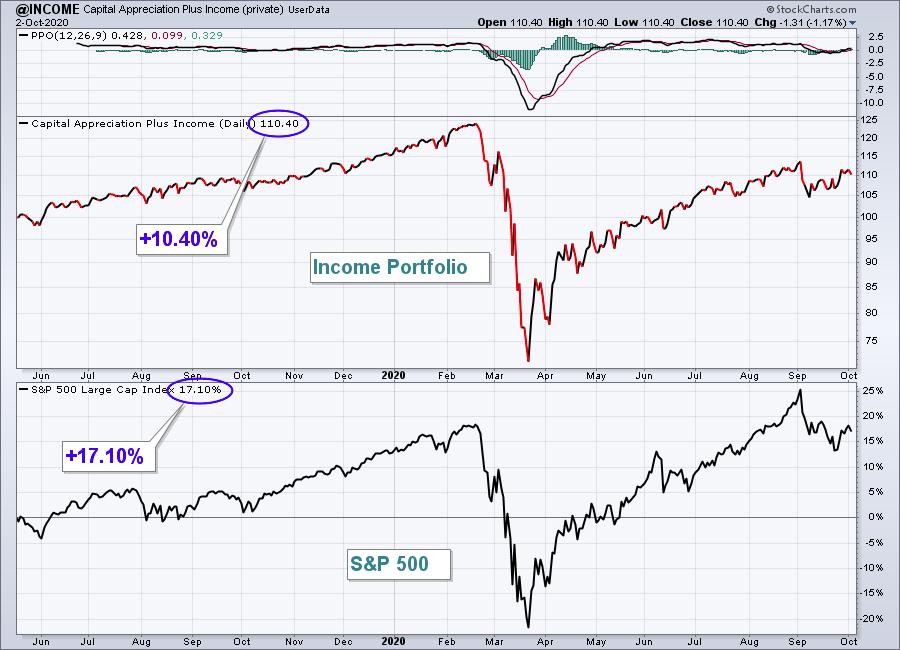
Here are how the Income portfolio component stocks performed last week:
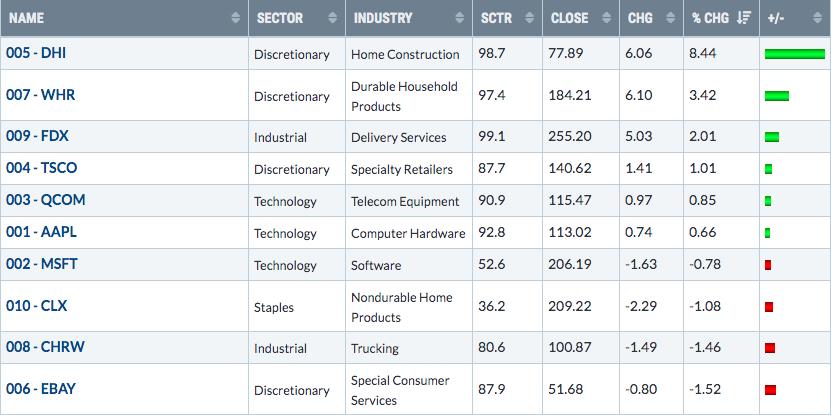 It wasn't easy for this portfolio to keep pace with the S&P 500 last week as there was mostly a split between winners and losers. But DHI did its best to put the entire portfolio on its shoulders last week as it broke out to a new all-time closing high on Friday:
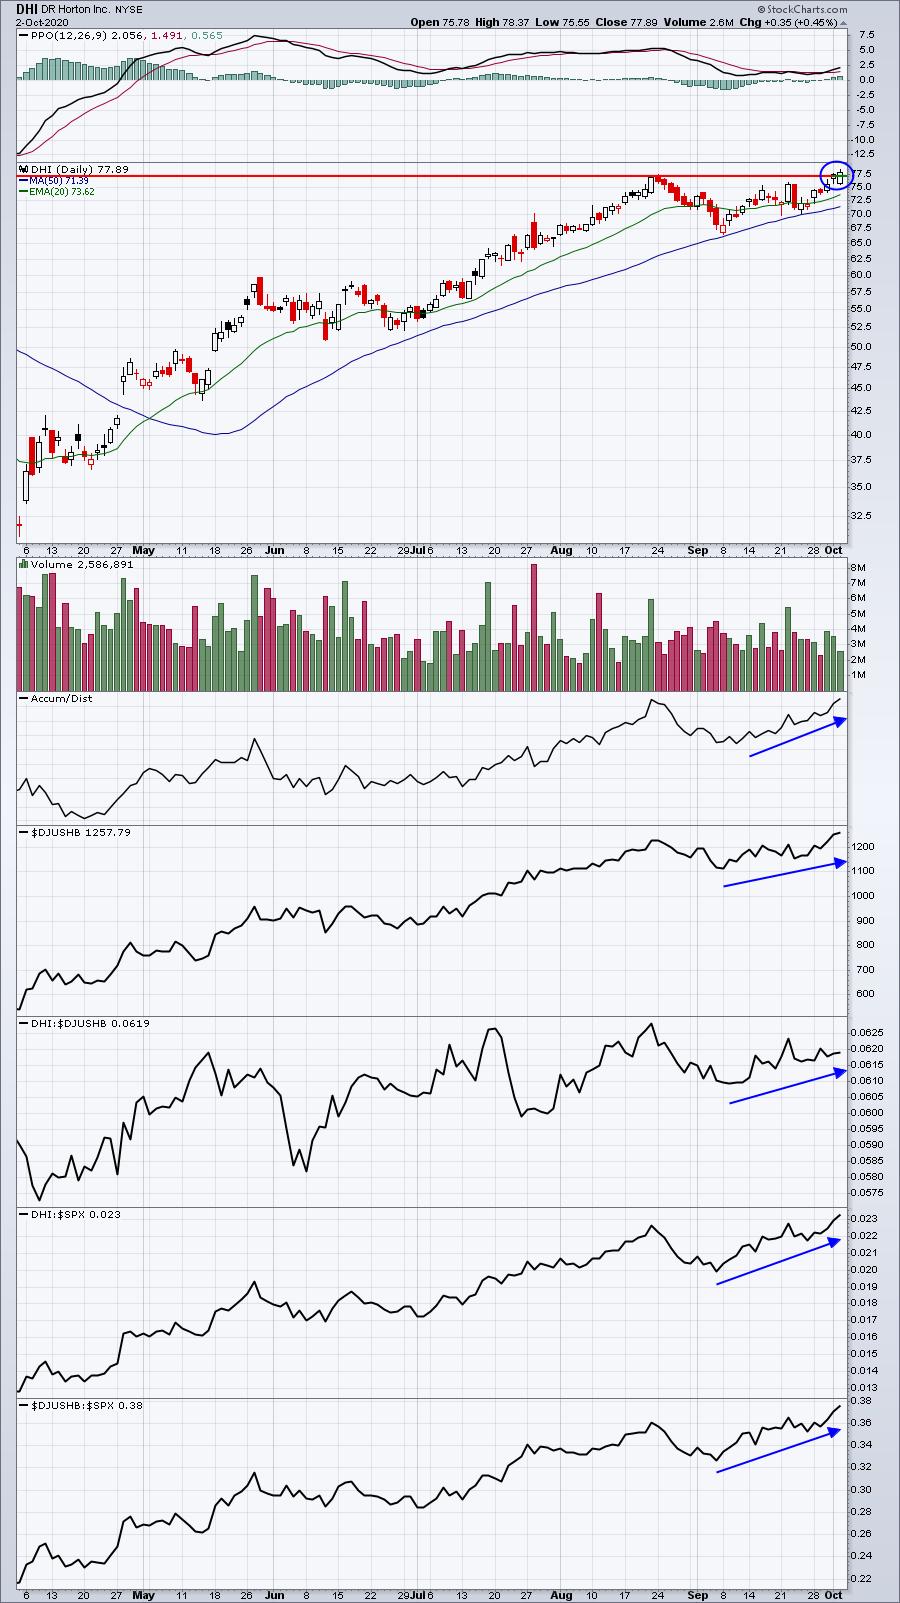
Everything looks good on this chart. I see a strong industry group and DHI's relative strength turning higher again. Its AD line has broken out to confirm the price action. I see DHI going higher.
Strong AD Portfolio:
The Strong AD Portfolio surged 5.88% and is now up more than double the S&P 500's return since May. Here's a look at the inception-to-date chart:
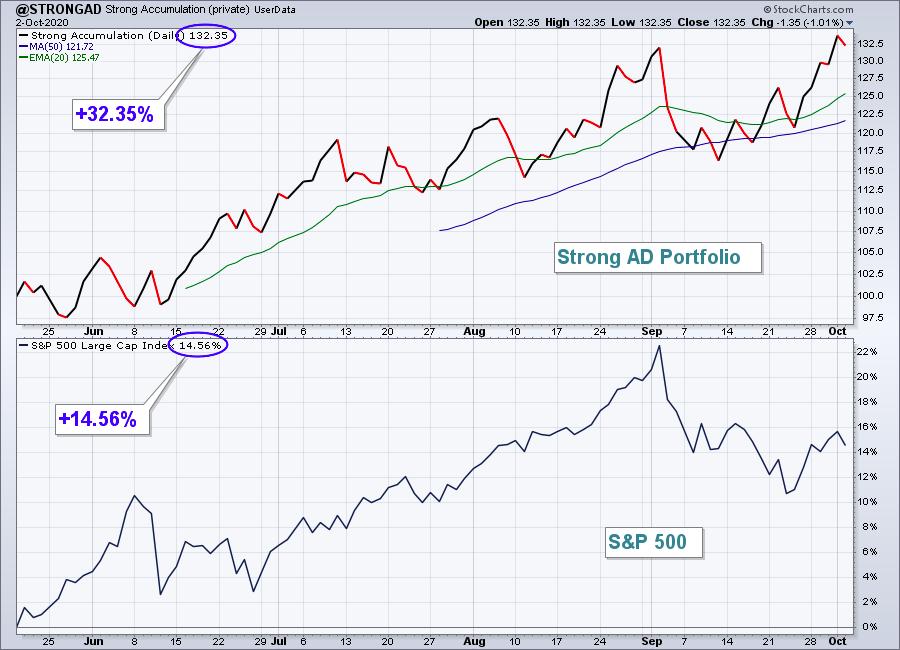
Here are how the Strong AD portfolio component stocks performed last week:
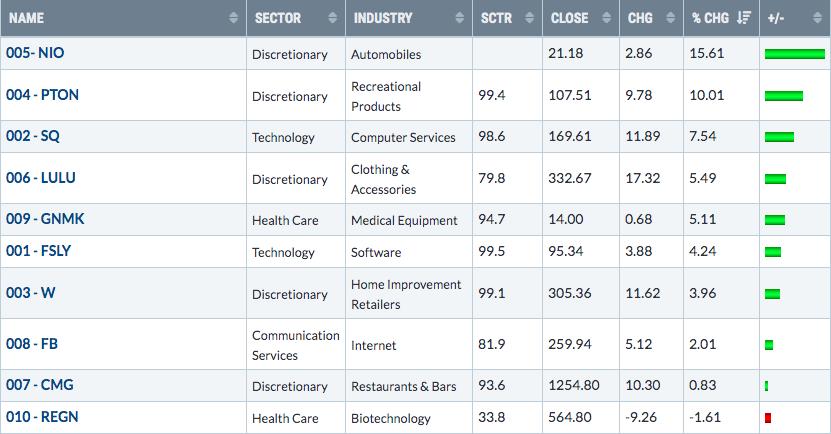
There were some excellent performers in our Strong AD Portfolio last week. It's hard to pick my favorite, although NIO's breakout would be difficult to top. Instead, I'll focus on the only weakling in this portfolio - REGN. There was potentially good news after the bell on Friday as President Trump's COVID-19 treatment was reported to include REGN's "antibody cocktail". The President's improvement in health, or lack thereof, may play a big part in REGN's performance in the week ahead as this is obviously a high-profile case. My initial reaction is one of bullishness, however, as the White House picking REGN's drug I'm sure came after studying various alternatives. I believe the market will interpret this selection as a sign that it likely has the most promising treatment for COVID. But again, the President's health could dictate the ultimate performance here.
Summary
There's good news in that we've escaped the wrath of September with a bull market largely intact. Now it's on to October and yet another earnings season. Despite Friday's big market rotation away from leading areas during the pandemic and those outperforming growth stocks, I remain quite bullish. I'm monitoring key market relationships to help determine whether we should expect further rotation away from growth, but I'm not really seeing anything to confirm that at this point. Instead, I'd continue to stick with what's been working since March. One day never makes a trend, but the rotation we saw on Friday will bear monitoring this week for sure.
Happy trading!
Tom Bowley, Chief Market Strategist
EarningsBeats.com
"Better timing. Better trades."