
EB Weekly Portfolio Report - Sunday, October 11, 2020
Upcoming Earnings Reports
According to Zacks.com, the following companies will be reporting earnings this week and each is a component of one of our portfolios:
Monday, October 12: None
Tuesday, October 13: None
Wednesday, October 14: None
Thursday, October 15: None
Friday, October 16: None
PLEASE NOTE: The above companies were provided after scanning the Zacks Earnings Calendar. My research is limited to what Zacks provides and I also can make a mistake from time to time, so please check for earnings dates for all companies that you own. We do hold our portfolio stocks through one earnings report, but every EarningsBeats.com member must make their own investing/trading decisions about holding stocks into earnings reports as it's the most volatile (risky) time to own a stock.
Portfolio Rules and Objectives
Here are the common traits and objectives of our portfolios:
- There are 10 leading stocks from up to 10 leading industries in each portfolio (at the time of selection). Generally, there will only be one stock per industry group, but there could be exceptions.
- They are held for an entire 90 day period, with no stops in place. We strive for consistency, transparency, and simplicity in our portfolios. EB.com members may hold these stocks for the entire 90 days, trade them, use stops, etc., but for purposes of our calculation, we will make no exceptions to our "buy and hold for three months" strategy.
- Every stock will generally be held through ONE earnings report
- The expectation is that relative winners will carry the portfolio to outperformance
- They were all entered into as of the close on Wednesday, August 19th; members may choose to try to time better entries, but EB.com will "purchase" as of August 19th's closing price
- Primary objective is to outperform the benchmark S&P 500
Here are several considerations for EB members:
- I would expect the Strong AD and Aggressive portfolios to be the riskiest, followed by the Model portfolio, and then the Income portfolio
- The Strong AD portfolio will be selected from a combination of rising accumulation/distribution lines and SCTRs above 80 at the time of selection. It is the only portfolio that does NOT require a revenue and EPS beat in its most recent quarterly earnings report
- The Income portfolio stocks will all pay dividends, with the expected average dividend yield to be at least 1.5%
- Drawdowns (losses) should be much milder on the Income portfolio, with more volatility expected on the other three; please review inception-to-date charts below to gain an idea of the volatility associated with each
- I believe the larger drawdown on the Income portfolio at the beginning of the pandemic was an anomaly, occurring as many defensive, higher-yielding companies uncharacteristically underperformed during a market decline.
- You should own or trade these stocks in whatever manner is most comfortable for you; while we will buy all 10 stocks in the manner identified above, feel free to trade certain stocks or wait for pullbacks if the stocks are overbought
- We have no idea what risk each member is willing or able to take. We are not registered investment advisors so be sure you understand the risk you take. Please consult your financial advisor.
- EarningsBeats.com shareholders/employees may own all or some of the portfolio stocks from time to time.
Weekly Snapshot
Here's a weekly recap:
It was a large weekly advance in the S&P 500 last week and one that really showed little movement in the growth vs. value ratio (IWF:IWD) that I follow so closely. We ended the week with this ratio little changed:
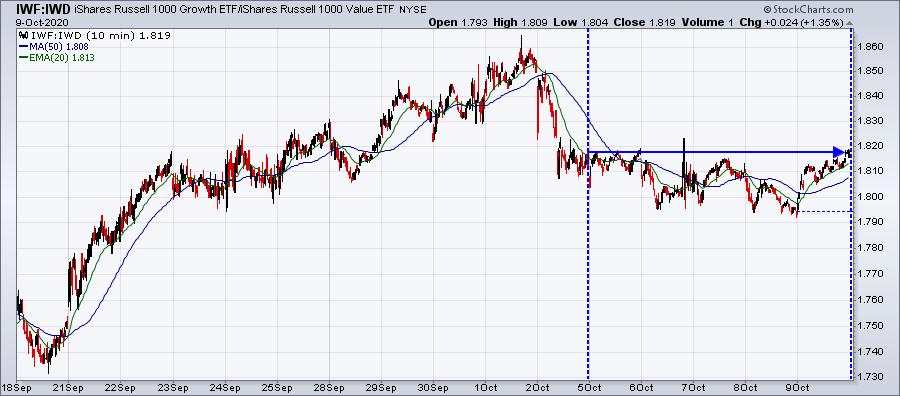
I'm expecting that this ratio will turn higher again, but we most definitely should be prepared in the event it doesn't. I'm confident the U.S. stock market is heading higher during the balance of Q4, so the big story will be whether the 7 month theme since mid-March continues or if we begin to see new leadership emerge.
Weekly Summary
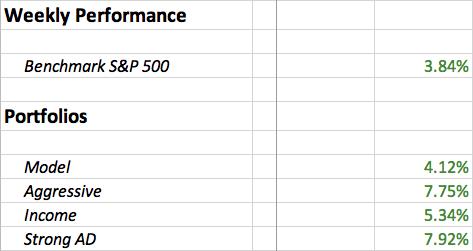
Benchmark S&P 500:
Last week, I showed a down channel that appeared to be broken on the S&P 500 on an hourly chart. I was awaiting either a short-term breakout above 3400 or a possible continuation of the consolidation that we've seen since early-September. We saw the breakout as follows:
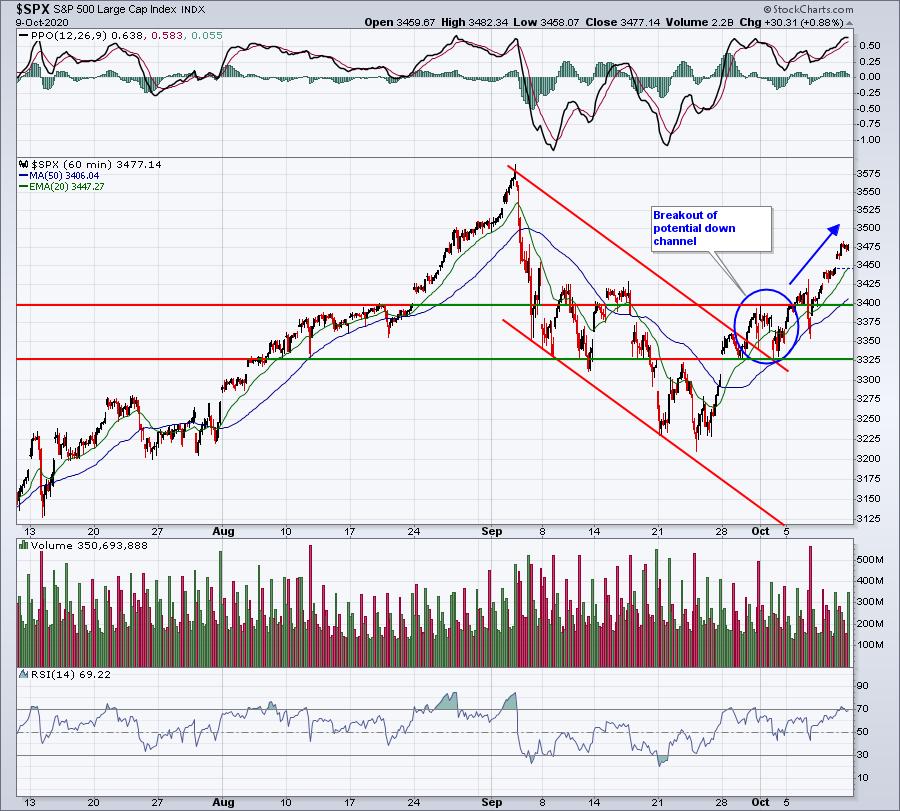
The blue circle highlights the breakout of the down channel featured in last week's EB Weekly Portfolio Report, while the blue directional line highlights the strength and breakout above 3400 to help confirm the September bottom. It's hard to be anything other than bullish as we move towards the kickoff of earnings season.
Model Portfolio:
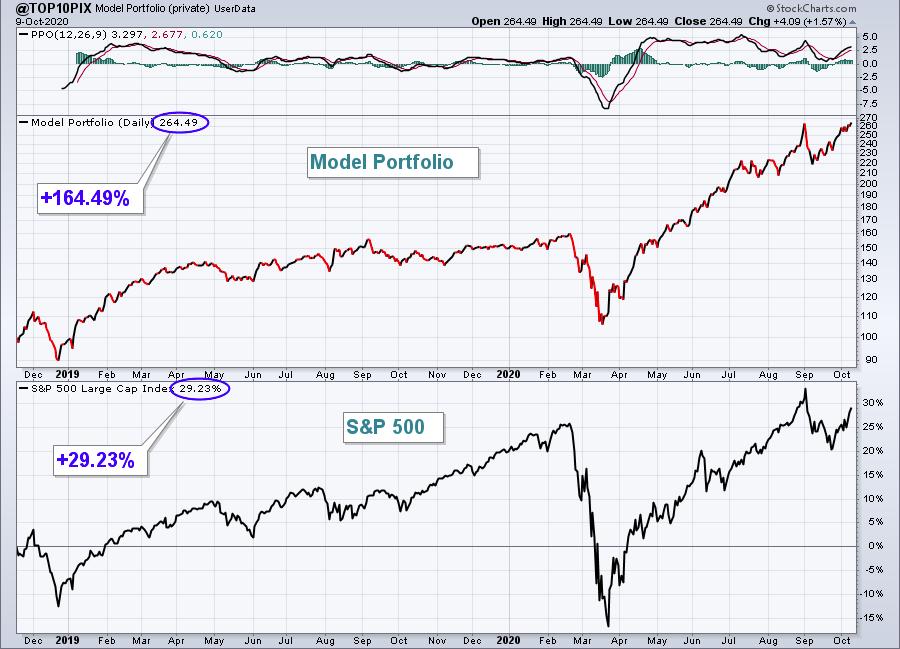
The Model portfolio jumped another 4.12%, slightly beating the benchmark S&P 500 last week. Here's the updated inception-to-date chart of the portfolio:
Here are how the Model portfolio component stocks performed last week:
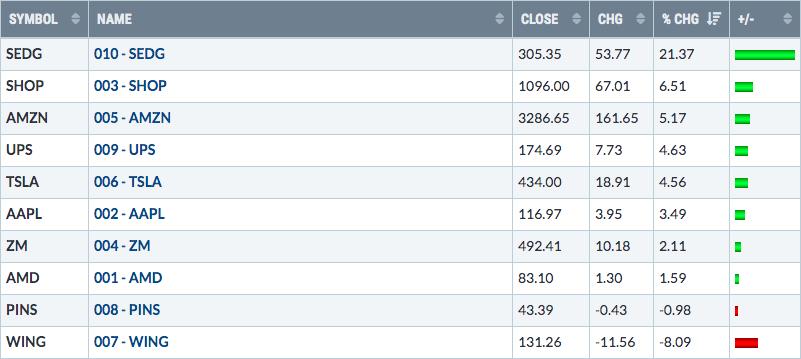
Renewable energy ($DWCREE, +19.80%) was easily the best performing industry group last week, gaining nearly 20%. SEDG is a leader in the space and it certainly benefited to the tune of 21%. Without SEDG's weekly gain, we would likely have seen underperformance in the Model Portfolio last week.
Aggressive Portfolio:
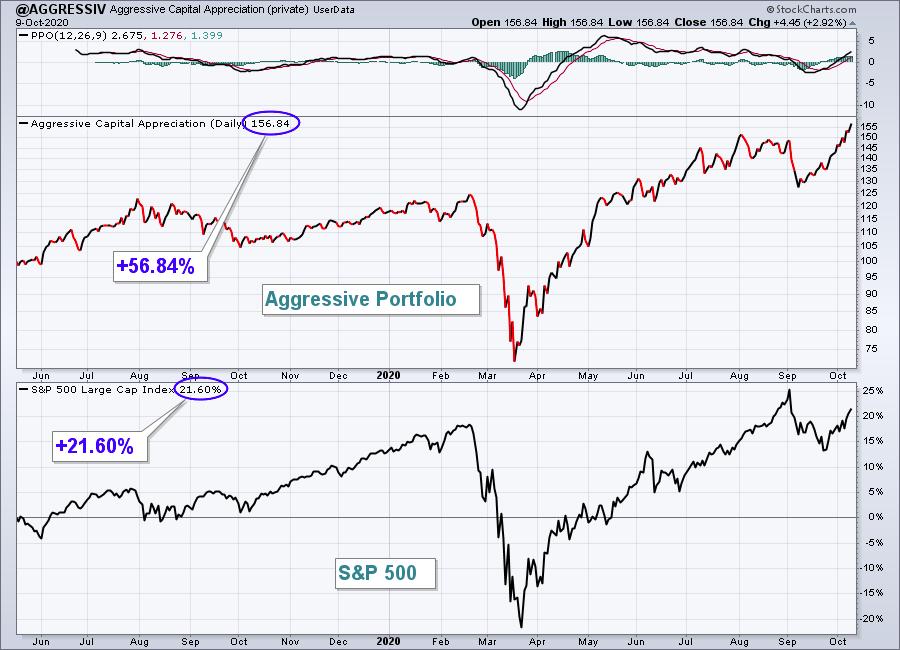
The Aggressive portfolio surged higher by 7.75% last week and has now surpassed the S&P 500's performance this quarter, something I'd have considered unlikely a month ago.
Here's the Aggressive portfolio chart since its inception on May 19, 2019:
Here are how the Aggressive portfolio component stocks performed last week:
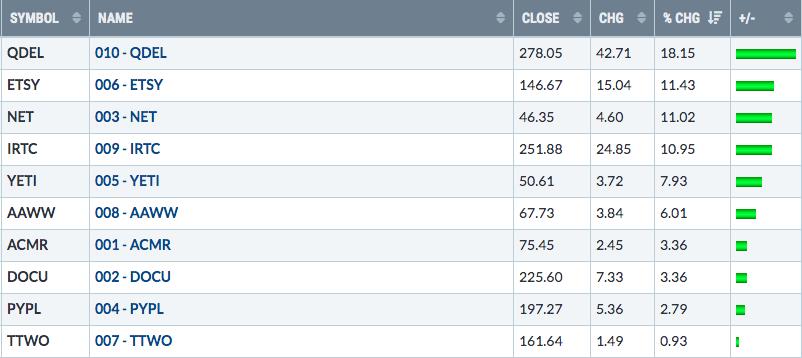
One of last week's leaders, NET, looks particularly strong on its chart after last week's breakout:
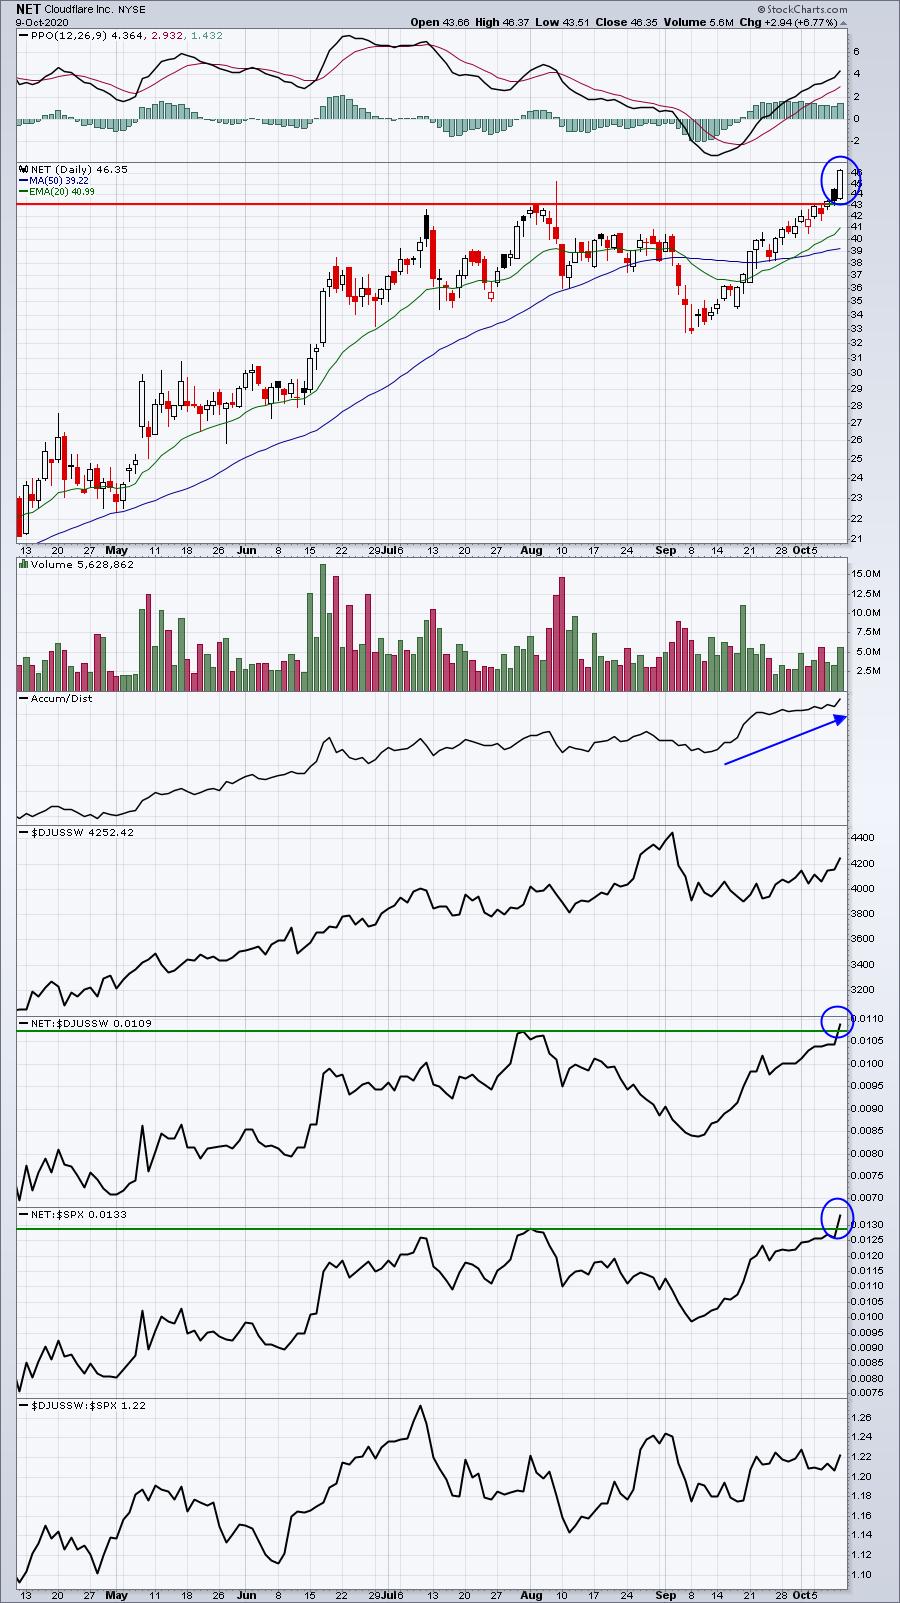
When you're evaluating your stocks, the above is exactly the type of positive confirmation I look for. Volume accelerates to confirm the price breakout and we see relative breakouts as well. And it never hurts to be in a solid industry group. Software ($DJUSSW) has been one of the brightest spots of the stock market in recent years.
Income Portfolio:
The Income portfolio rose 5.34%, continuing to close the gap of underperformance vs. the S&P 500. Here's a look at the inception-to-date chart:
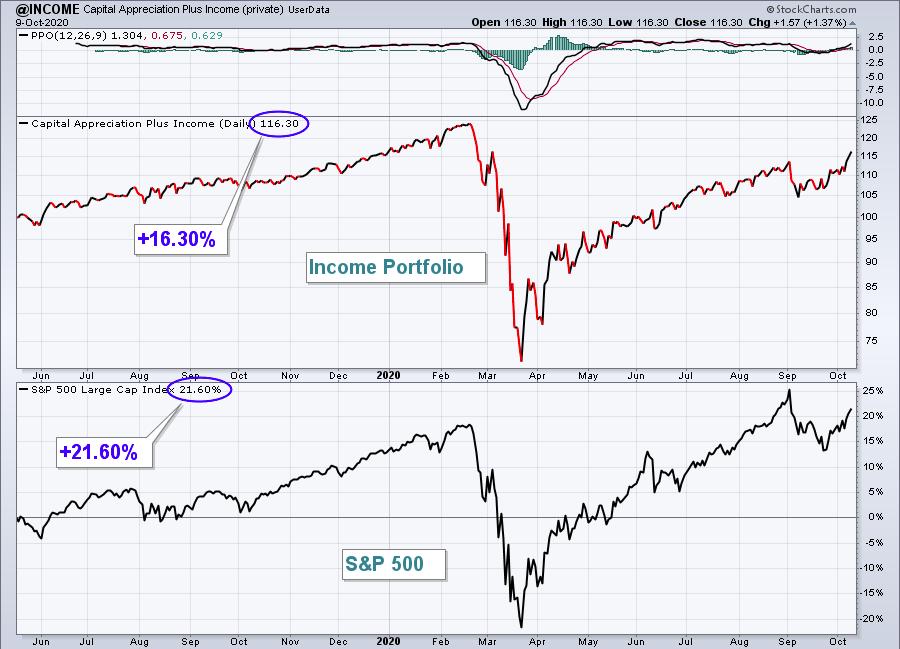
Here are how the Income portfolio component stocks performed last week:
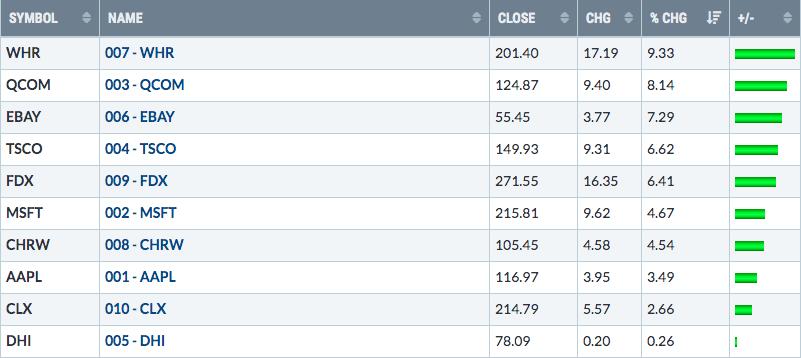
WHR and QCOM both are in breakout mode, but I was actually more impressed with the sudden resurgence in EBAY. Volume expanded and its recent down channel was broken. Also, its industry group, specialized consumer services ($DJUSCS) has broken out and EBAY was a prior leader. I'll be watching to see if EBAY regains its leadership role. If so, and given the group's renewed strength, I'd look for a very solid Q4 ahead for EBAY.
Strong AD Portfolio:
The Strong AD Portfolio surged 7.92%, adding to its dominant performance since inception. Here's a look at the inception-to-date chart:
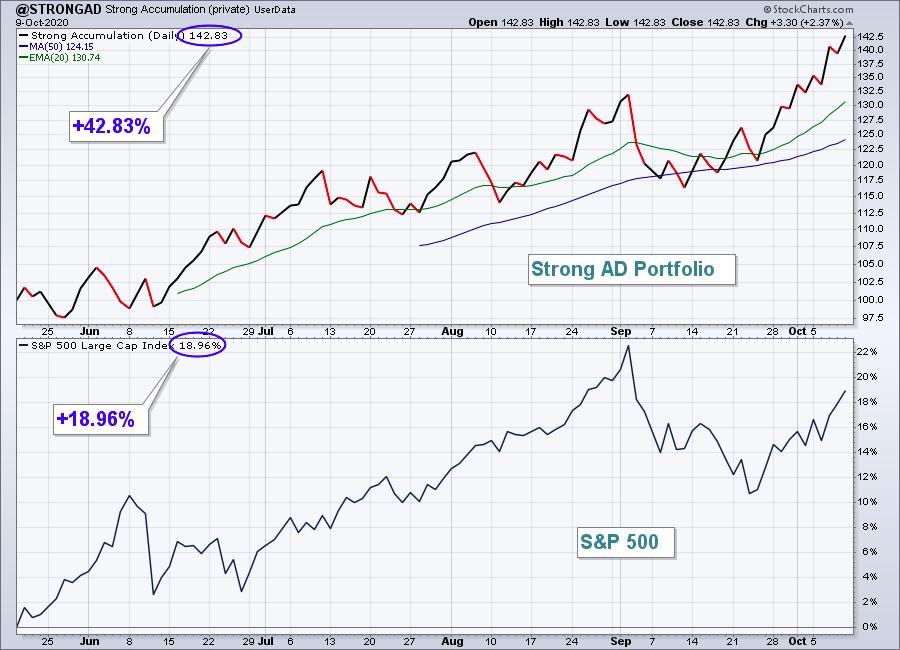
Here are how the Strong AD portfolio component stocks performed last week:
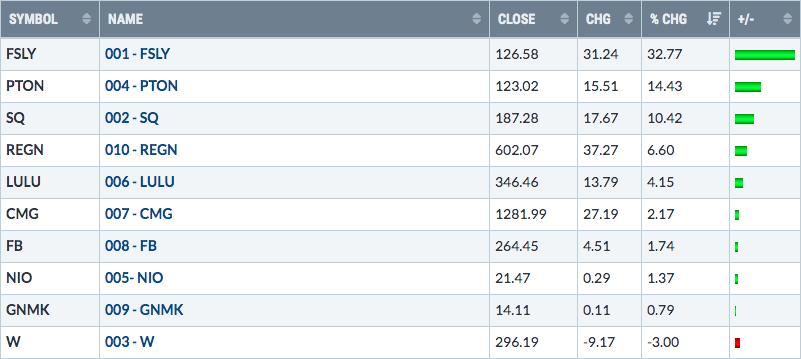
PTON has been a monster and it still looks incredibly bullish. But I can't avoid the massive week that FSLY had, breaking to a new 52-week high just days after breaking out of a recent period of consolidation:
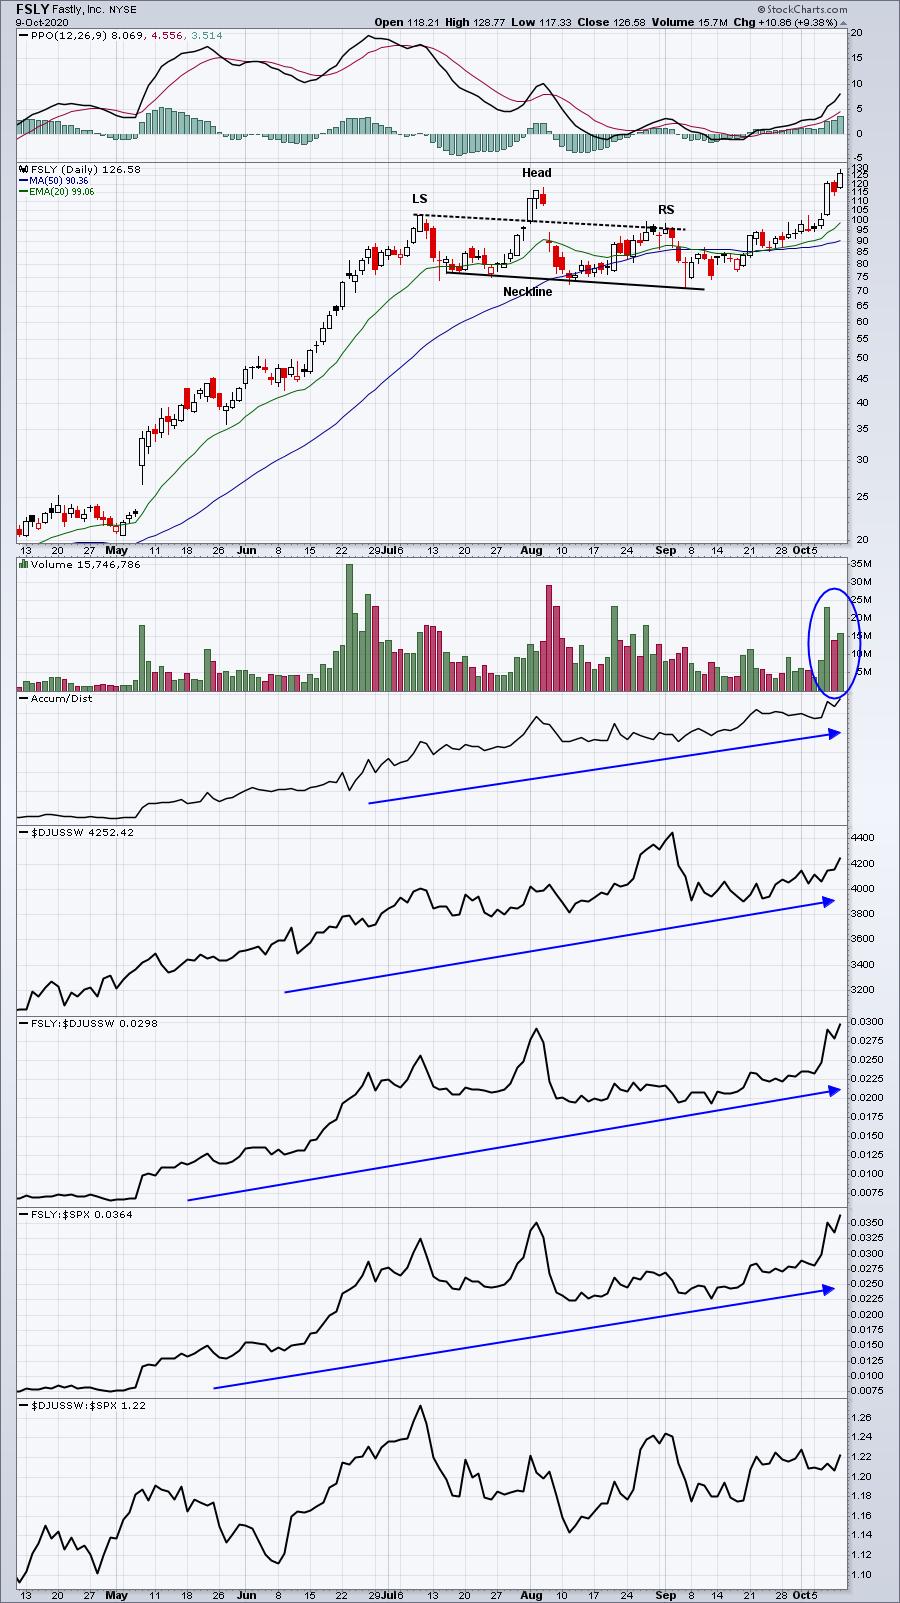
In addition to a solid breakout here, there's an educational lesson as well. I had an email from a member a few weeks back, asking me if I was worried about the topping head & shoulders pattern that had formed on FSLY and if it was a sell signal. I answered that a heavy volume breakdown of neckline support would be bearish confirmation. Until then, I'd be okay with holding at price support. To be quite candid, that head & shoulders was leaning to the right, meaning that the right side of the neckline was slightly lower than the left side. Also, the right shoulder was sloping lower from the left shoulder. It was definitely not a good look at all. But many technicians get these head & shoulders patterns wrong, because the pattern doesn't confirm until you see the heavy volume breakdown. FSLY never got that and now look at that breakout. The other point I made at the time was that I'm bullish and not looking for bearish patterns. Instead, I view most consolidation in leaders as necessary and bullish, looking for upside resolution in time. We're seeing that in FSLY now.
Summary
There are so many signals that are now confirming the secular bull market that I've discussed throughout the pandemic. Transportation stocks ($TRAN) broke to all-time highs last week and there is honestly nothing bearish that you can take away from that. The consumer stocks on Friday posted the highest daily closing ratio of discretionary vs. staples (XLY:XLP) ever. These types of signals do not precede bear markets.
Short this market at your own risk.
Happy trading!
Tom Bowley, Chief Market Strategist
EarningsBeats.com
"Better timing. Better trades."