
EB Weekly Portfolio Report - Sunday, October 18, 2020
Upcoming Earnings Reports
According to Zacks.com, the following companies will be reporting earnings this week and each is a component of one of our portfolios:
Monday, October 19: None
Tuesday, October 20: None
Wednesday, October 21: TSLA, CMG, WHR
Thursday, October 22: AMZN, TSCO
Friday, October 23: None
PLEASE NOTE: The above companies were provided after scanning the Zacks Earnings Calendar. My research is limited to what Zacks provides and I also can make a mistake from time to time, so please check for earnings dates for all companies that you own. We do hold our portfolio stocks through one earnings report, but every EarningsBeats.com member must make their own investing/trading decisions about holding stocks into earnings reports as it's the most volatile (risky) time to own a stock.
Portfolio Rules and Objectives
Here are the common traits and objectives of our portfolios:
- There are 10 leading stocks from up to 10 leading industries in each portfolio (at the time of selection). Generally, there will only be one stock per industry group, but there could be exceptions.
- They are held for an entire 90 day period, with no stops in place. We strive for consistency, transparency, and simplicity in our portfolios. EB.com members may hold these stocks for the entire 90 days, trade them, use stops, etc., but for purposes of our calculation, we will make no exceptions to our "buy and hold for three months" strategy.
- Every stock will generally be held through ONE earnings report
- The expectation is that relative winners will carry the portfolio to outperformance
- They were all entered into as of the close on Wednesday, August 19th; members may choose to try to time better entries, but EB.com will "purchase" as of August 19th's closing price
- Primary objective is to outperform the benchmark S&P 500
Here are several considerations for EB members:
- I would expect the Strong AD and Aggressive portfolios to be the riskiest, followed by the Model portfolio, and then the Income portfolio
- The Strong AD portfolio will be selected from a combination of rising accumulation/distribution lines and SCTRs above 80 at the time of selection. It is the only portfolio that does NOT require a revenue and EPS beat in its most recent quarterly earnings report
- The Income portfolio stocks will all pay dividends, with the expected average dividend yield to be at least 1.5%
- Drawdowns (losses) should be much milder on the Income portfolio, with more volatility expected on the other three; please review inception-to-date charts below to gain an idea of the volatility associated with each
- I believe the larger drawdown on the Income portfolio at the beginning of the pandemic was an anomaly, occurring as many defensive, higher-yielding companies uncharacteristically underperformed during a market decline.
- You should own or trade these stocks in whatever manner is most comfortable for you; while we will buy all 10 stocks in the manner identified above, feel free to trade certain stocks or wait for pullbacks if the stocks are overbought
- We have no idea what risk each member is willing or able to take. We are not registered investment advisors so be sure you understand the risk you take. Please consult your financial advisor.
- EarningsBeats.com shareholders/employees may own all or some of the portfolio stocks from time to time.
Weekly Snapshot
Here's a weekly recap:
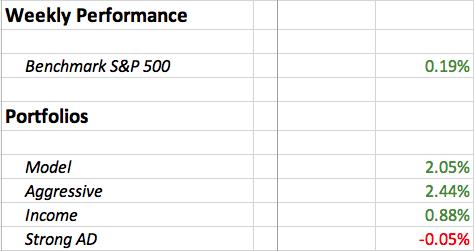
There was PLENTY of volatility in the market and in our portfolios last week. It might appear on the surface as though things were stable throughout the week, but they were anything but that. By week's end, however, 3 of our portfolios managed to out gain the S&P 500, with only slight underperformance in the Strong AD Portfolio, which was a story in itself. More on that below.
Weekly Summary
Benchmark S&P 500:
I'm not sure where to start. It was options expiration week which, along with the week after options expiration, typically produces a lot of anxiety for us. There was plenty of that to go around. It truly was a crazy week. Transports ($TRAN) set an all-time high, but then received a double-dose of bad news when JB Hunt Transport Services (JBHT, -9.73%) dropped nearly 10% after it missed its EPS estimate on Friday morning. The first piece of bad news was the reaction to Kansas City Southern's (KSU) quarterly report after it posted revenues that fell short of expectations. The TRAN was not trading like we would see quarterly misses and both stocks were hit hard. KSU fell 2.72% on Friday.
Then there was the up-and-down roller-coaster ride on the growth vs. value ratio (IWF:IWD). We started the week at 1.819 and finished at 1.826, so it was little changed. But during the week, it hit 1.88, not far from an all-time high before giving all the gains back. The Volatility Index ($VIX) began the week at 25, but pierced 29 on Thursday.
Yet when all was said and done, the S&P 500 and our portfolios (except the Strong AD) finished higher, albeit slightly.
Model Portfolio:
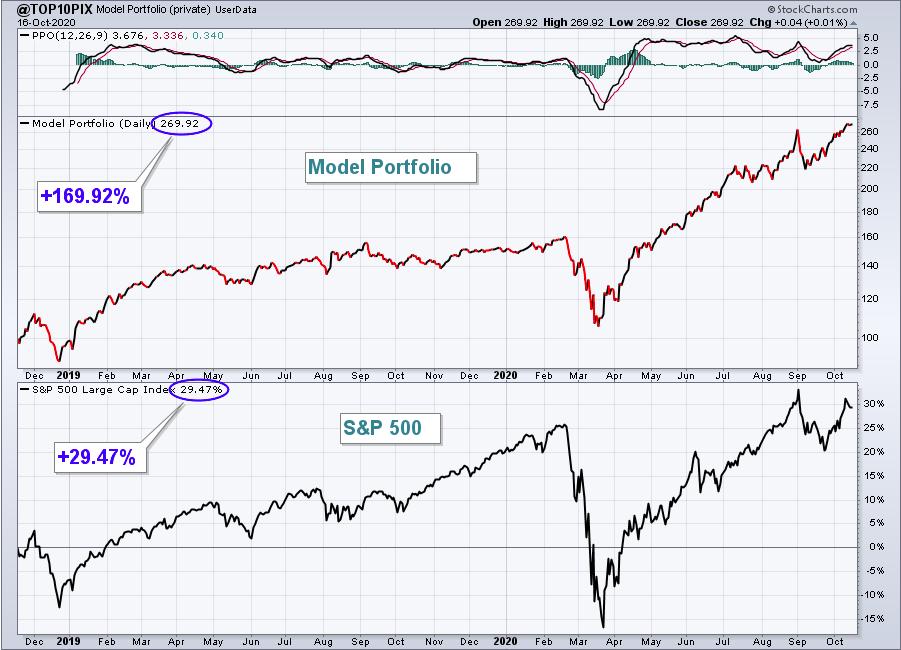
The Model portfolio jumped another 2.05%, adding to its remarkable 2-year run. Here's the updated inception-to-date chart of the portfolio:
Here are how the Model portfolio component stocks performed last week:
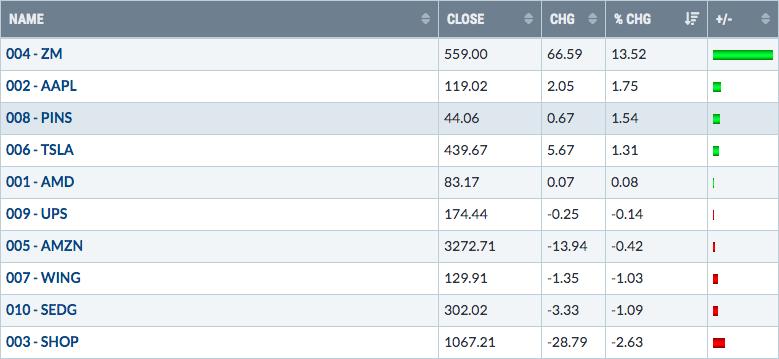
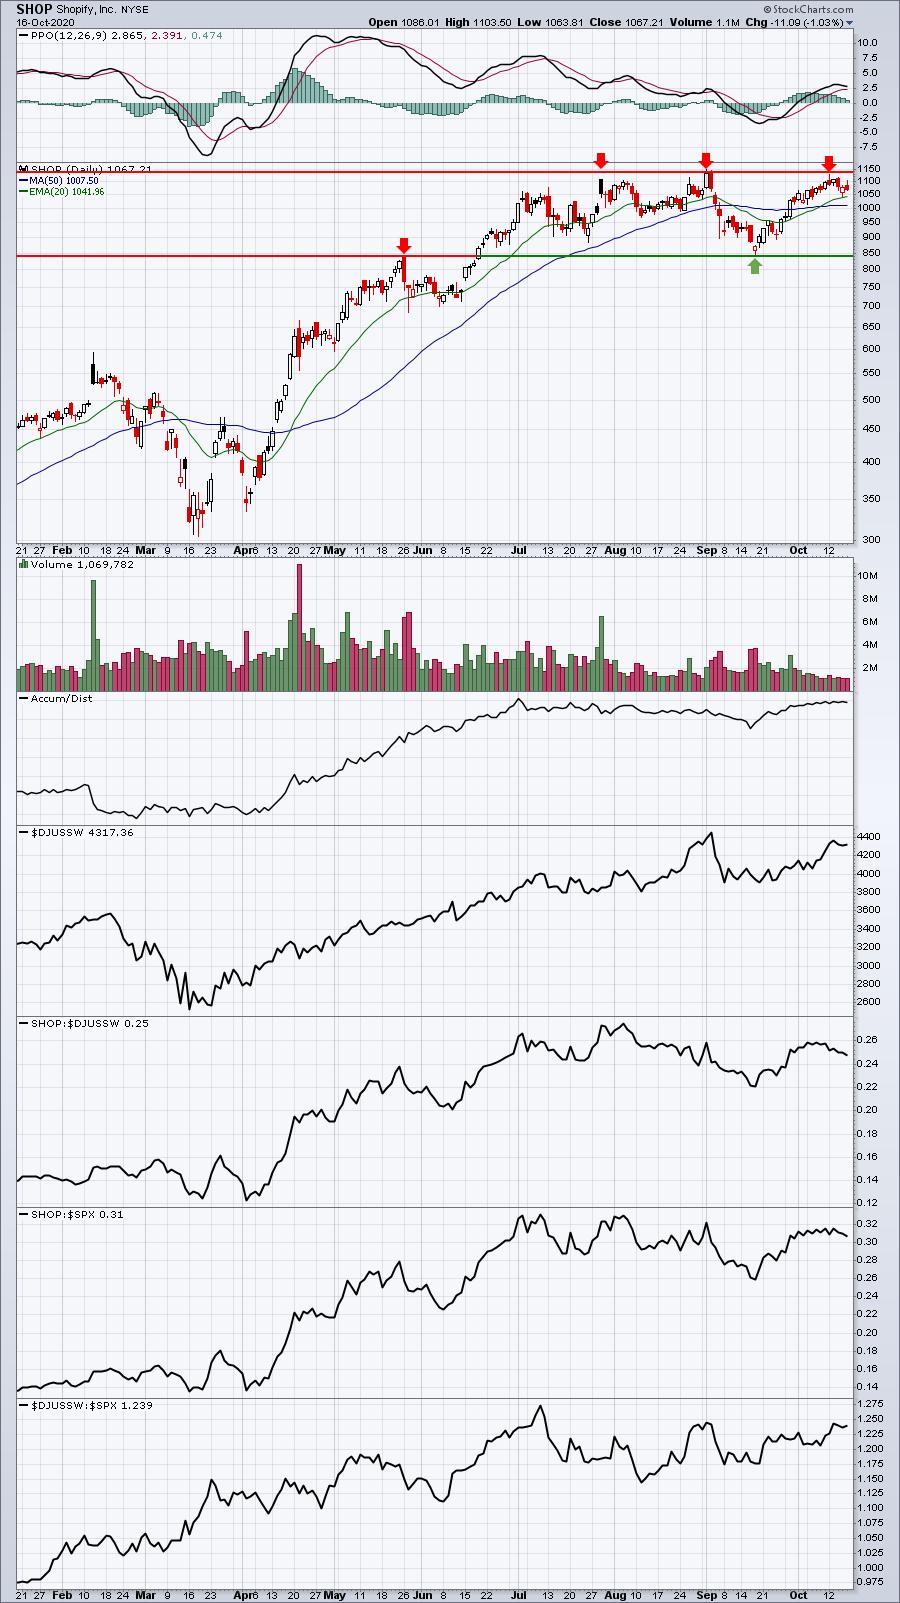
Last week's weak Model Portfolio stock was SHOP, but I believe we're heading for another blowout report in this software leader. It's been consolidating since its similar highs in July and September, while support has held exactly where I'd expect:
Aggressive Portfolio:
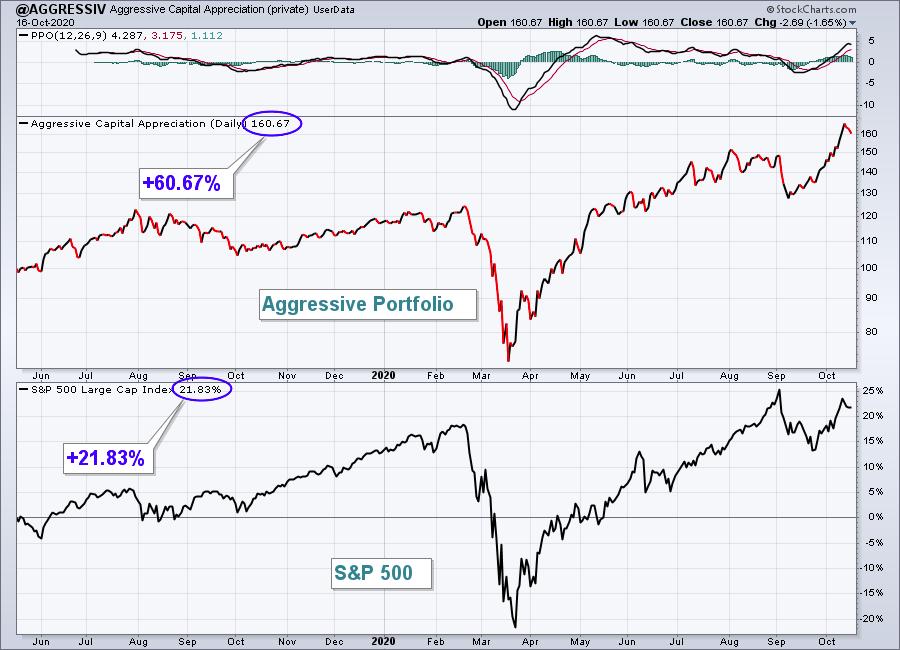
The Aggressive portfolio surged higher by 2.44% and continues to pull away from the S&P 500, despite its early struggles this quarter.
Here's the Aggressive portfolio chart since its inception on May 19, 2019:
Here are how the Aggressive portfolio component stocks performed last week:
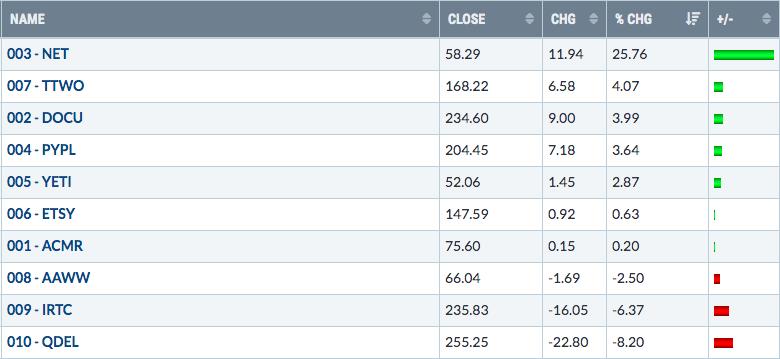
We saw weakness in a couple of health care names last week, but strength in NET easily offset that. I pointed to NET's breakout last Sunday and we saw a surge in its shares this past week as a result:
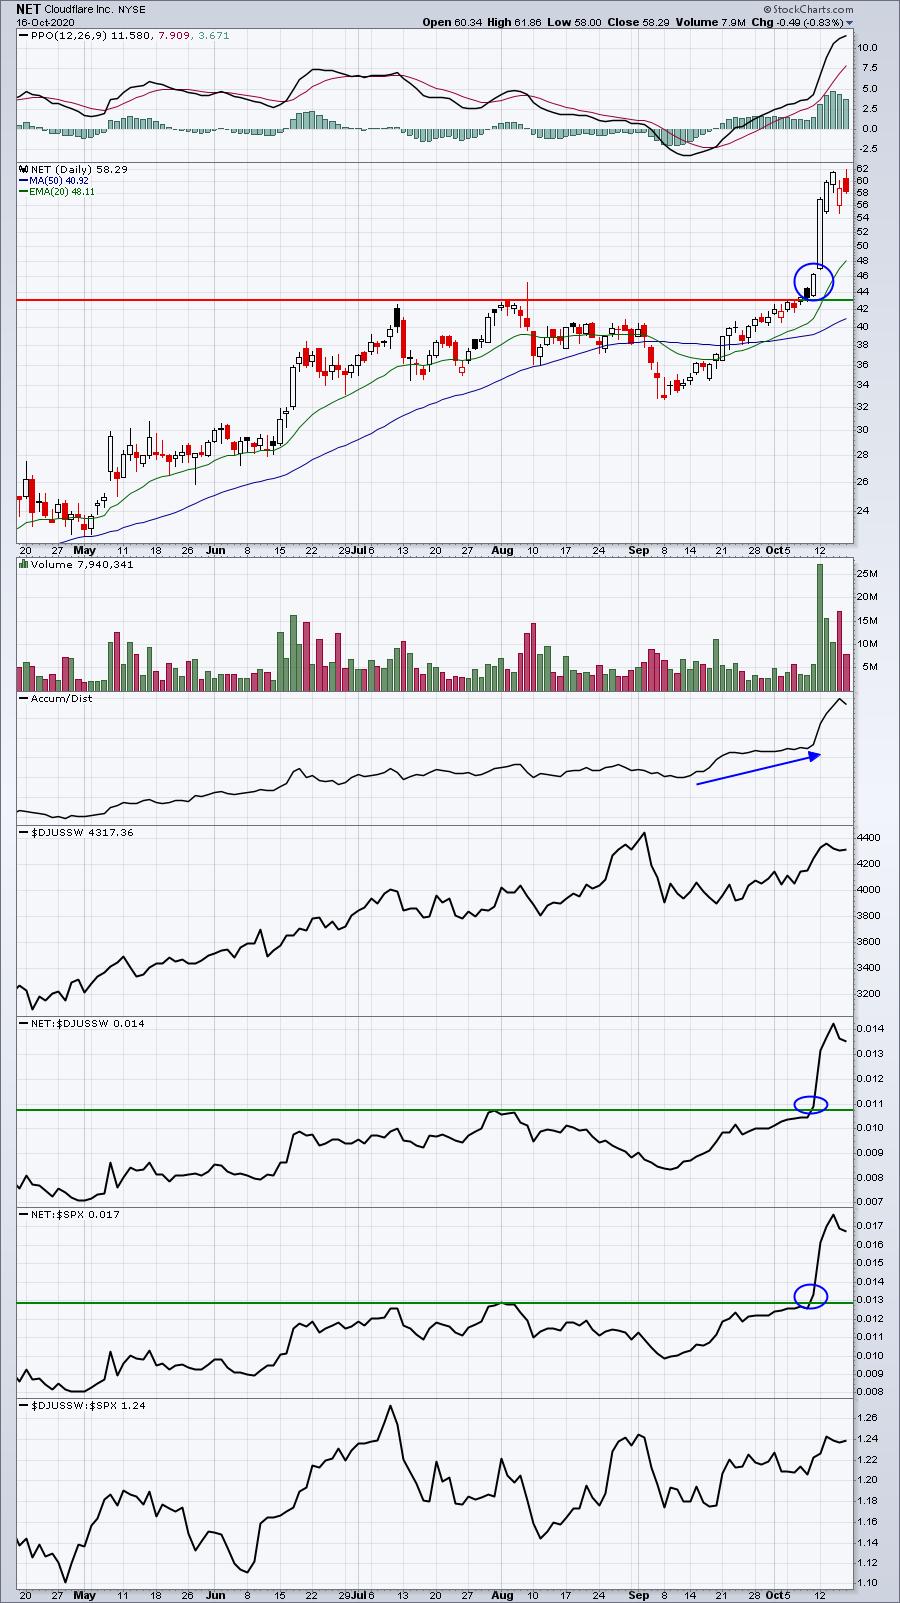
This is a reprint of the chart I posted last week, but it's quite telling. It's not just price that soared. Obviously, relative strength soared as well. Perhaps, just as important, the AD line pushed significantly higher, indicating that the volume represented significant buying and accumulation. NET, while overbought near-term, certainly appears to be a stock that will trade higher longer-term.
Income Portfolio:
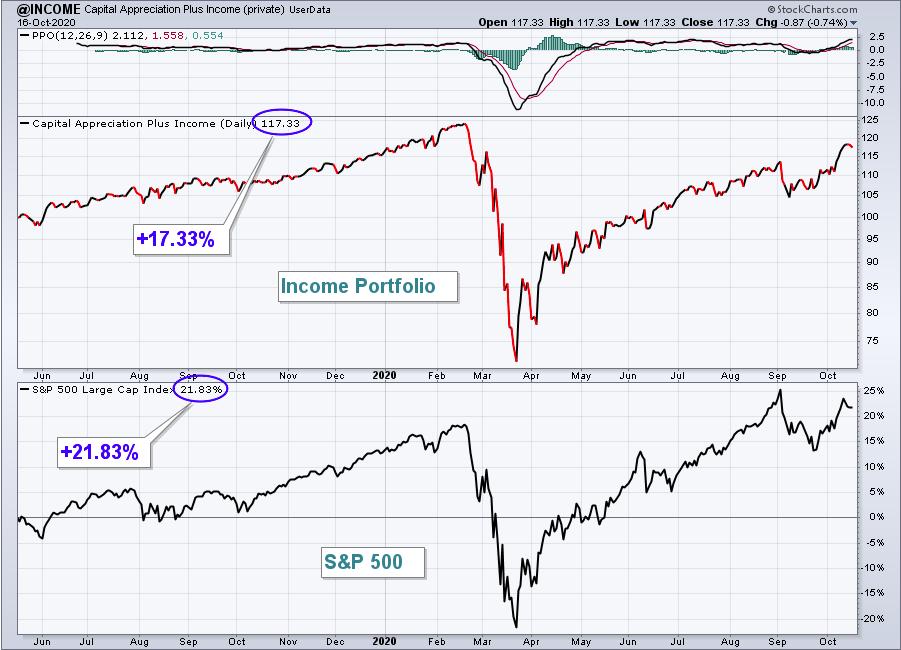
The Income portfolio rose 0.88%, slightly outpacing the S&P 500. Here's a look at the inception-to-date chart:
Here are how the Income portfolio component stocks performed last week:
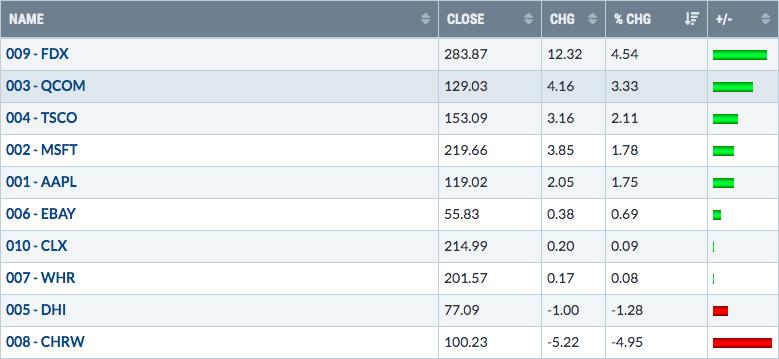
Trucking ($DJUSTK) took a big hit on Friday after JB Hunt Transport Services (JBHT) - not a portfolio stock - disappointed Wall Street by missing its EPS estimate. Unfortunately, our CHRW suffered in sympathy. I believe this is creating an opportunity for entry, however, for traders. CHRW is a leading stock in trucking. JBHT was not. JBHT was actually not far off from a 52-week relative low vs. its trucking peers before its earnings report was released. I'll be very surprised if CHRW releases a similar disappointing report when its earnings come out on October 27th after the market closes. Here's the current chart on CHRW and what I'm watching:
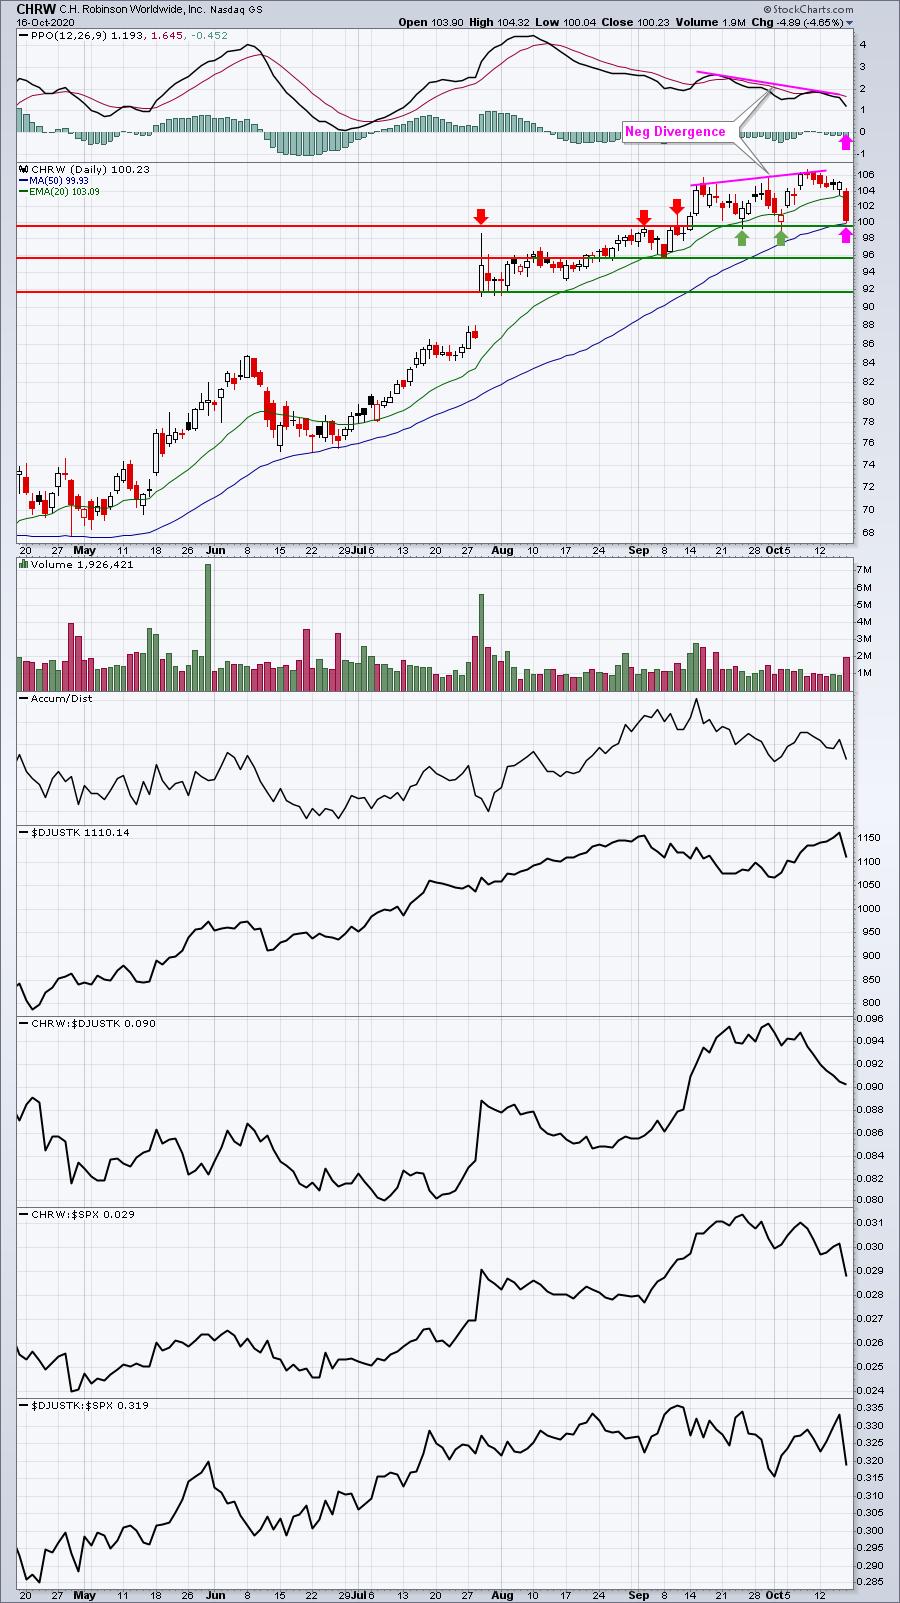
CHRW has been trading mostly sideways, but there's been a negative divergence in play that typically suggests possible PPO centerline and 50 day SMA tests lie ahead (pink arrows). The 50 day SMA test occurred on Friday, which also coincided with key short-term price support. I would not be surprised if CHRW bounces from this level. However, if it fails to hold that support, I've identified the two other support levels I'd be very interested in. The final support level near 92 is critical in my view. That's where significant buying occurred after CHRW's last earnings report. 91.84 was the open that day and is very important support. I'm not saying CHRW is heading that far down, but if the market weakens during its upcoming bearish period, or if truckers continue to be dumped, it's a definite possibility.
Strong AD Portfolio:
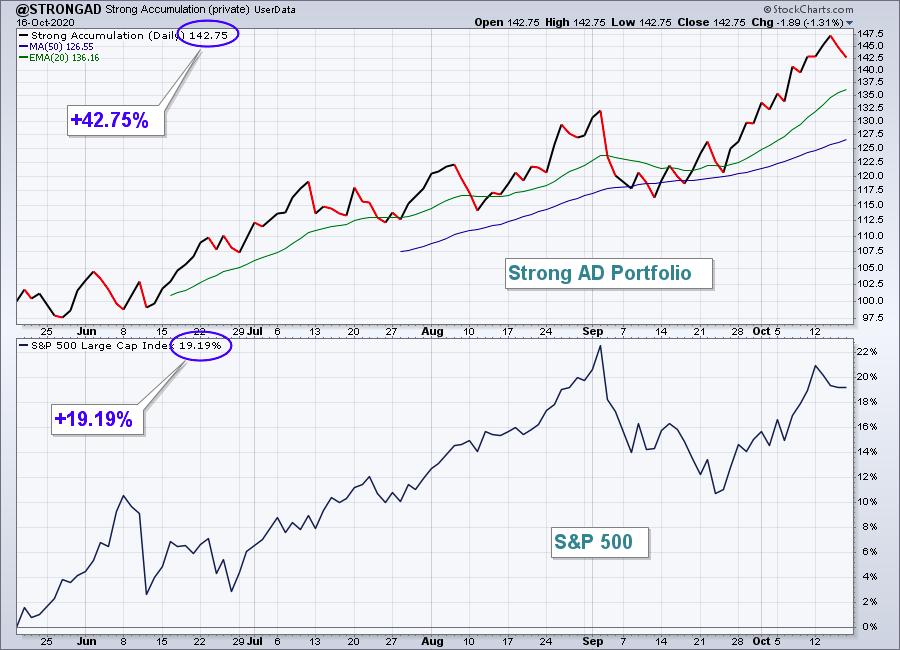
The Strong AD Portfolio fell 0.05%, but there were fireworks everywhere - both good and bad. Here's a look at the inception-to-date chart:
Here are how the Strong AD portfolio component stocks performed last week:
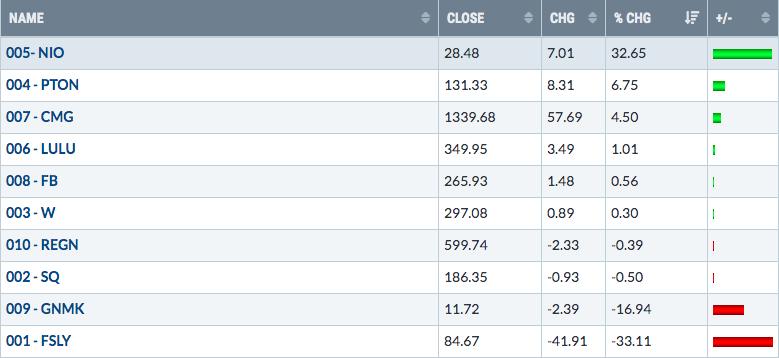
Is the glass half-full or half-empty? I'm not sure if I should be happy that the portfolio broke even given the big drops in both FSLY and GNMK.....or upset that a massive gain in NIO was wasted. I'll take the former and be thankful that two large drops were offset. After all, that's really the idea of our portfolios in the first place - that we'll have large winners to carry the portfolios, and more than offset the losers that will inevitably occur. We certainly cannot expect that we're going to select 40 companies in our portfolios that will all outperform the benchmark S&P 500. That's setting an unrealistic bar. In the case of FSLY, the big drop came after a huge gain. One week ago, the stock was trading on top of the world, breaking out to new all-time highs on heavy volume. They laid an egg by cutting their revenue estimate and Wall Street often times has an excellent memory and is unwilling to forgive management teams for their financial sins. It'll be very interesting to see how this plays out, both this quarter and over the next couple of quarters. FSLY reports its quarterly results on October 28th after the market closes. That will be a very interesting quarterly report. In the meantime, let's check out the latest chart on FSLY:
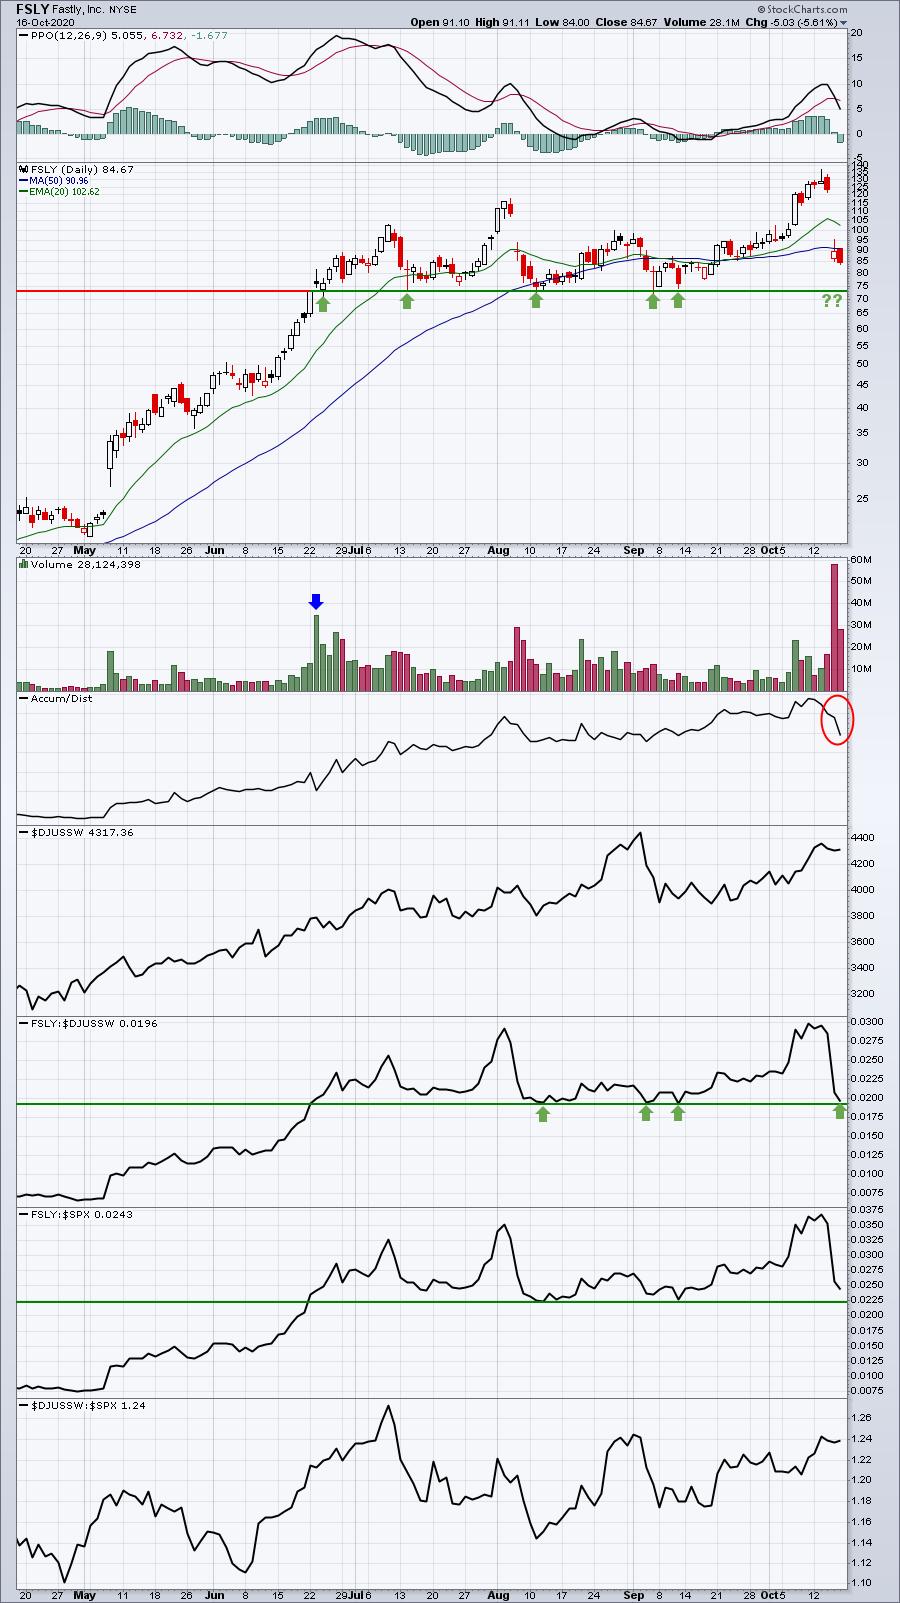
The good news is that FSLY is a part of software, which remains quite strong. The bad news is that there's more downside possible until we see major price support. I marked the heavy volume (blue arrow) gap higher on June 23rd, because since that high volume gap, FSLY has not closed beneath gap support at 73.27. We've seen intraday drops beneath that level on multiple occasions, but not one close there. Given all the uncertainty and negativity surrounding FSLY now, I could certainly see another test of this level.
The other interesting development with FSLY is that there was a TON of net in-the-money call premium prior to that announcement. Millions and millions of option dollars were lost on that reduced revenue guidance. Options pain comes in all shapes and sizes and FSLY was simply one more example of how cruel the options market can be. It's why I haven't traded options in years.
I wrote an article last week on Peloton (PTON) because of its huge net in-the-money call premium. It held up fairly well, and I still love the company, but selling this week wouldn't surprise me because of options.
Summary
We will see our first batch of portfolio stocks reporting earnings this week. I expect, for the most part, that companies will beat estimates, but I'm most interested in reactions to earnings reports as many companies trade higher into earnings as Wall Street anticipates strong numbers. The action immediately after earnings are reported can help to provide us clues as to short-term (1-3 months) market direction.
As I discussed in my Daily Market Report on Friday, I always take a more cautious approach to trading over the next 7-10 days. The 19th is historically the worst calendar day of the month, producing annualized losses of more than 30% on the S&P 500 since 1950. The 19th-25th is a rough week for ALL calendar months since 1950. And October 21st-27th is historically the worst week of the year. Please keep in mind that it has risen many times as well. We're talking about tendencies here. But as a short-term trader, capital preservation is critical during times of uncertainty. I won't move entirely to cash, but I definitely have built up more cash than normal during a secular bull market. I haven't calculated my cash position exactly, but I'd estimate that I'm 50% cash right now.
The better news is that once this upcoming bearish period ends on October 27th at the close, the absolute best historical period of the year follows. The S&P 500 has risen 61 of the last 70 years from the October 27th close to the January 18th close. That's a very strong probability. Given the fact that I believe we're in a secular bull market, I believe the odds are even greater. That's just my opinion, of course - no guarantees!
Happy trading!
Tom Bowley, Chief Market Strategist
EarningsBeats.com
"Better timing. Better trades."