
EB Weekly Portfolio Report - Sunday, November 1, 2020
Upcoming Earnings Reports
According to Zacks.com, the following companies will be reporting earnings this week and each is a component of one of our portfolios:
Monday, October 26: PYPL, CLX, SEDG, WING
Tuesday, October 27: W
Wednesday, October 28: QCOM
Thursday, October 29: SQ, REGN, PTON, TTWO, NET, IRTC, YETI, AAWW, ACMR
Friday, October 30: None
PLEASE NOTE: The above companies were provided after scanning the Zacks Earnings Calendar. My research is limited to what Zacks provides and I also can make a mistake from time to time, so please check for earnings dates for all companies that you own. We do hold our portfolio stocks through one earnings report, but every EarningsBeats.com member must make their own investing/trading decisions about holding stocks into earnings reports as it's the most volatile (risky) time to own a stock.
Portfolio Rules and Objectives
Here are the common traits and objectives of our portfolios:
- There are 10 leading stocks from up to 10 leading industries in each portfolio (at the time of selection). Generally, there will only be one stock per industry group, but there could be exceptions.
- They are held for an entire 90 day period, with no stops in place. We strive for consistency, transparency, and simplicity in our portfolios. EB.com members may hold these stocks for the entire 90 days, trade them, use stops, etc., but for purposes of our calculation, we will make no exceptions to our "buy and hold for three months" strategy.
- Every stock will generally be held through ONE earnings report
- The expectation is that relative winners will carry the portfolio to outperformance
- They were all entered into as of the close on Wednesday, August 19th; members may choose to try to time better entries, but EB.com will "purchase" as of August 19th's closing price
- Primary objective is to outperform the benchmark S&P 500
Here are several considerations for EB members:
- I would expect the Strong AD and Aggressive portfolios to be the riskiest, followed by the Model portfolio, and then the Income portfolio
- The Strong AD portfolio will be selected from a combination of rising accumulation/distribution lines and SCTRs above 80 at the time of selection. It is the only portfolio that does NOT require a revenue and EPS beat in its most recent quarterly earnings report
- The Income portfolio stocks will all pay dividends, with the expected average dividend yield to be at least 1.5%
- Drawdowns (losses) should be much milder on the Income portfolio, with more volatility expected on the other three; please review inception-to-date charts below to gain an idea of the volatility associated with each
- I believe the larger drawdown on the Income portfolio at the beginning of the pandemic was an anomaly, occurring as many defensive, higher-yielding companies uncharacteristically underperformed during a market decline.
- You should own or trade these stocks in whatever manner is most comfortable for you; while we will buy all 10 stocks in the manner identified above, feel free to trade certain stocks or wait for pullbacks if the stocks are overbought
- We have no idea what risk each member is willing or able to take. We are not registered investment advisors so be sure you understand the risk you take. Please consult your financial advisor.
- EarningsBeats.com shareholders/employees may own all or some of the portfolio stocks from time to time.
Weekly Snapshot
Here's a weekly recap:
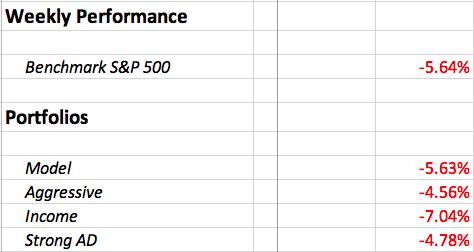
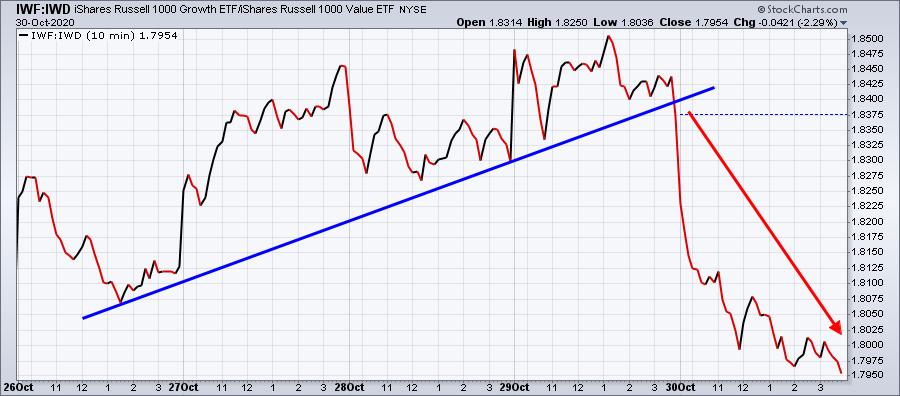
It was a rough week for U.S. equities, in general. The rotation moved in both directions, but the week ended quite bearishly for us as Tractor Supply (TSCO) was the only stock of our 39 that finished Friday in positive territory. While our relative performance vs. the benchmark S&P 500 was "ok" overall, it was very poor on Friday. A simple 5 day, 10 minute chart of the IWF:IWD ratio (growth vs. value) will help to illustrate how bad Friday was:
Weekly Summary
Benchmark S&P 500:
Volatility ($VIX) soared as fear permeated Wall Street. The two most likely culprits were the virus, which has begun to force European countries to impose restrictions and lockdowns again, and the upcoming U.S. election that takes place on Tuesday. The stock market does not like uncertainty, so I believe we'll likely see a positive market reaction to the end of the election, regardless of who wins the White House. The virus is another story altogether. I do not believe that the virus will have any long-term consequences, but I cannot deny the increasing short-term fear. Therefore, I'd bet on an eventual short-term bottom - perhaps it's already in place - and a much more bullish longer-term picture. But we'll have to weather this initial crisis first.
Model Portfolio:
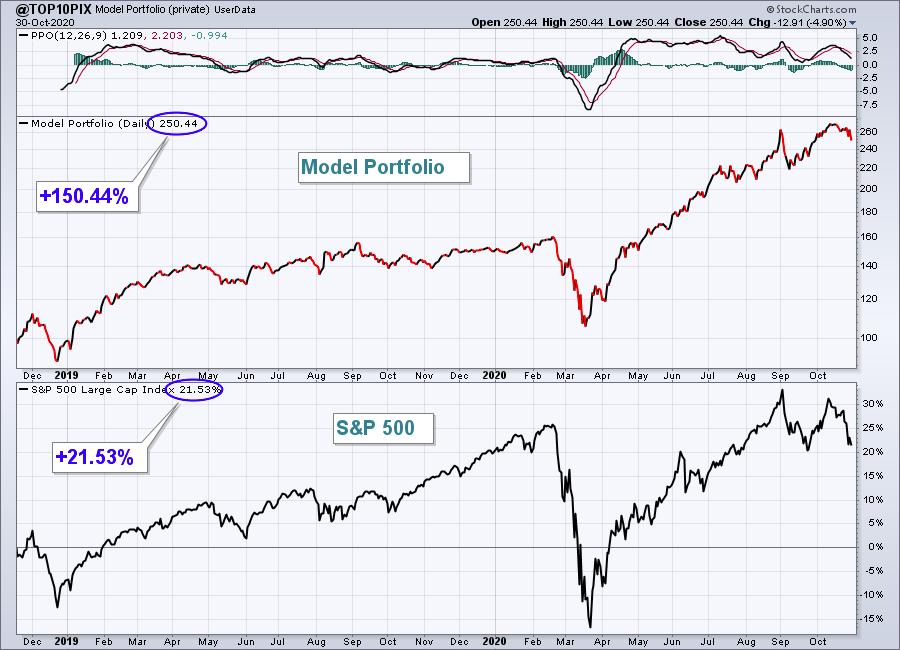
The Model portfolio tumbled 5.63%, effectively mirroring the benchmark last week. Here's the updated inception-to-date chart of the portfolio:
Here are how the Model portfolio component stocks performed last week:
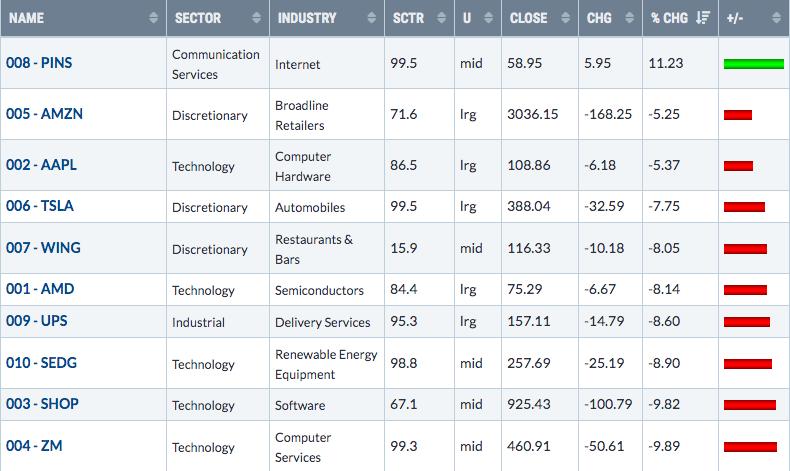
PINS' surge after earnings enabled the Model Portfolio, as a whole, to weather the market's selloff without any relative deterioration.
Aggressive Portfolio:
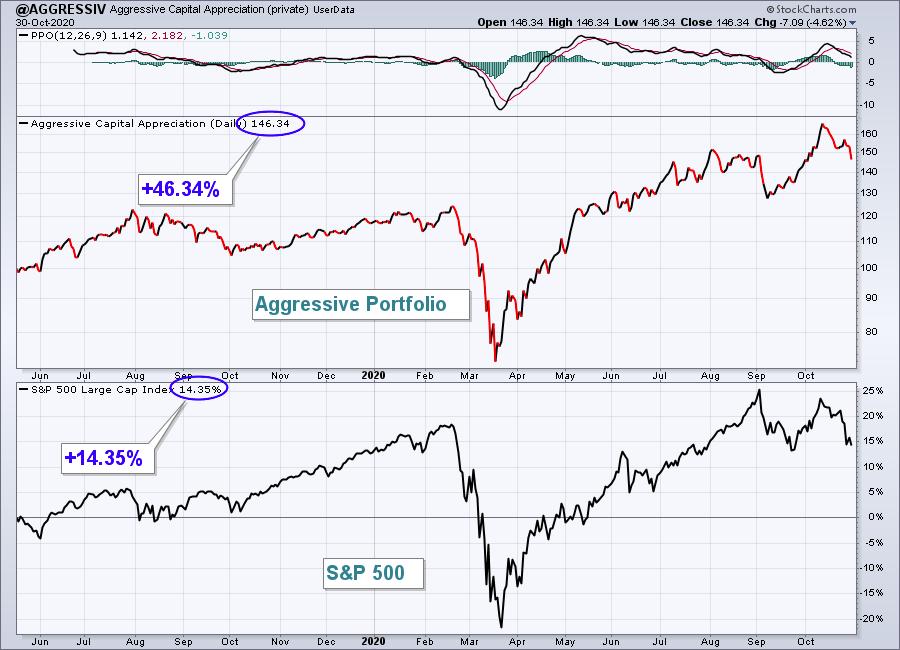
The Aggressive portfolio tumbled by 4.56%, but still managed to beat the S&P 500.
Here's the Aggressive portfolio chart since its inception on May 19, 2019:
Here are how the Aggressive portfolio component stocks performed last week:
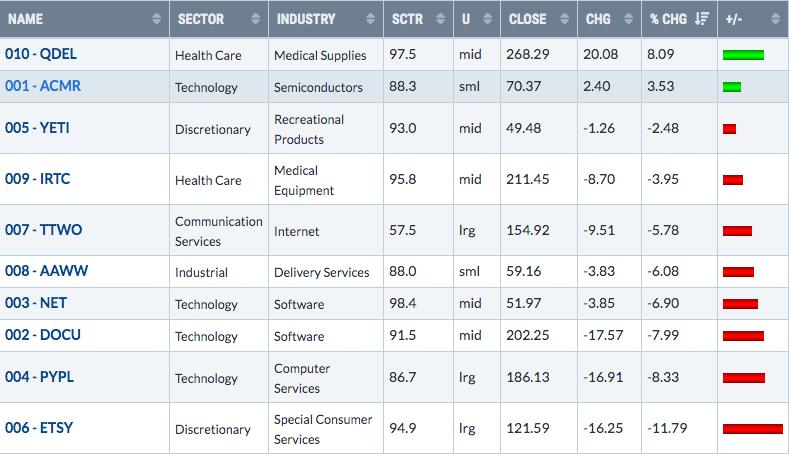
PYPL and NET were among the weakest Aggressive Portfolio stocks, but they'll have an opportunity to lead the portfolio this week as both report their quarterly results. ETSY fell nearly 12%, but that came after the company beat both quarterly revenue & EPS estimates. It's very important to keep everything in perspective. ETSY gained nearly 50% in a month before reporting those quarterly results. While the short-term may continue to be dicey for ETSY, I fully expect a rebound from either current price or at some point as it heads toward excellent support in the 105-110 area.
Income Portfolio:
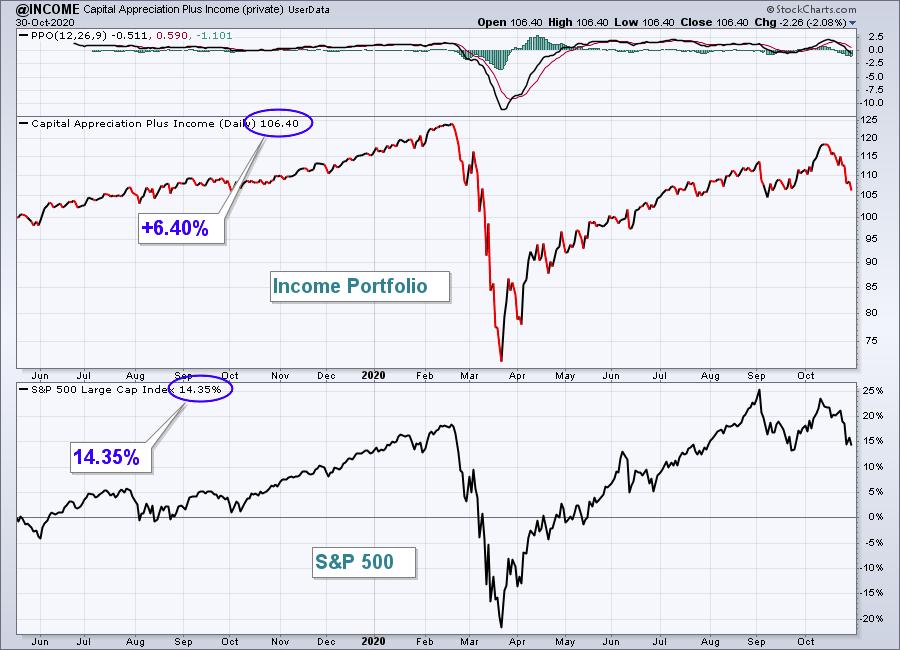
The Income portfolio dropped 7.04% last week, losing further ground to the S&P 500. Here's a look at the inception-to-date chart:
Here are how the Income portfolio component stocks performed last week:
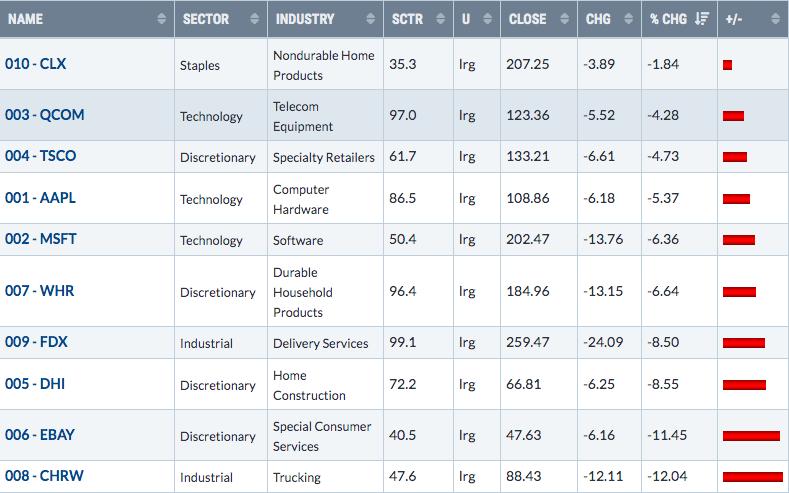
For me, the biggest disappointment in this earnings season thus far has been the adverse reaction to nearly every trucker's earnings report. CH Robinson Worldwide (CHRW), the worst performer in our Income Portfolio last week, was a leader in this space and they were not treated well after reporting revenues & EPS that easily exceeded forecasts. Perhaps it's just a "buy on rumor, sell on news" event, but the entire trucking group ($DJUSTK) did lose key 20 week EMA support on its longer-term chart last week. They've got work to do in order to right the technical ship.
Strong AD Portfolio:
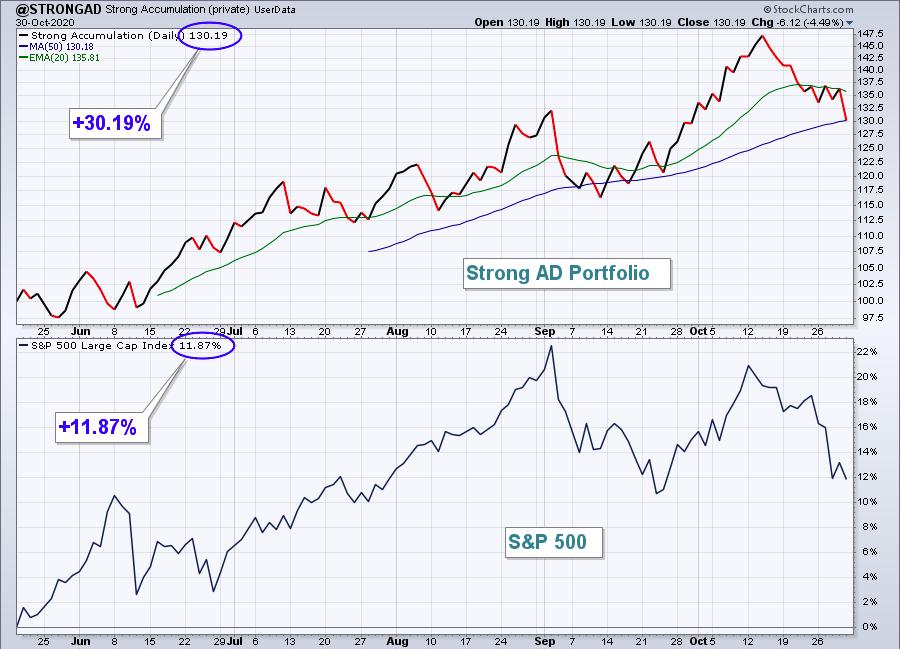
The Strong AD Portfolio had a rough week, falling 4.78%, but still outperforming the S&P 500. Here's a look at the inception-to-date chart:
Here are how the Strong AD portfolio component stocks performed last week:
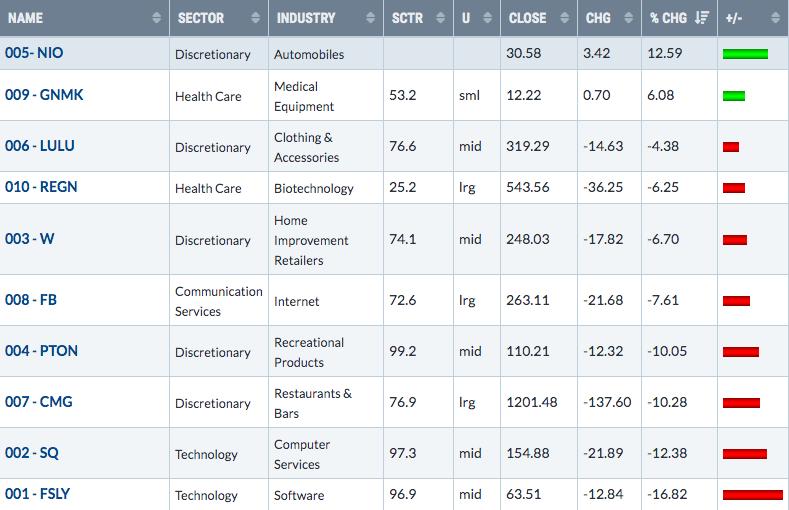
FSLY has definitely broken down technically, as we'll hope to simply recover a bit of recent losses as we head towards our November 19th "draft" of new portfolio stocks. PTON and SQ, two big losers from last week, will report their quarterly results this week. I expect both to deliver excellent reports, but it may depend on the market mood to see positive reactions.
Summary
15 our our portfolio stocks will be reporting earnings this week, including 9 on Thursday alone. When nearly 25% of your portfolio reports earnings on the same day, there's certainly the opportunity for fireworks and extreme volatility - and it can occur in either direction. I would expect that the market reaction will be all over the place, but I would hope that the majority see a positive reaction. I expect an overwhelming majority this week to report better-than-expected revenues and EPS.
One positive that will take place is that the uncertainty surrounding the U.S. election will be over. Yes, there's a chance the election results could be contested. I'm not sure how the market would react to that initially, but I believe any negative reaction would be short-lived.
The key this week will be the Volatility Index ($VIX). If we saw the top last week in the low-40s, then we've also likely seen the bottom in the S&P 500, which nearly touched the 3200-3225 area that I was watching closely. If, however, the VIX shoots to new highs AND the S&P 500 breaks below 3200, literally anything goes. I remain fully committed to my secular bull market theory, but panicked traders do things that are not rational. The problem is that missing the bottom by just a day or two can have severe financial consequences.
Model ETF Portfolio
We will likely issue a separate report on the Model ETF Portfolio either once or twice a month via our website, beginning later this year or to begin 2021. That's still under consideration. But we've now had this portfolio for two weeks and it's struggled a bit on a relative basis (vs. the S&P 500) as key concentration areas like online retail, transportation, home construction, and renewable energy have underperformed. I believe that will change and they'll be more positive on a forward-looking basis, but the impact last week was negative for sure. Here's how the Model ETF Portfolio component ETFs performed last week:
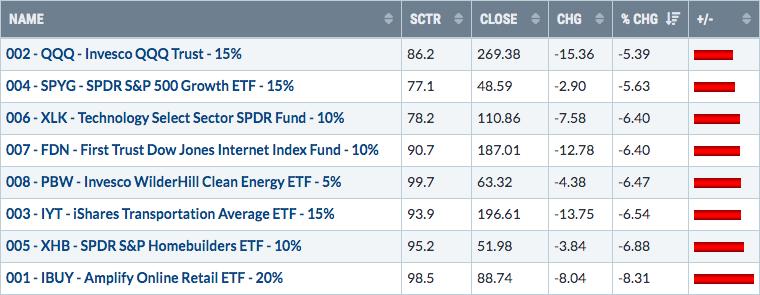
Our largest holding, IBUY at 20%, was the worst performer. IBUY lost 4.6% on Friday alone. A rebound in online retail this week would certainly help our performance here.
Since our "draft" on October 19th, our Model ETF Portfolio has fallen 6.29%, underperforming the S&P 500, which has lost 4.58% over the same period.
Happy trading!
Tom Bowley, Chief Market Strategist
EarningsBeats.com
"Better timing. Better trades."