
EB Weekly Portfolio Report - Sunday, November 15, 2020
Upcoming Earnings Reports
According to Zacks.com, the following companies will be reporting earnings this week and each is a component of one of our portfolios:
Monday, November 16: None
Tuesday, November 17: None
Wednesday, November 18: None
Thursday, November 19: None
Friday, November 20: None
PLEASE NOTE: The above companies were provided after scanning the Zacks Earnings Calendar. My research is limited to what Zacks provides and I also can make a mistake from time to time, so please check for earnings dates for all companies that you own. We do hold our portfolio stocks through one earnings report, but every EarningsBeats.com member must make their own investing/trading decisions about holding stocks into earnings reports as it's the most volatile (risky) time to own a stock.
Portfolio Rules and Objectives
Here are the common traits and objectives of our portfolios:
- There are 10 leading stocks from up to 10 leading industries in each portfolio (at the time of selection). Generally, there will only be one stock per industry group, but there could be exceptions.
- They are held for an entire 90 day period, with no stops in place. We strive for consistency, transparency, and simplicity in our portfolios. EB.com members may hold these stocks for the entire 90 days, trade them, use stops, etc., but for purposes of our calculation, we will make no exceptions to our "buy and hold for three months" strategy.
- Every stock will generally be held through ONE earnings report
- The expectation is that relative winners will carry the portfolio to outperformance
- They were all entered into as of the close on Wednesday, August 19th; members may choose to try to time better entries, but EB.com will "purchase" as of August 19th's closing price
- Primary objective is to outperform the benchmark S&P 500
Here are several considerations for EB members:
- I would expect the Strong AD and Aggressive portfolios to be the riskiest, followed by the Model portfolio, and then the Income portfolio
- The Strong AD portfolio will be selected from a combination of rising accumulation/distribution lines and SCTRs above 80 at the time of selection. It is the only portfolio that does NOT require a revenue and EPS beat in its most recent quarterly earnings report
- The Income portfolio stocks will all pay dividends, with the expected average dividend yield to be at least 1.5%
- Drawdowns (losses) should be much milder on the Income portfolio, with more volatility expected on the other three; please review inception-to-date charts below to gain an idea of the volatility associated with each
- I believe the larger drawdown on the Income portfolio at the beginning of the pandemic was an anomaly, occurring as many defensive, higher-yielding companies uncharacteristically underperformed during a market decline.
- You should own or trade these stocks in whatever manner is most comfortable for you; while we will buy all 10 stocks in the manner identified above, feel free to trade certain stocks or wait for pullbacks if the stocks are overbought
- We have no idea what risk each member is willing or able to take. We are not registered investment advisors so be sure you understand the risk you take. Please consult your financial advisor.
- EarningsBeats.com shareholders/employees may own all or some of the portfolio stocks from time to time.
Weekly Snapshot
Here's a weekly recap:
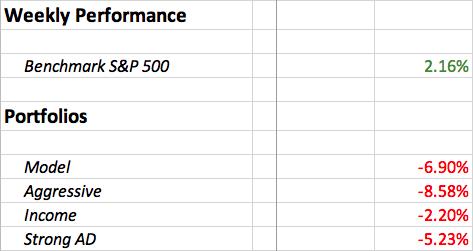
For the second time in three weeks, growth stocks were out of favor. The vaccine news on Monday morning before the opening bell caused major rotation in U.S. equities and our prior winners were negatively impacted, especially those with primarily an online presence. Much of the damage and relative underperformance above was inflicted on Monday. Many of these stocks staged rebounds Tuesday through Thursday, but rotation clearly favored value stocks again on Friday.
Weekly Summary
Benchmark S&P 500:
The good news is that the S&P 500 opened Monday at an all-time high and, after some selling during the middle part of the week, the bulls were back at it again and the S&P 500 finished Friday with its highest-ever daily close, clearing the prior all-time high close on September 2nd of 3580 by 5 points.
Model Portfolio:
The Model portfolio fell 6.90%, losing a lot of ground to the benchmark S&P 500. Here's the updated inception-to-date chart of the portfolio:
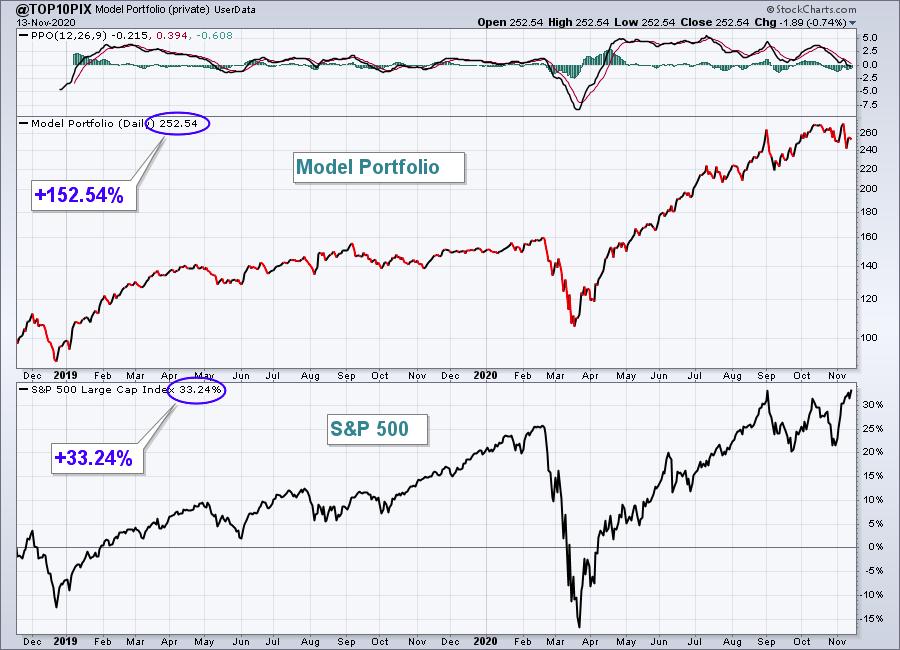
Here are how the Model portfolio component stocks performed last week:
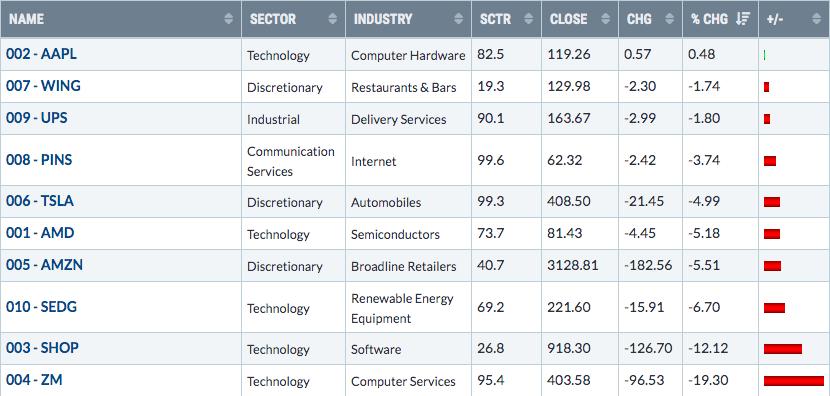
Both ZM and SHOP were hurt by the sudden unattractiveness of companies that thrive with online businesses. Without these two, it still would have been a down week, but the two big reasons for the massive underperformance last week were clearly ZM and SHOP. I suspect that both of these companies will be winners longer-term, but both have also made huge advances in 2020 and might require further consolidation. Here's the latest chart on SHOP that certainly shows the current consolidation range rather clearly:
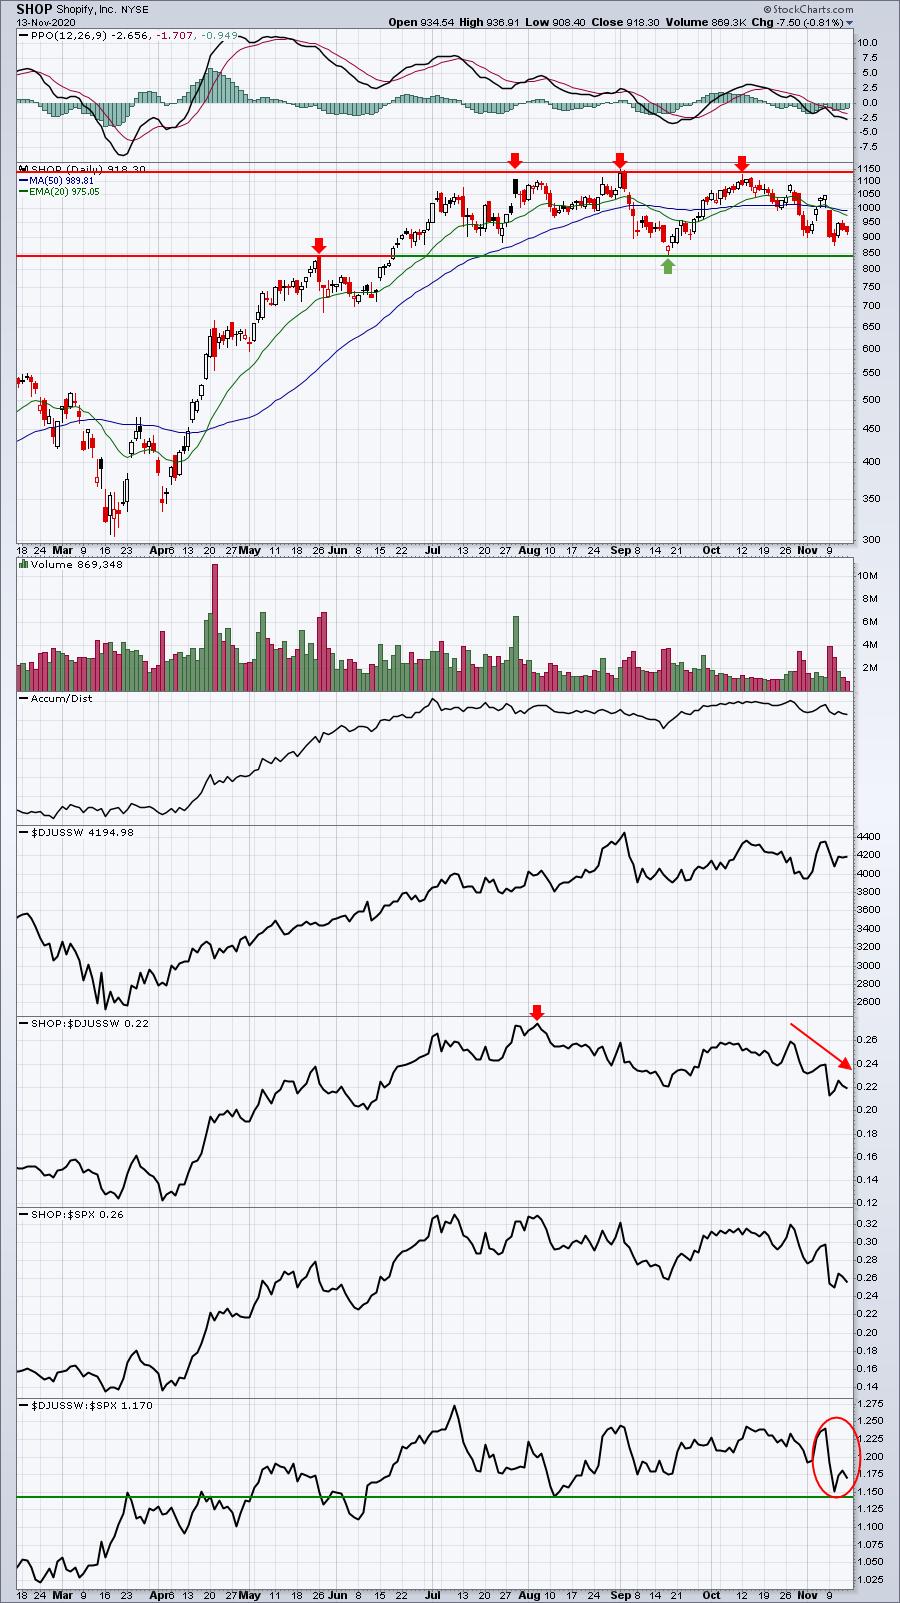
SHOP has seen its relative strength deteriorate somewhat, but that's quite normal during a period of price consolidation. SHOP actually remains one of my favorite software stocks, but you can see in the bottom panel above that software ($DJUSSW) nearly tested its August relative low vs. the S&P 500. I believe SHOP's weakness has more to do with its group than it does with its own price action. Just my opinion.
Aggressive Portfolio:
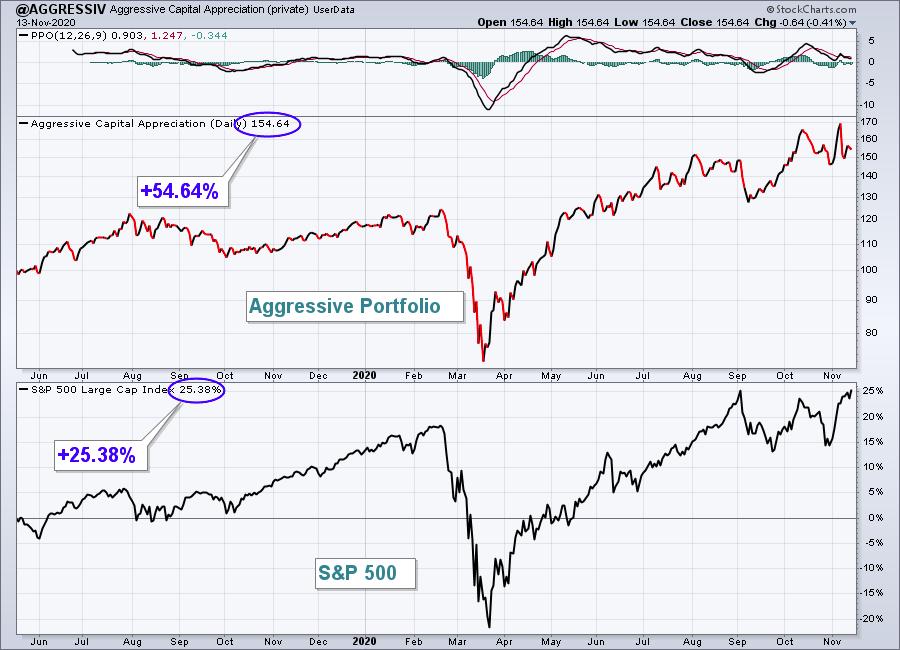
The Aggressive portfolio tumbled 8.58% last week, losing more than 10 relative percentage points to the S&P 500.
Here's the Aggressive portfolio chart since its inception on May 19, 2019:
Here are how the Aggressive portfolio component stocks performed last week:
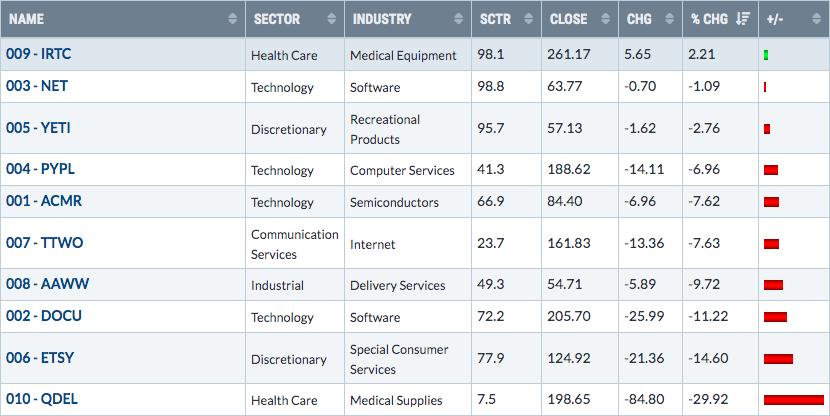
For the second time this quarter, the Aggressive Portfolio has been hurt by a big drop in Quidel (QDEL):
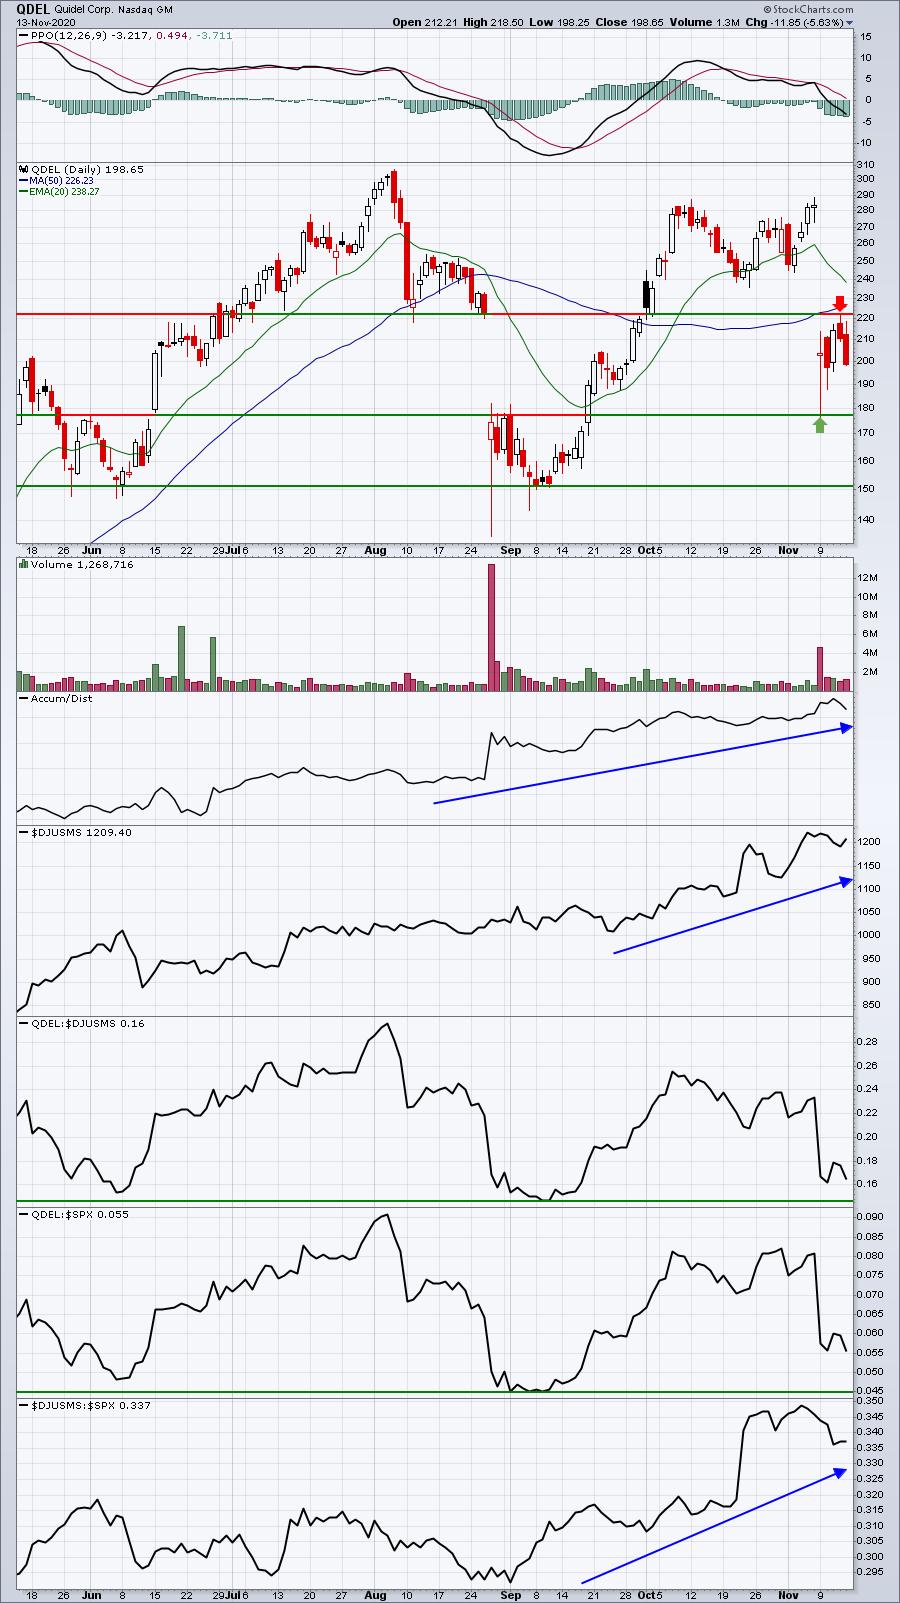
The volatility here has been extreme and it may continue right up until the end of this quarter's portfolio performance ends on Thursday, November 19th. The short-term support and resistance seem to be from 177-222 with Friday's close of 198.65 falling almost squarely in the middle. A move higher toward the top of the range would obviously be best for our portfolio performance. The one silver lining with QDEL has been its AD line, which has been trending higher throughout the quarter. So perhaps short-term weakness is being used by institutions to accumulate.
Income Portfolio:
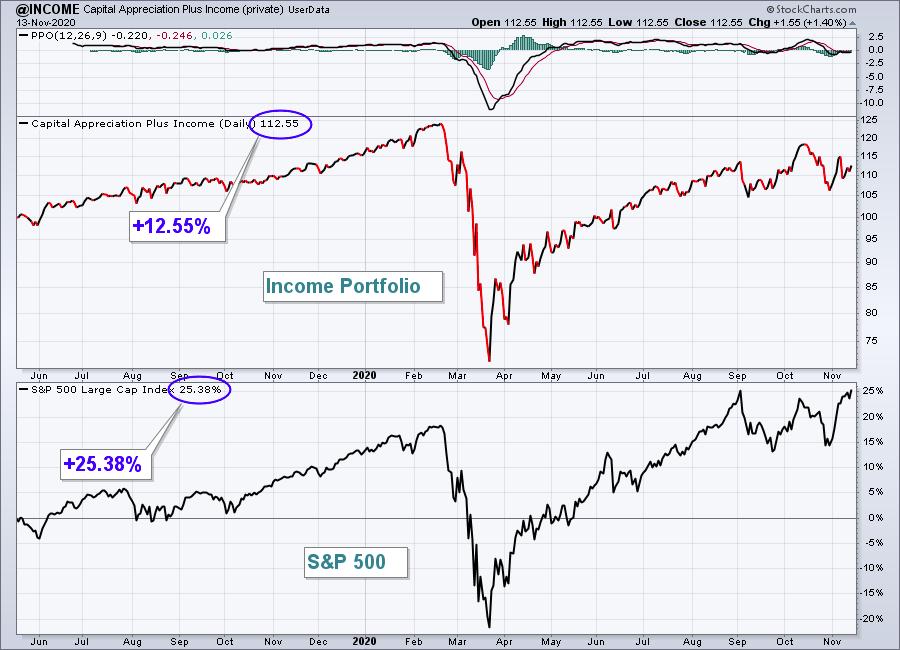
The Income portfolio lost 2.20% last week and is now trailing the benchmark S&P 500 by double digits since its inception. Here's a look at the inception-to-date chart:
Here are how the Income portfolio component stocks performed last week:
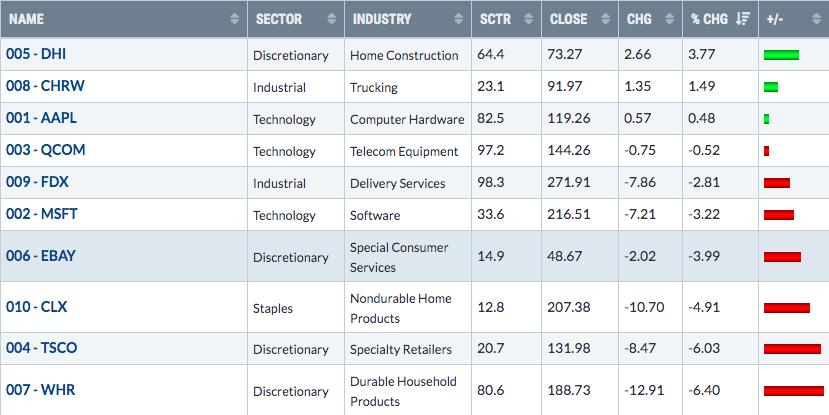
DHI helped to limit the losses in the Income Portfolio as it managed to bounce back from what appeared to be a topping head & shoulders breakdown:
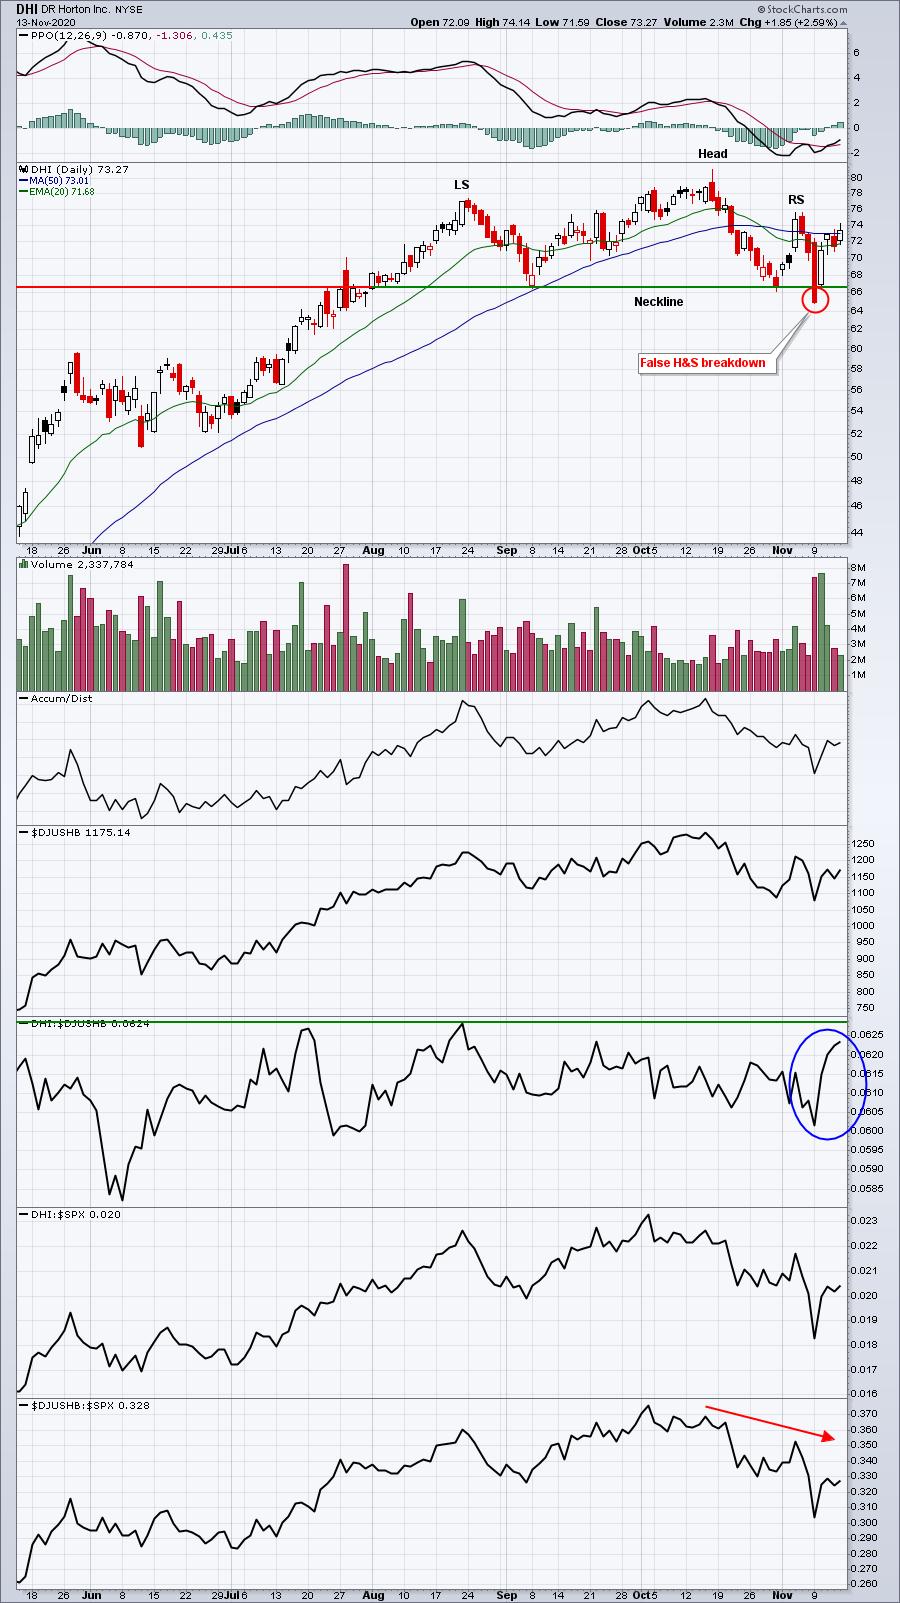
There's still plenty to worry about here, though. The 10-year treasury yield has been on the rise, which tends to negatively impact homebuilders. Since early-October, the Dow Jones U.S. Home Construction Index ($DJUSHB) has been downtrending relative to the S&P 500 so its prior relative strength has come under pressure. One positive for DHI is its recent surge in relative strength vs. its homebuilding peers. A breakout to a new 52-week relative high there would be bullish.
Strong AD Portfolio:
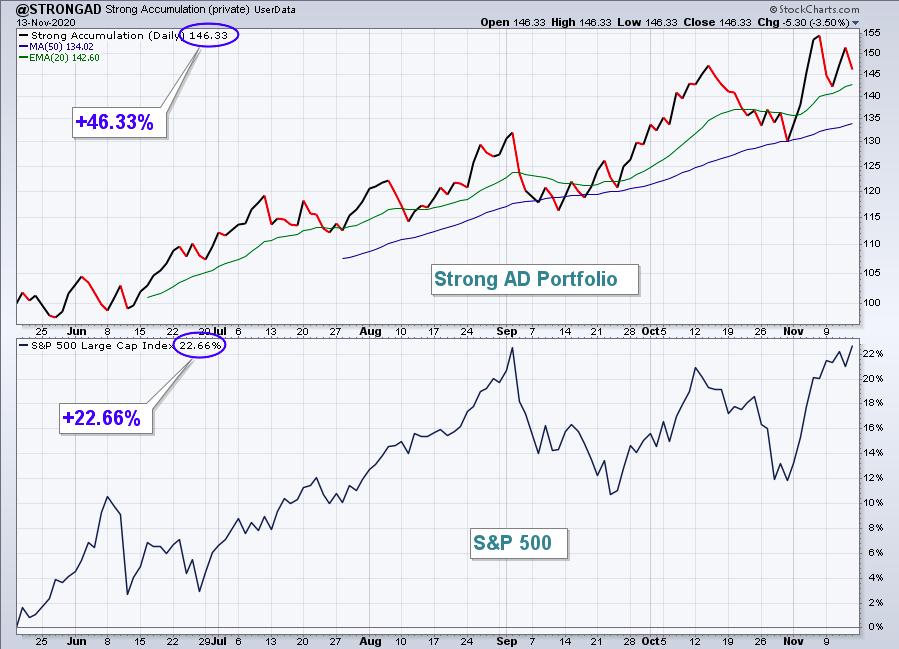
The Strong AD Portfolio dropped 5.23%, also giving up a chunk of its quarterly outperformance vs. the benchmark. Here's a look at the inception-to-date chart:
Here are how the Strong AD portfolio component stocks performed last week:
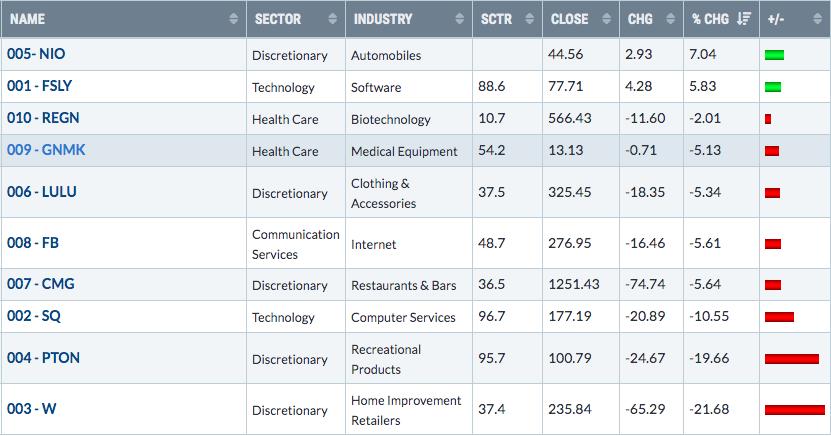
Wayfair (W) and Peloton (PTON) were among the online company casualties from last week. This segment of the stock market was punished after months of astonishing gains. W, in particular, is testing key price support:
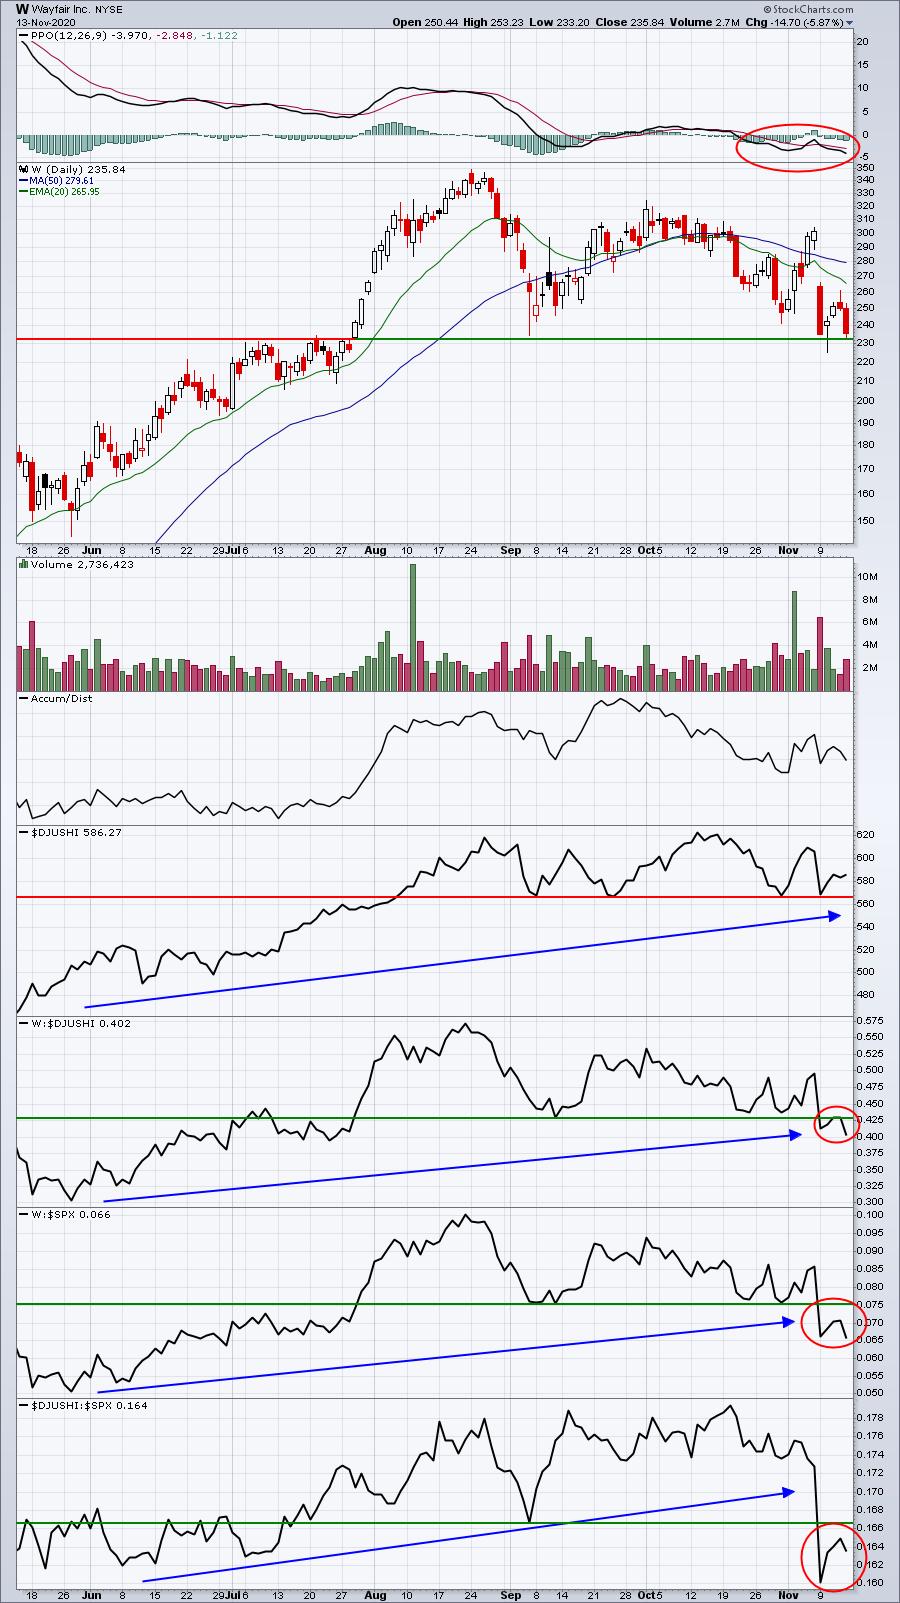
The red circles are providing the warning signs. W has poor momentum (PPO below zero) and its relative strength has fallen apart. The two hopeful signs are (1) a home improvement group that so far is holding key price support near 565 and (2) W thus far holding closing support just above the 230 level.
Summary
We've benefited from positive market rotation for the better part of 9 months. Since early September, stock market winds have shifted and previously unloved stocks are now becoming more attractive to Wall Street. My Pandemic Index (User-Defined Index that I created at StockCharts.com to track the worst performing industry groups throughout the pandemic) shows how recent market rotation is beginning to show Wall Street's appetite for weaker groups:
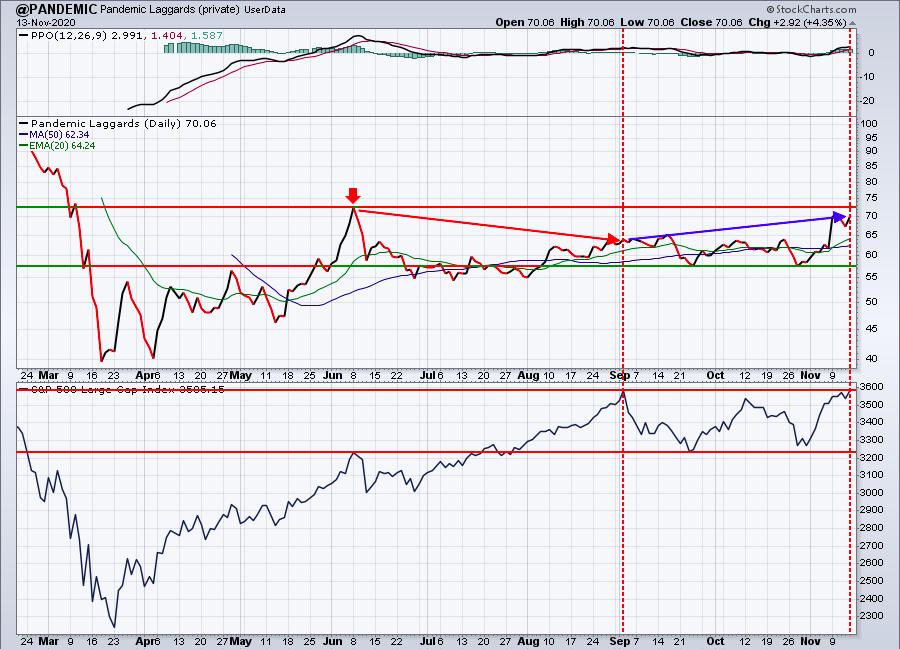
The last time Wall Street bid these shares considerably higher was early June. From that peak through the S&P 500's early-September all-time high close, the Pandemic Index fell. But during the S&P 500's consolidation the past 10 weeks, the Pandemic Index has been rising. That's telling us that rotation is taking place. The only thing missing is a breakout in the Pandemic Index above the June high. That could easily happen this week if the bullish action on Wall Street continues.
Be sure to join me on Monday after the closing bell for a special rotation webinar that will begin at 4:30pm ET. I'll provide everyone a room link in Monday's Daily Market Report (DMR).
Model ETF Portfolio
Our Model ETF Portfolio was not immune to the rotation from last week. Because ETFs are more diversified, we were able to avoid the major carnage seen in our four portfolios, but we still underperformed.
Here's how the Model ETF Portfolio component ETFs performed last week:
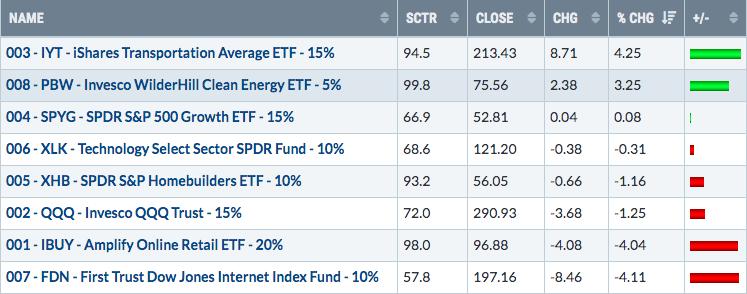
Transports benefited from the rotation, while the online retail and internet areas of our portfolio struggled. Overall, the Model ETF Portfolio lost 0.78% last week and its quarter-to-date performance (since October 19th) fell to +1.98%, trailing the benchmark's S&P 500's return of +4.62% over the same period.
Happy trading!
Tom Bowley, Chief Market Strategist
EarningsBeats.com
"Better timing. Better trades."