
EB Weekly Portfolio Report - Sunday, November 29, 2020
Upcoming Earnings Reports
According to Zacks.com, the following companies will be reporting earnings this week and each is a component of one of our portfolios:
Monday, November 30: ZM
Tuesday, December 1: None
Wednesday, December 2: None
Thursday, December 3: None
Friday, December 4: None
PLEASE NOTE: The above companies were provided after scanning the Zacks Earnings Calendar. My research is limited to what Zacks provides and I also can make a mistake from time to time, so please check for earnings dates for all companies that you own. We do hold our portfolio stocks through one earnings report, but every EarningsBeats.com member must make their own investing/trading decisions about holding stocks into earnings reports as it's the most volatile (risky) time to own a stock.
Portfolio Rules and Objectives
Here are the common traits and objectives of our portfolios:
- There are 10 leading stocks from up to 10 leading industries in each portfolio (at the time of selection). Generally, there will only be one stock per industry group, but there could be exceptions.
- They are held for an entire 90 day period, with no stops in place. We strive for consistency, transparency, and simplicity in our portfolios. EB.com members may hold these stocks for the entire 90 days, trade them, use stops, etc., but for purposes of our calculation, we will make no exceptions to our "buy and hold for three months" strategy.
- Every stock will generally be held through ONE earnings report
- The expectation is that relative winners will carry the portfolio to outperformance
- They were all entered into as of the close on Thursday, November 19th; members may choose to try to time better entries, but EB.com "purchased" as of November 19th's closing price
- Primary objective is to outperform the benchmark S&P 500
Here are several considerations for EB members:
- I would expect the Strong AD and Aggressive portfolios to be the riskiest, followed by the Model portfolio, and then the Income portfolio
- The Strong AD portfolio will be selected from a combination of rising accumulation/distribution lines and SCTRs above 80 at the time of selection. It is the only portfolio that does NOT require a revenue and EPS beat in its most recent quarterly earnings report
- The Income portfolio stocks will all pay dividends, with the expected average dividend yield to be at least 1.0%
- Drawdowns (losses) should be much milder on the Income portfolio, with more volatility expected on the other three; please review inception-to-date charts below to gain an idea of the volatility associated with each
- I believe the larger drawdown on the Income portfolio at the beginning of the pandemic was an anomaly, occurring as many defensive, higher-yielding companies uncharacteristically underperformed during a market decline.
- You should own or trade these stocks in whatever manner is most comfortable for you; while we will buy all 10 stocks in the manner identified above, feel free to trade certain stocks or wait for pullbacks if the stocks are overbought
- We have no idea what risk each member is willing or able to take. We are not registered investment advisors so be sure you understand the risk you take. Please consult your financial advisor.
- EarningsBeats.com shareholders/employees may own all or some of the portfolio stocks from time to time.
Weekly Snapshot
Here's a weekly recap:
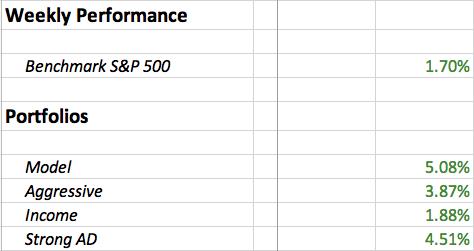
Weekly Summary
Benchmark S&P 500:
The S&P 500 gained ground 3 of 4 trading days last week and is clearly trending above its 20 day EMA:
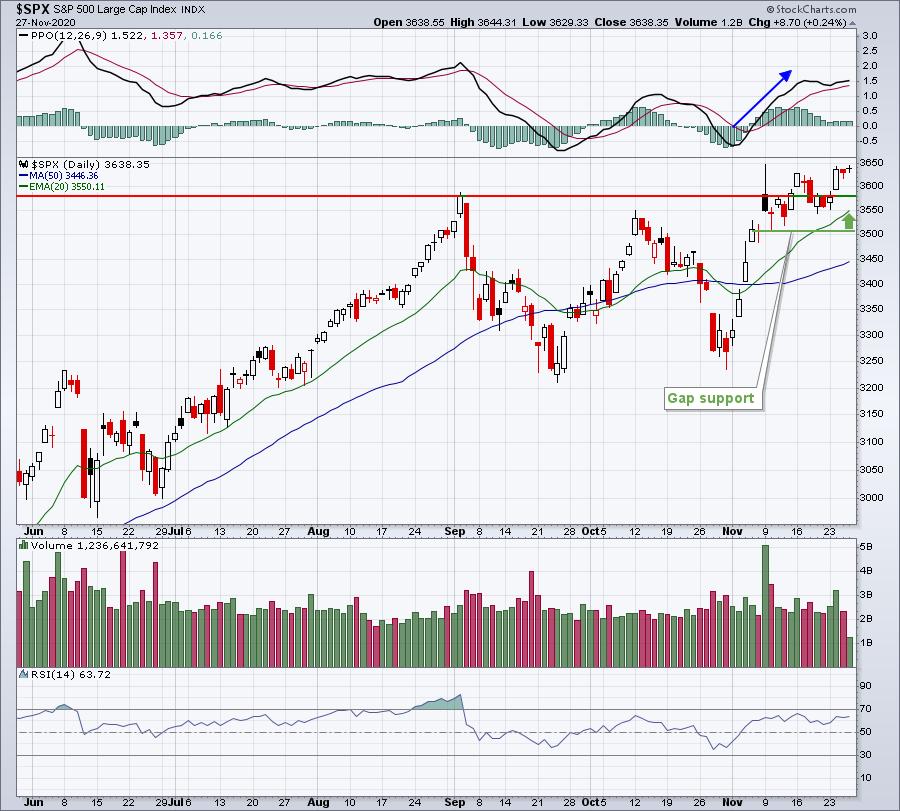
This is a reprint of the S&P 500 daily chart that I included last week. Gap support has held thus far, and price action remains above the rising 20 day EMA. PPO is strong and the RSI is only at 63, so it's not even overbought yet. I'd be surprised to see much selling in the week ahead based on the current look of the chart. As the RSI moves closer to 70, we'll want to watch the 60 minute chart for any negative divergences to emerge. Otherwise, look for higher prices.
Model Portfolio:
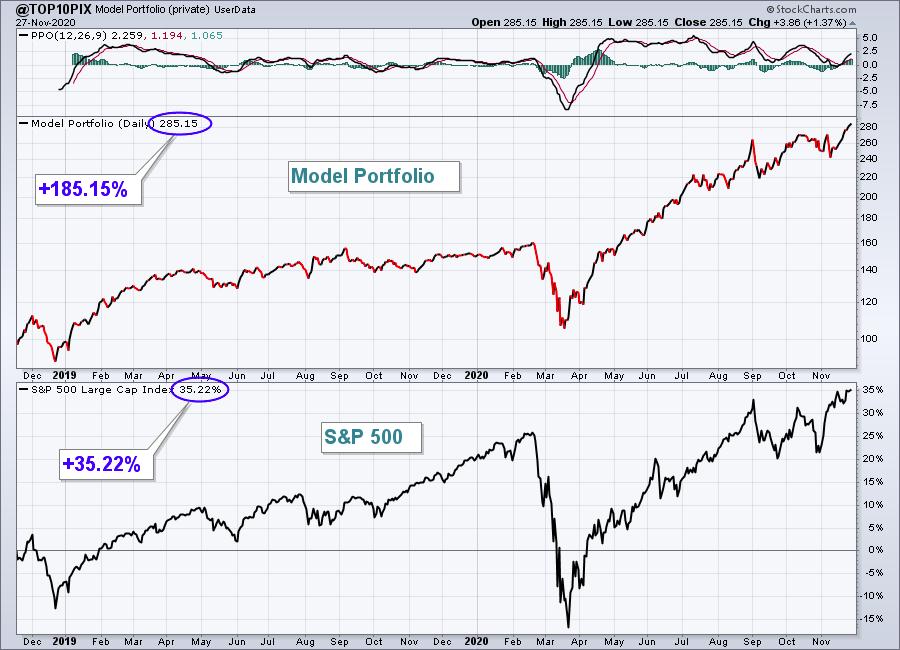
The Model Portfolio surged 5.08%, crushing the benchmark S&P 500. Here's the updated inception-to-date chart of the portfolio:
Here are how the Model portfolio component stocks performed last week:
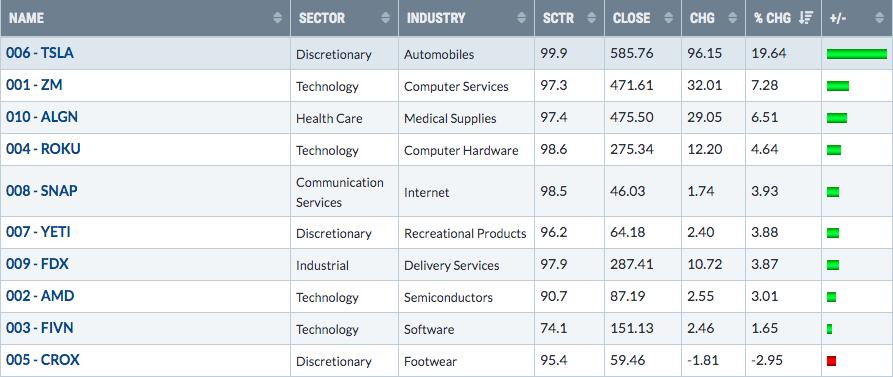
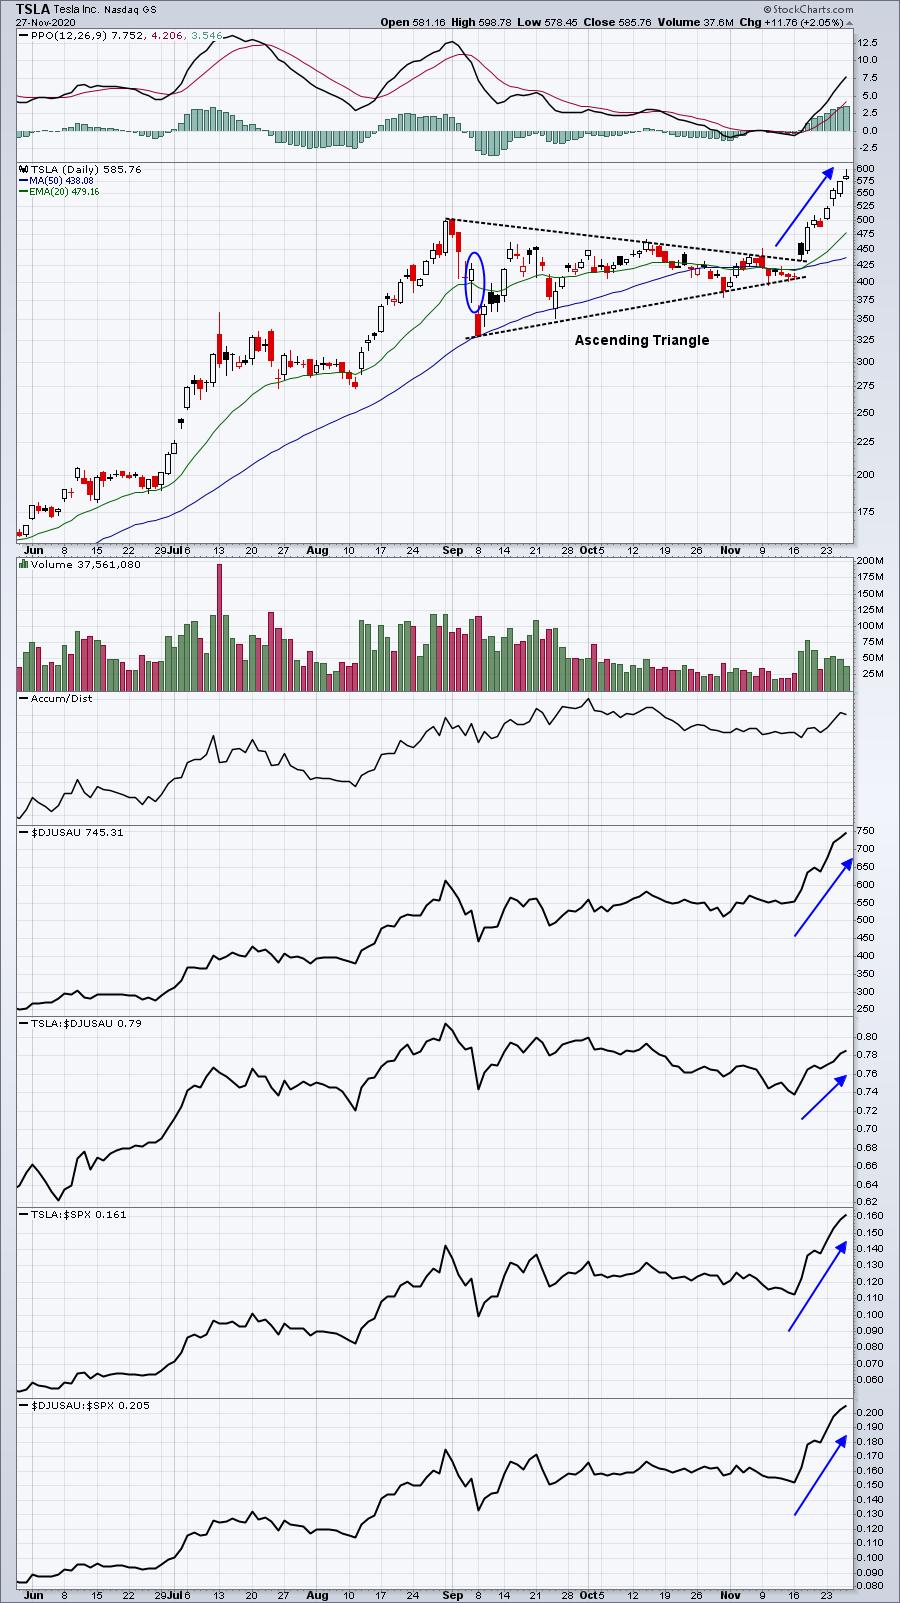
It was another record-breaking week for our Model Portfolio. It's now up 185% in just over 2 years. We're closing in on a triple. Leading the charge last week was Tesla (TSLA), which has had just one down day since it was announced they were being added to the S&P 500:
ZM's strength last week enabled it to climb back above its 20 day EMA. That could be a signal of renewed strength and the start of another uptrend. However, loss of the 20 day EMA again would suggest further consolidation ahead:
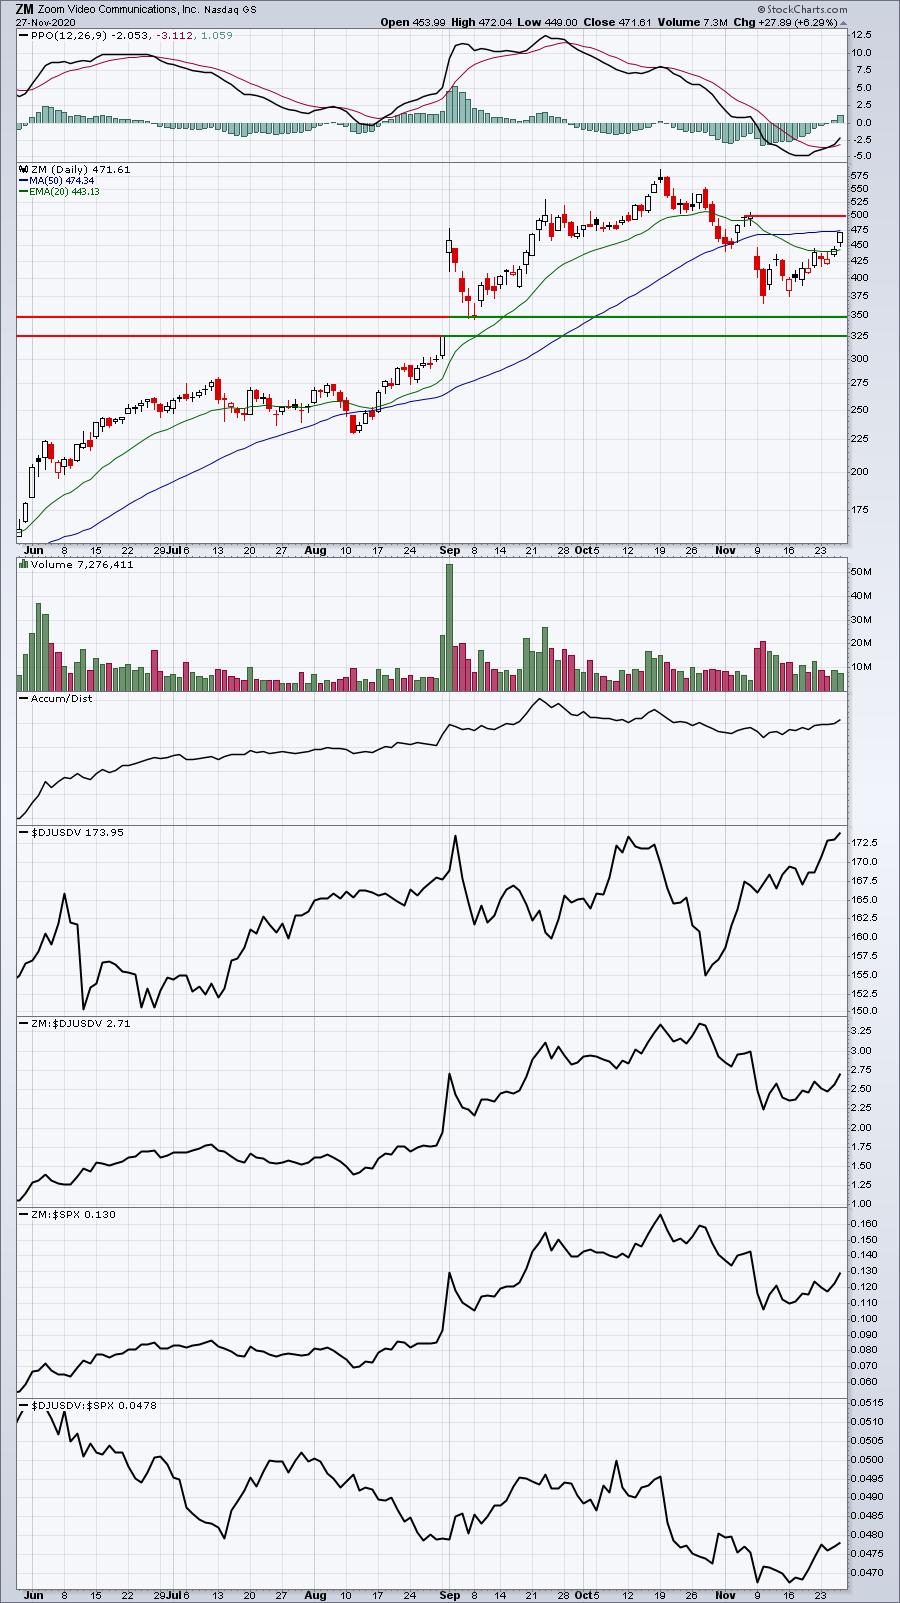
Gap resistance at 500.11 will be worth watching. Perhaps the bigger issue for ZM will be its quarterly earnings report, which will be released on Monday after the market closes.
Aggressive Portfolio:
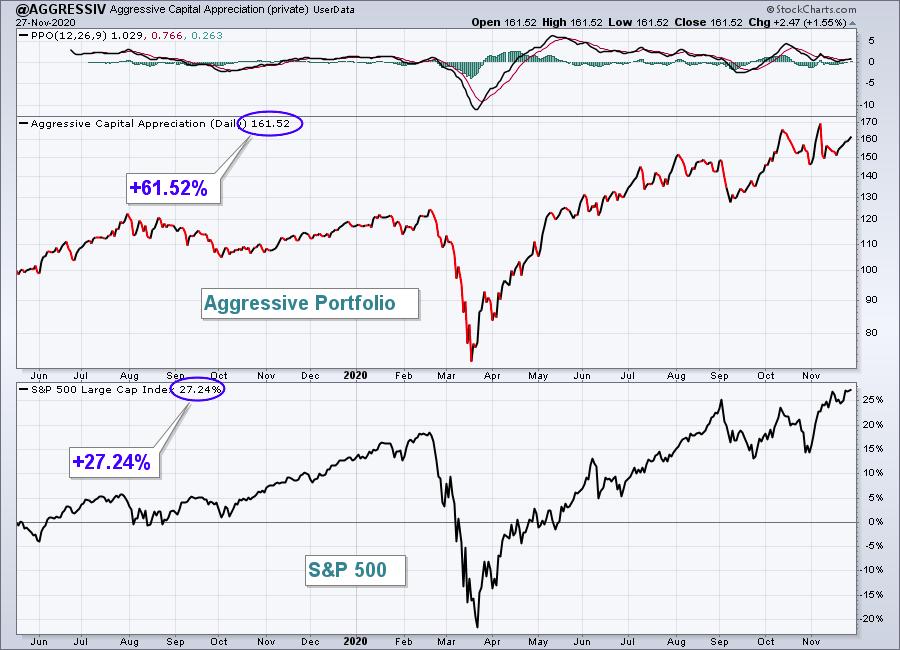
The Aggressive portfolio gained 3.87% last week, distancing itself further from the S&P 500. Here's the updated inception-to-date chart of the portfolio:
Here are how the Aggressive portfolio component stocks performed last week:
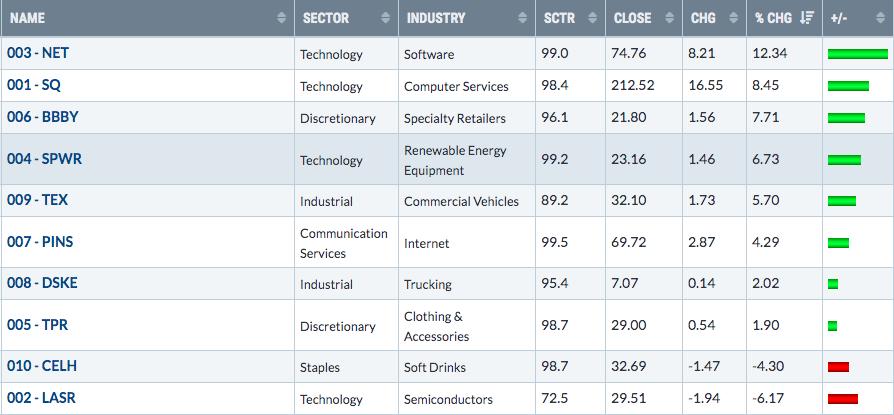
8 of the 10 component stocks gained, led by NET:
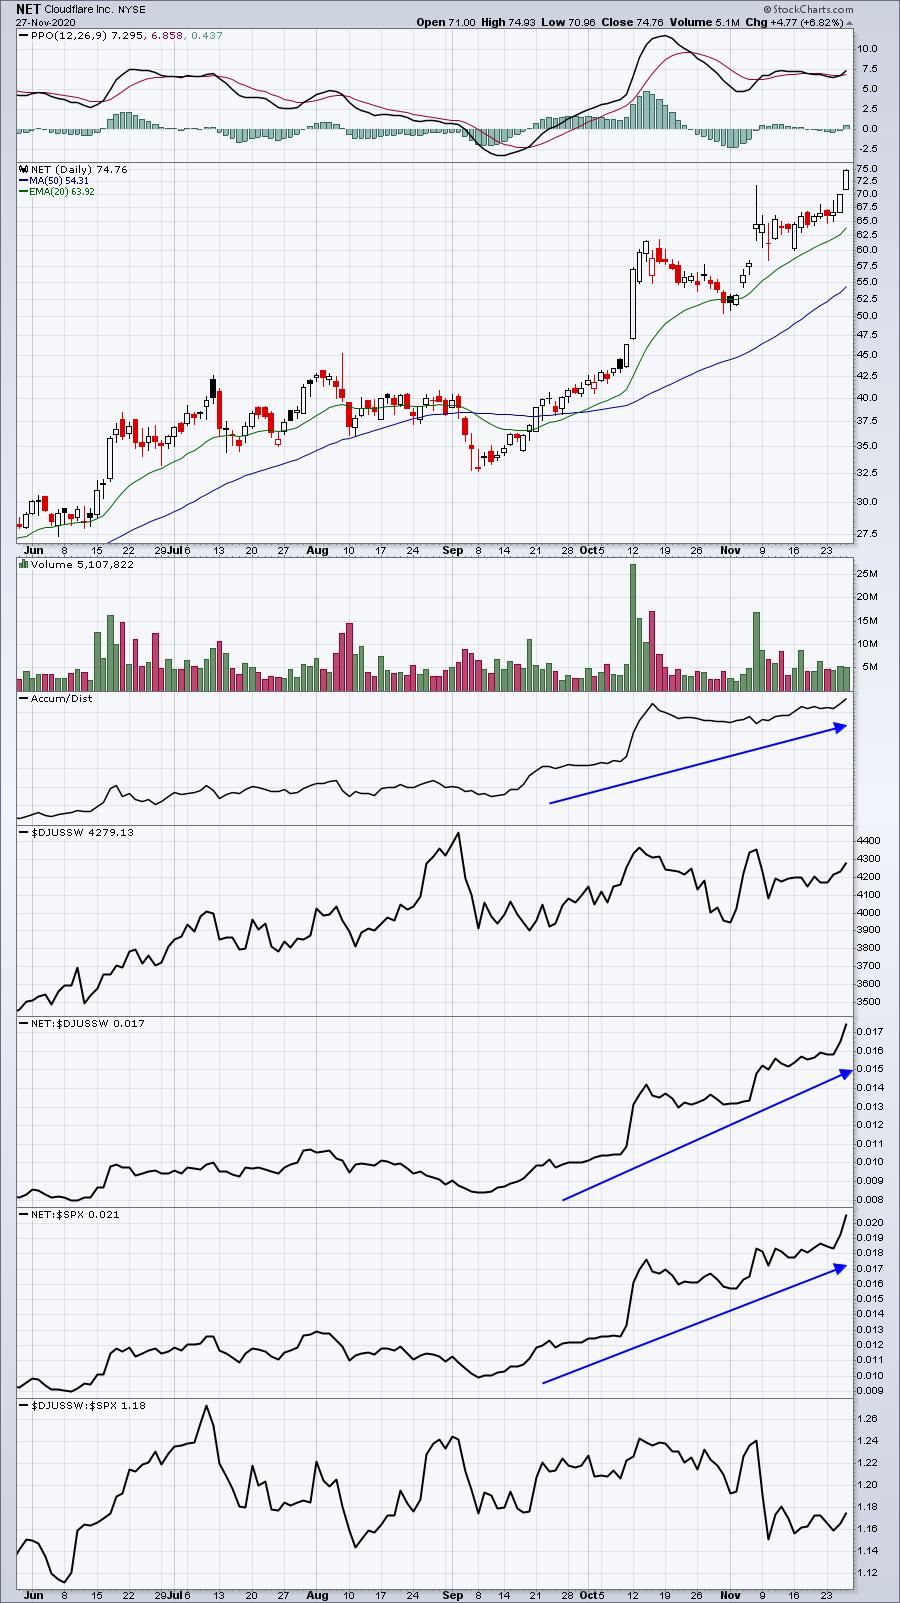
NET is arguing that it's one of the best stocks in the universe and I'd be hard-pressed to disagree. Its tremendous performance is occurring while its industry group - software ($DJUSSW) - languishes near a 5-month relative low.
Income Portfolio:
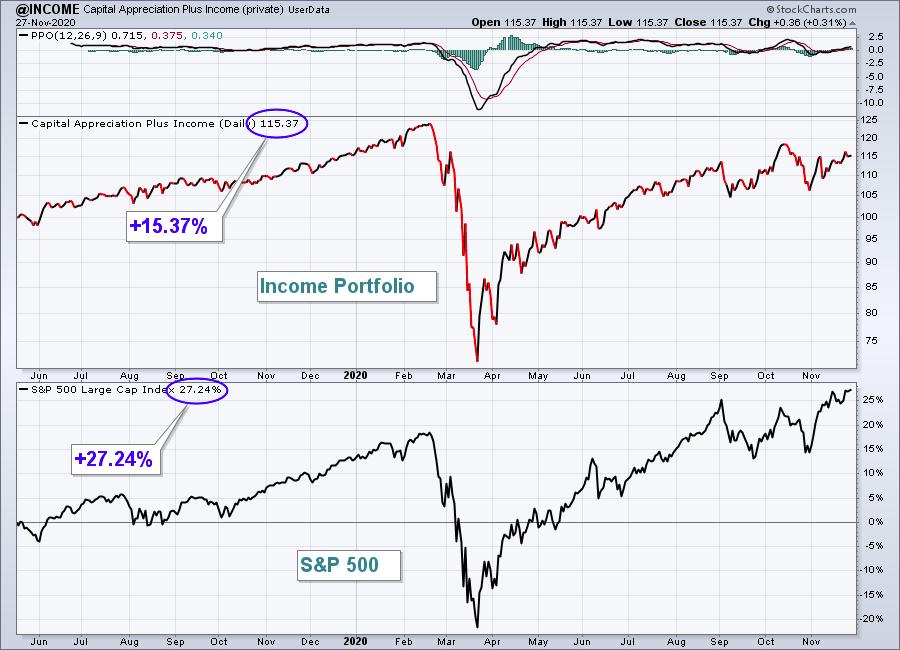
The Income portfolio advanced 1.88% last week, narrowly beating the S&P 500. Here's the updated inception-to-date chart of the portfolio:
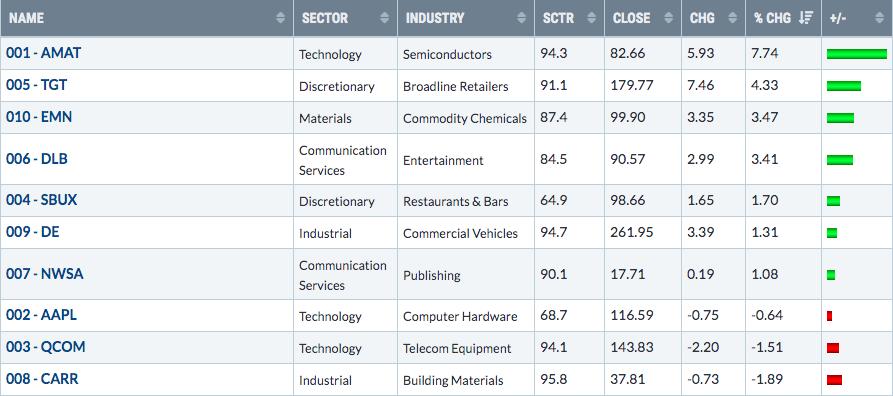
Here are how the Income portfolio component stocks performed last week:
AMAT was a bit of a flyer this quarter as it really didn't begin to show relative strength vs. its semiconductor peers ($DJUSSW) until its latest rally began to unfold in late October. That proved to be a strong signal, however:
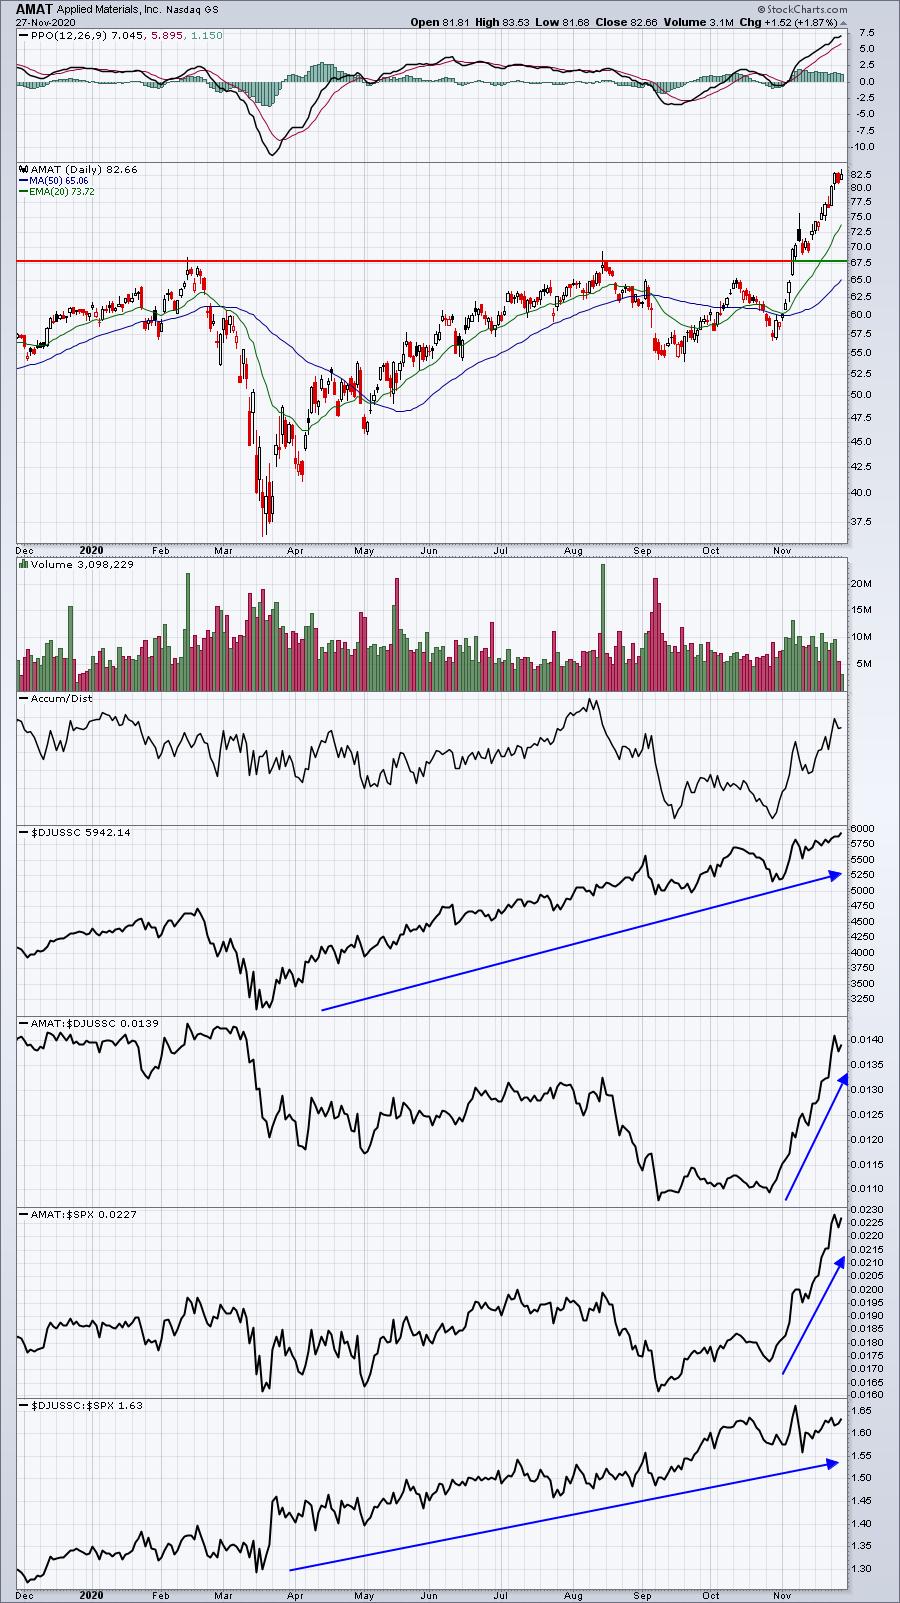
Semiconductors have been one of the most consistently strong industries of 2020 and AMAT is now displaying tremendous relative strength vs. the group.
Strong AD Portfolio:
The Strong AD Portfolio rose 4.51%, adding to its relative outperformance vs. the S&P 500. Here's the updated inception-to-date chart of the portfolio:
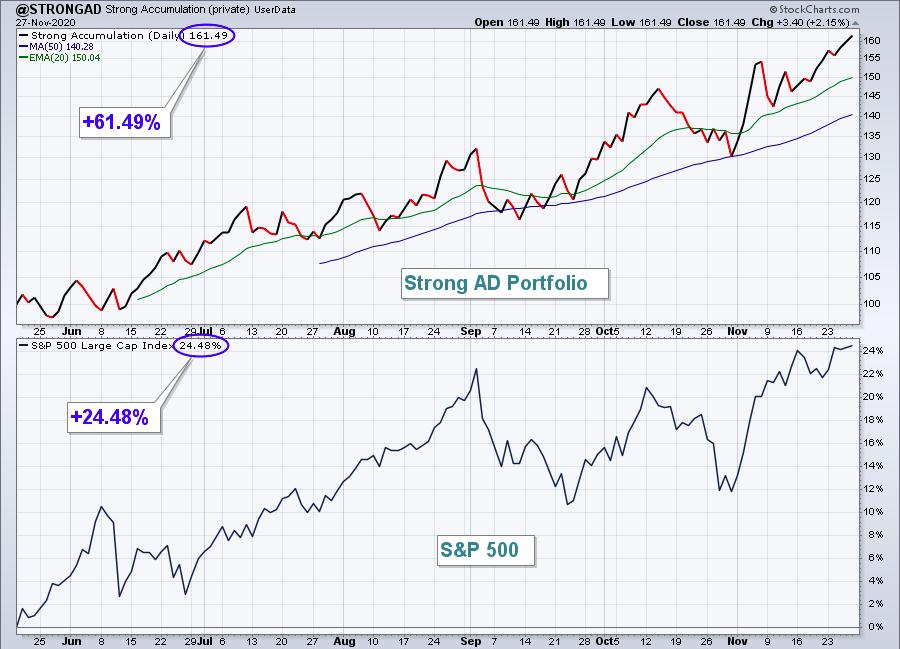
Here are how the Strong AD portfolio component stocks performed last week:
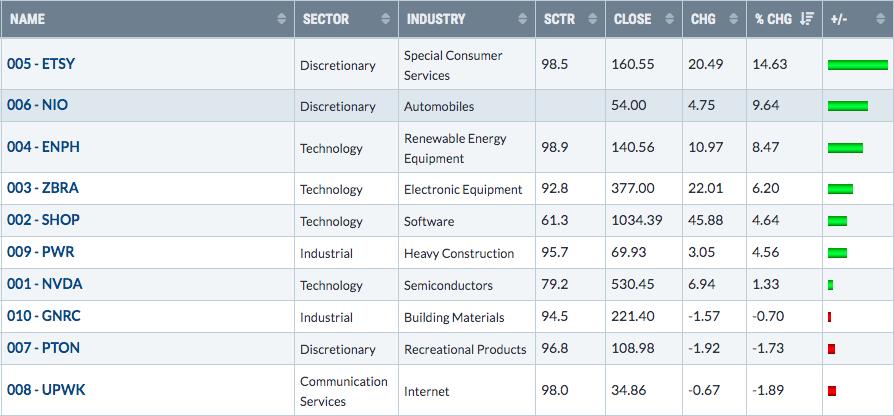
It's been a very solid start to this quarter for the Strong AD Portfolio and ETSY and NIO are the two biggest reasons. The former has surged and broken to yet another all-time high, a promising development:
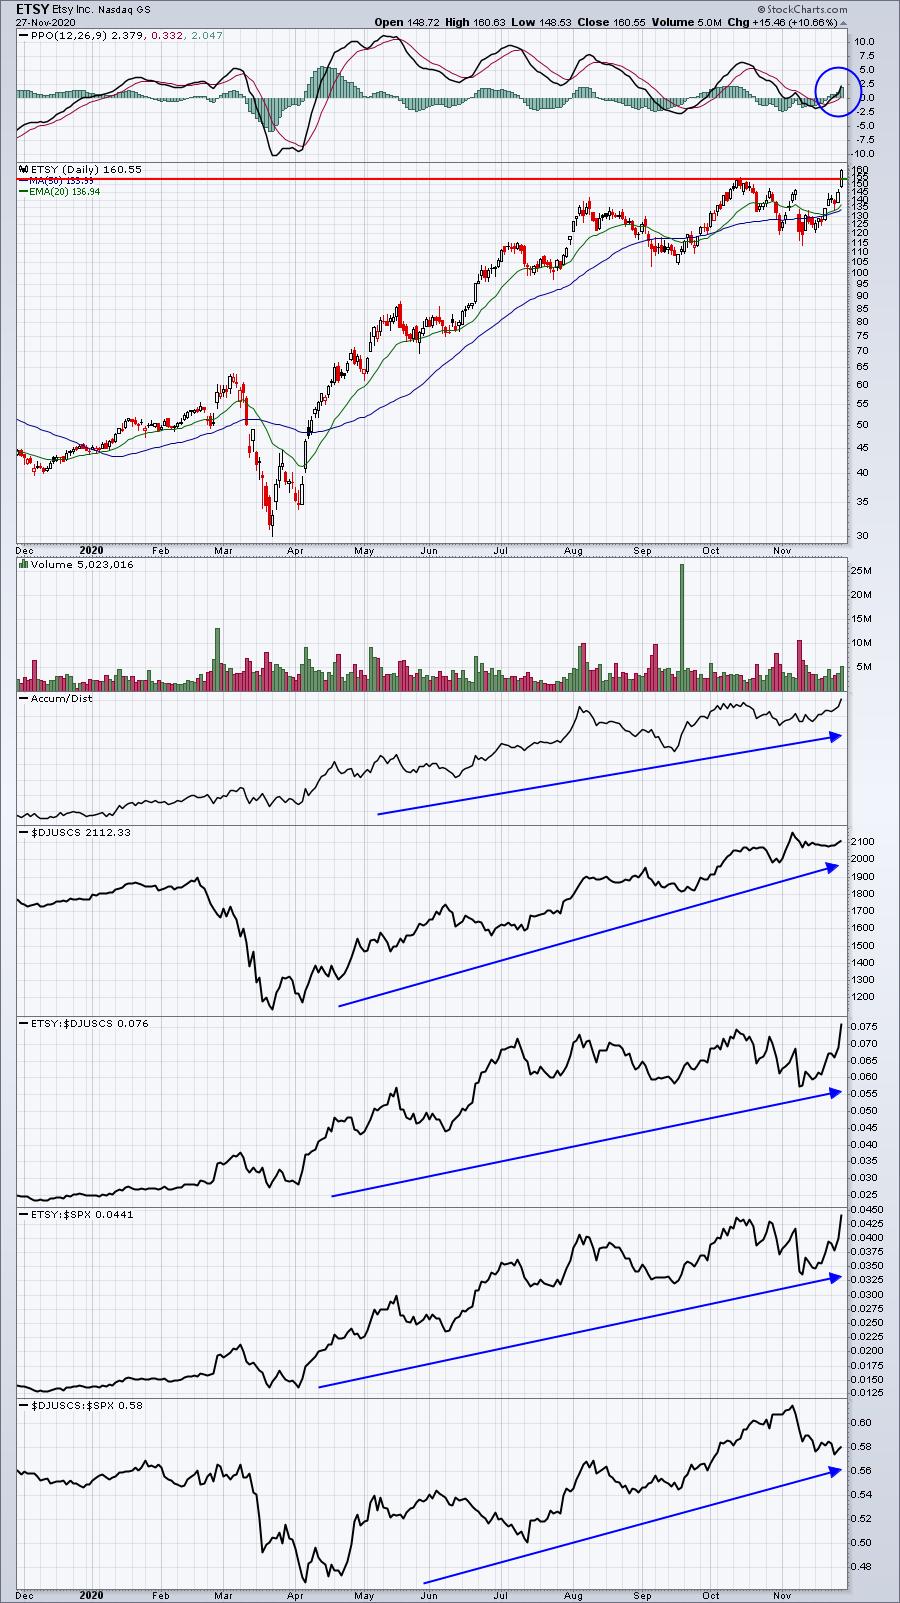
ETSY's peer group has actually been consolidating in November, so its current leadership is off-the-charts, no pun intended.
Summary
We remain in the midst of a very strong historical period, the one I pointed out at the end of October. This period runs through January 18th, so there's still another several weeks to go before the historical tides slow down. The beauty of our current advance is that just about every corner of the market is participating. Small caps ($SML) have exploded vs. the benchmark S&P 500, easily surpassing the relative high in June:
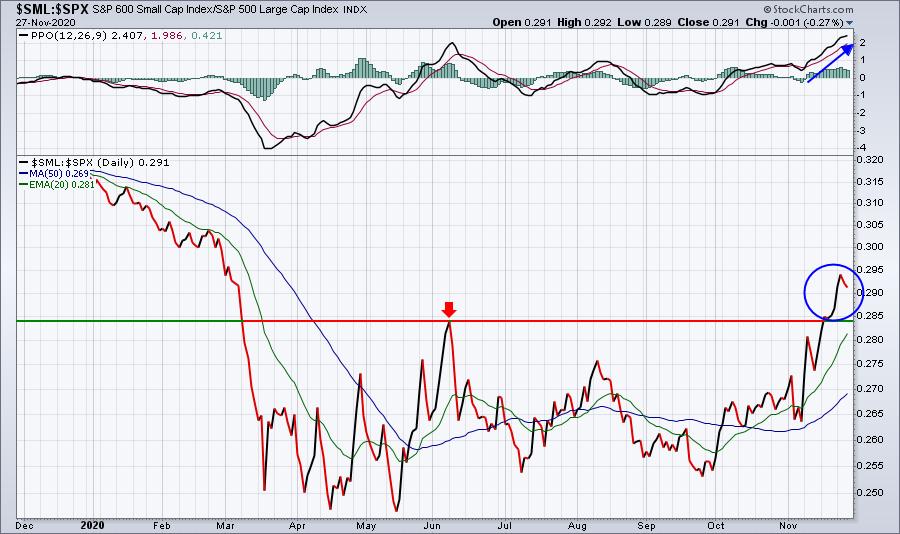
Throw in the global bull market rally and it's difficult for me to imagine weakness ahead.
Model ETF Portfolio
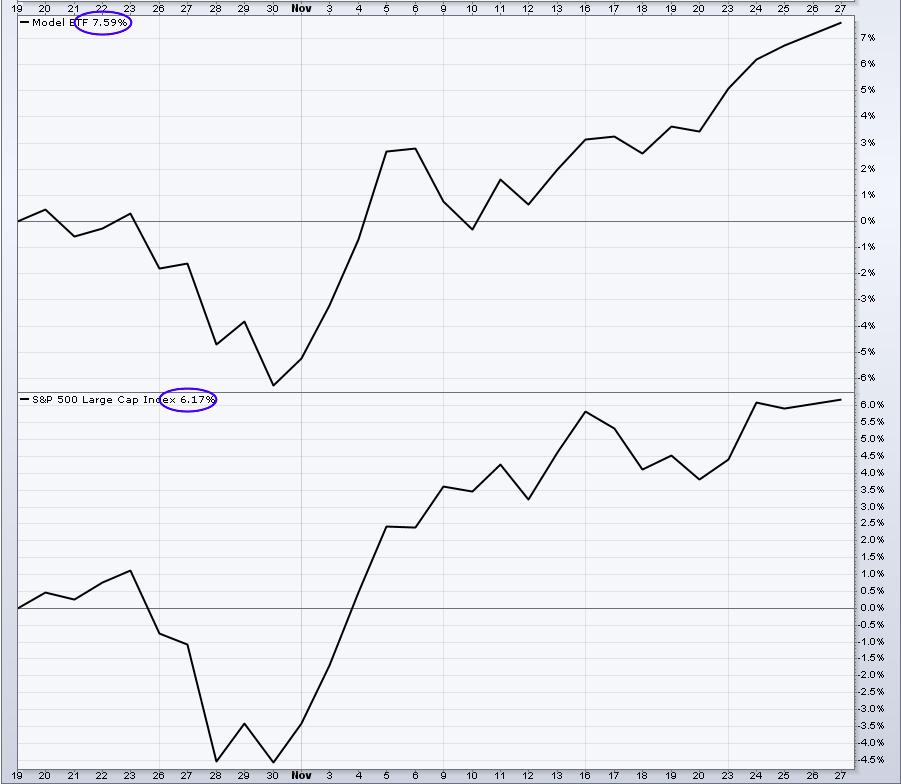
Our Model ETF Portfolio caught fire last week and surged past the benchmark S&P 500. The following is an inception-to-date chart of this portfolio with a comparative chart of the S&P 500 in the panel below:
The smallest component ETF (5%) for us is Invesco WilderHill Clean Energy ETF (PBW), but wow has it packed a punch thus far! After the late-October pullback, PBW has been on fire:
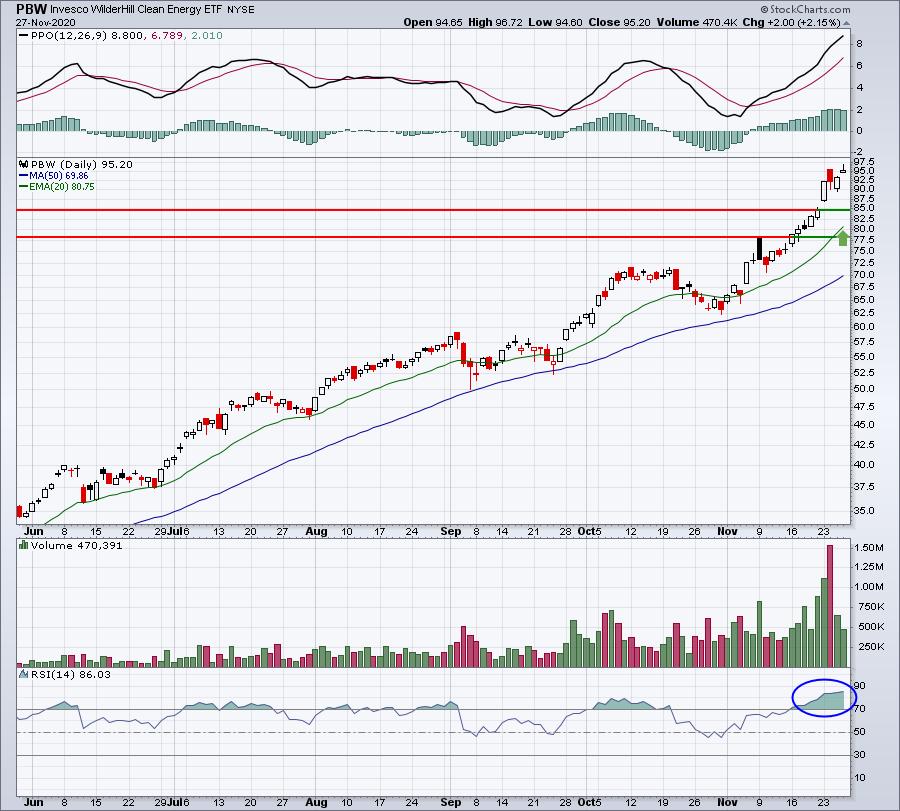
Given its RSI at 86 and its recent move parabolic in nature, don't be surprised to see some short-term profit taking in this area soon.
Happy trading!
Tom Bowley, Chief Market Strategist
EarningsBeats.com
"Better timing. Better trades."