
EB Weekly Portfolio Report - Sunday, December 20, 2020
Upcoming Earnings Reports
According to Zacks.com, the following companies will be reporting earnings this week and each is a component of one of our portfolios:
Monday, December 21: None
Tuesday, December 22: None
Wednesday, December 23: None
Thursday, December 24: None
Friday, December 25: None
PLEASE NOTE: The above companies were provided after scanning the Zacks Earnings Calendar. My research is limited to what Zacks provides and I also can make a mistake from time to time, so please check for earnings dates for all companies that you own. We do hold our portfolio stocks through one earnings report, but every EarningsBeats.com member must make their own investing/trading decisions about holding stocks into earnings reports as it's the most volatile (risky) time to own a stock.
Portfolio Rules and Objectives
Here are the common traits and objectives of our portfolios:
- There are 10 leading stocks from up to 10 leading industries in each portfolio (at the time of selection). Generally, there will only be one stock per industry group, but there could be exceptions.
- They are held for an entire 90 day period, with no stops in place. We strive for consistency, transparency, and simplicity in our portfolios. EB.com members may hold these stocks for the entire 90 days, trade them, use stops, etc., but for purposes of our calculation, we will make no exceptions to our "buy and hold for three months" strategy.
- Every stock will generally be held through ONE earnings report
- The expectation is that relative winners will carry the portfolio to outperformance
- They were all entered into as of the close on Thursday, November 19th; members may choose to try to time better entries, but EB.com "purchased" as of November 19th's closing price
- Primary objective is to outperform the benchmark S&P 500
Here are several considerations for EB members:
- I would expect the Strong AD and Aggressive portfolios to be the riskiest, followed by the Model portfolio, and then the Income portfolio
- The Strong AD portfolio will be selected from a combination of rising accumulation/distribution lines and SCTRs above 80 at the time of selection. It is the only portfolio that does NOT require a revenue and EPS beat in its most recent quarterly earnings report
- The Income portfolio stocks will all pay dividends, with the expected average dividend yield to be at least 1.0%
- Drawdowns (losses) should be much milder on the Income portfolio, with more volatility expected on the other three; please review inception-to-date charts below to gain an idea of the volatility associated with each
- I believe the larger drawdown on the Income portfolio at the beginning of the pandemic was an anomaly, occurring as many defensive, higher-yielding companies uncharacteristically underperformed during a market decline.
- You should own or trade these stocks in whatever manner is most comfortable for you; while we will buy all 10 stocks in the manner identified above, feel free to trade certain stocks or wait for pullbacks if the stocks are overbought
- We have no idea what risk each member is willing or able to take. We are not registered investment advisors so be sure you understand the risk you take. Please consult your financial advisor.
- EarningsBeats.com shareholders/employees may own all or some of the portfolio stocks from time to time.
Weekly Snapshot
Here's a weekly recap:
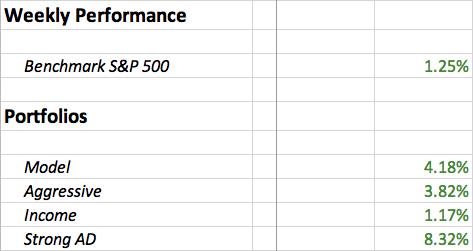
Weekly Summary
Benchmark S&P 500:
The S&P 500 gained 1.25% last week and, despite the strength we've seen in November and December, is not overbought on its weekly chart:
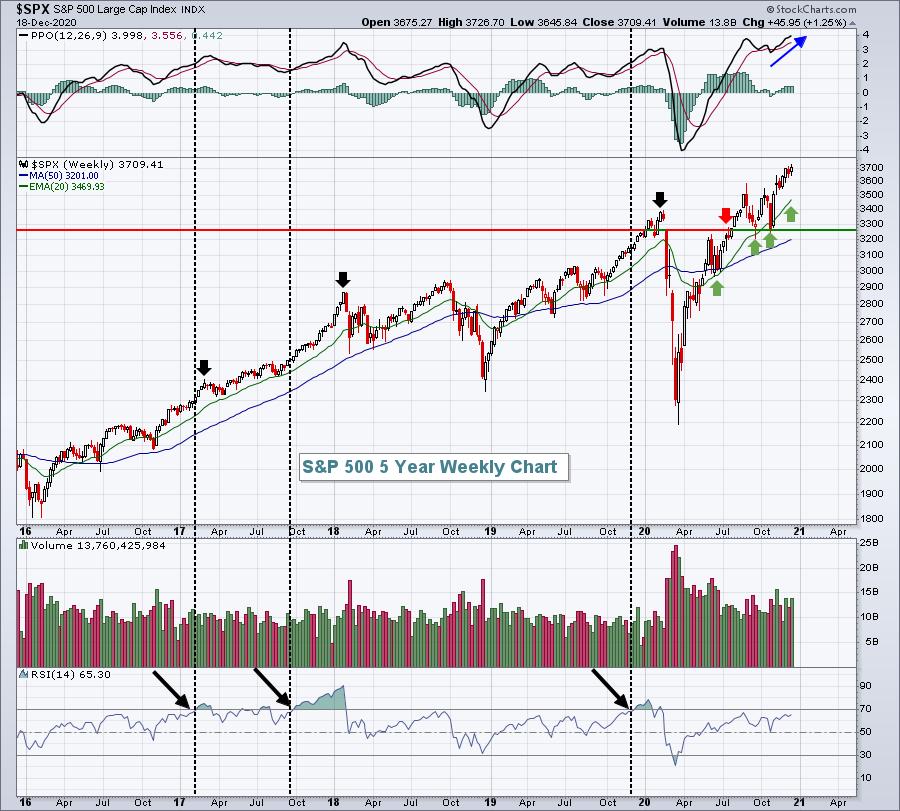
The black arrows in the RSI panel show when the RSI reaches the overbought 70 level. The black arrows on the price chart show the subsequent top weeks later. Currently, the weekly RSI is just at 65, so it's technically not overbought yet. Furthermore, the weekly PPO has broken to a new high as bullish momentum accelerates. While a pullback can occur at any time, there are no technical warning signs on this weekly look at the S&P 500.
Model Portfolio:
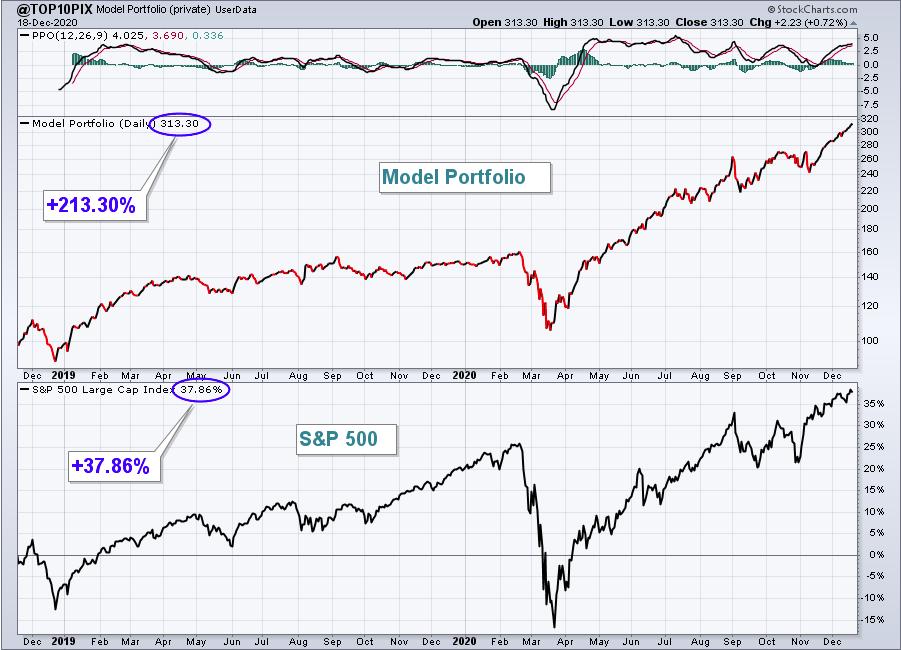
The Model Portfolio jumped 4.18%, outdistancing the S&P 500 by almost another 3 percentage points. Here's the updated inception-to-date chart of the portfolio:
Here are how the Model portfolio component stocks performed last week:
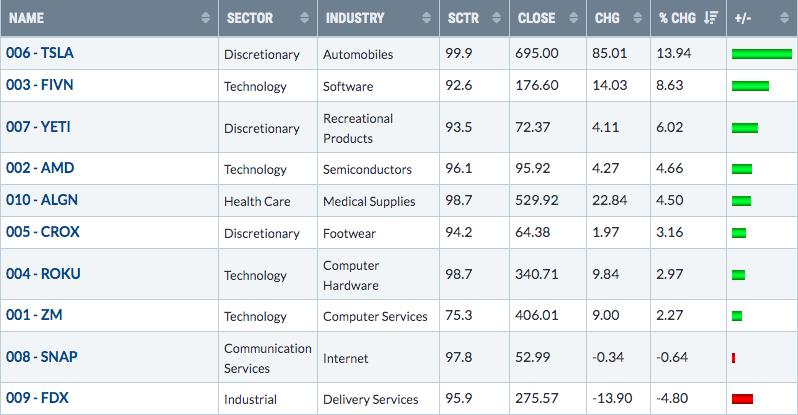
Well, there's been a lot of forced buying into TSLA the past few weeks as index funds must own TSLA in order to mimic the "new" S&P 500, starting this week. FDX, the portfolio's big loser of the week, "delivered" a strong quarter, but Wall Street used the opportunity to sell the stock and take profits. I fully expect we'll see a rebound in FDX in the weeks ahead. Watch key support near 260 in the meantime.
Aggressive Portfolio:
The Aggressive portfolio gained 3.82% and easily beat the S&P 500. Here's the updated inception-to-date chart of the portfolio:
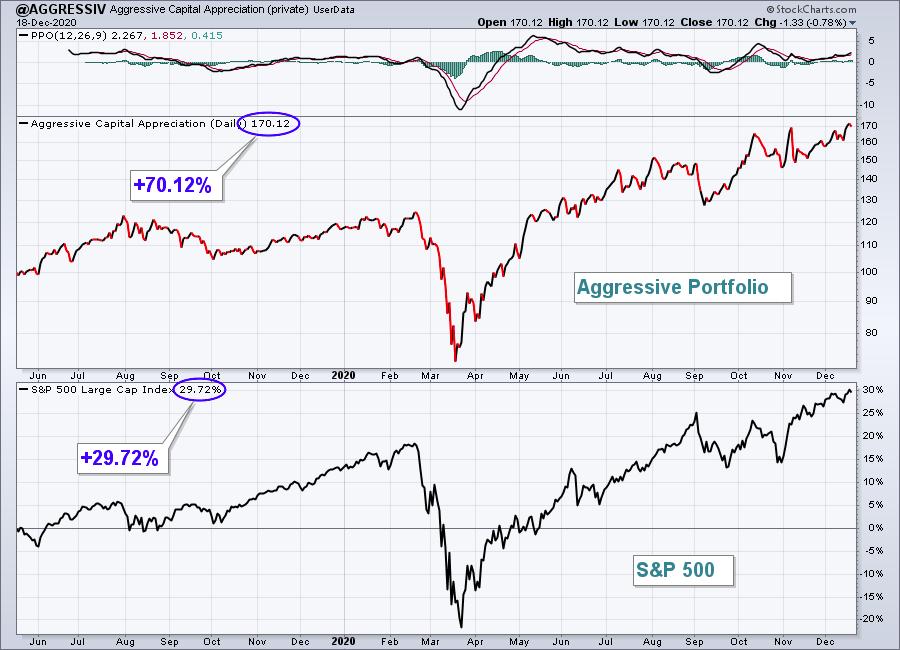
Here are how the Aggressive portfolio component stocks performed last week:
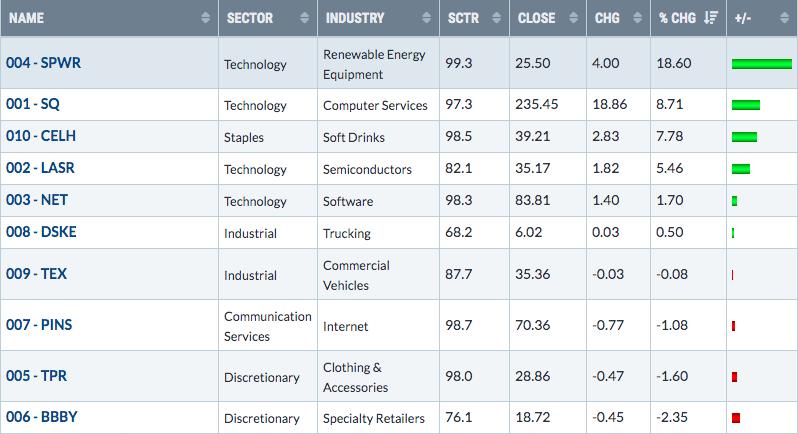
Renewable energy ($DWCREE) had another monster week and that clearly benefited SPWR, which jumped almost 19% on the week. It doesn't hurt that SPWR is on our Short Squeeze ChartList. Short sellers have to be feeling tremendous pain, which could add to further gains in SPWR ahead.
Income Portfolio:
The Income portfolio advanced 1.17%, falling just short of the S&P 500's 1.25% rise. Here's the updated inception-to-date chart of the portfolio:
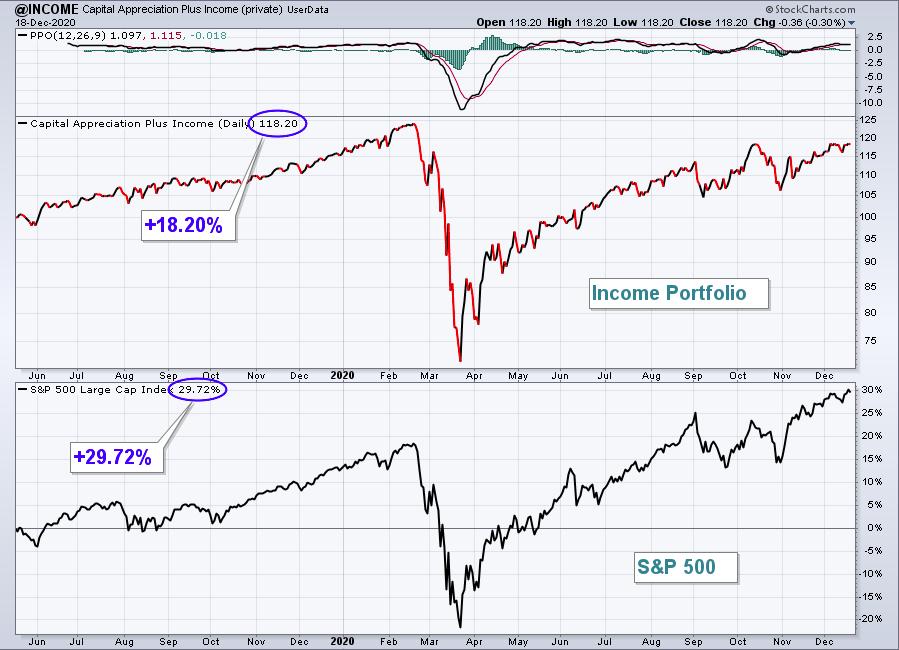
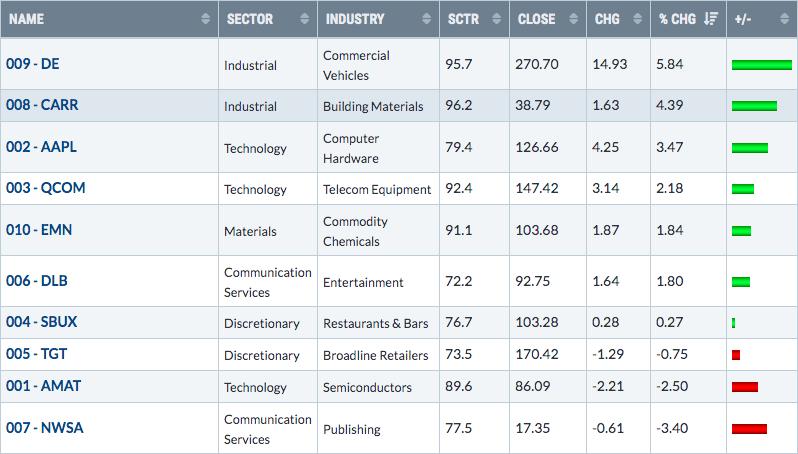
Here are how the Income portfolio component stocks performed last week:
Strong AD Portfolio:
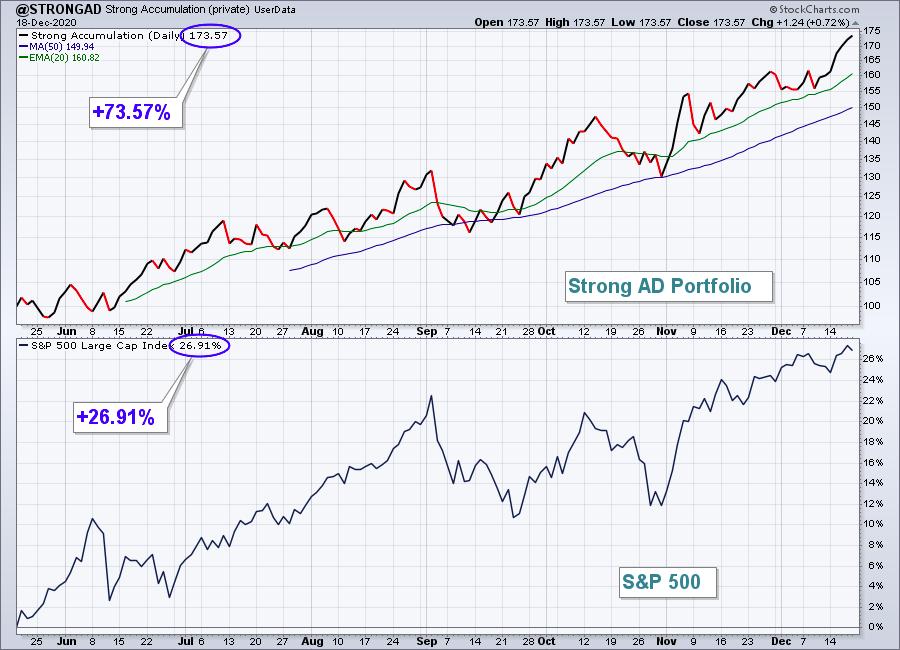
The Strong AD Portfolio soared 8.32%, crushing the benchmark S&P 500 last week. Here's the updated inception-to-date chart of the portfolio:
Here are how the Strong AD portfolio component stocks performed last week:
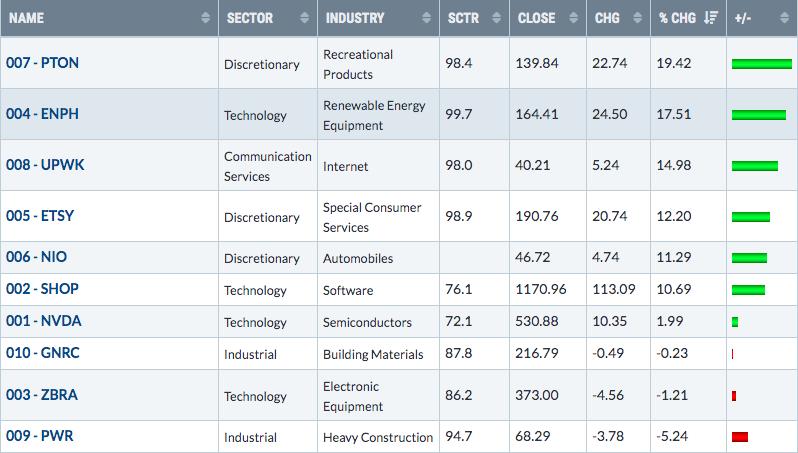
A couple familiar 2020 themes carried the Strong AD Portfolio last week. First, the work-from-home stocks had a strong week, helping to lift PTON. Next, renewable energy's ($DWCREE) strength provided a boost to ENPH.
Summary
We remain quite optimistic on the stock market's prospects to close out 2020 and for 2021 as well. We had our Market Vision 2021 on Saturday and I showed the potential of the S&P 500 if we remain in this secular bull market for the balance of this decade, which I believe we will. The Fed hiked its GDP forecast for 2021 and I am looking for it to be hiked further as we move past the pandemic and a year's worth of pent up demand kicks in.
Model ETF Portfolio
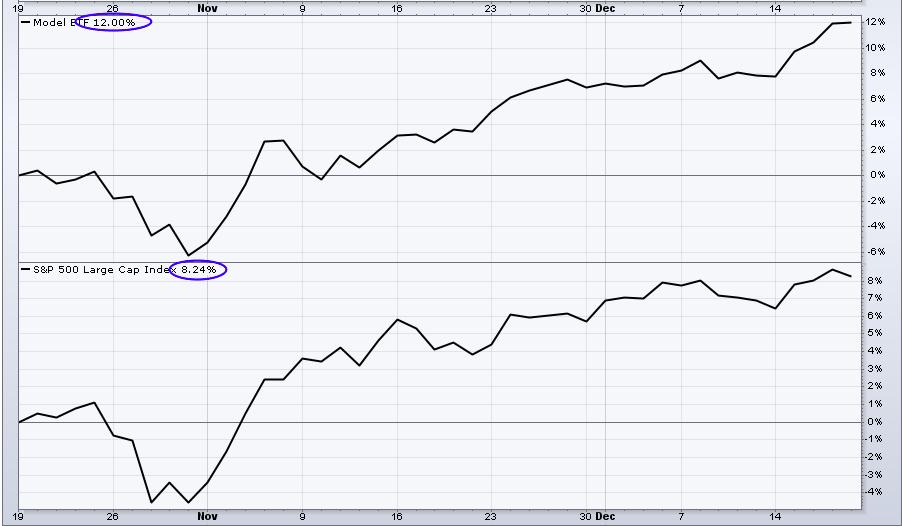
The following is an inception-to-date chart of this portfolio with a comparative chart of the S&P 500 in the panel below:
Here are how our Model ETF Portfolio components performed last week:
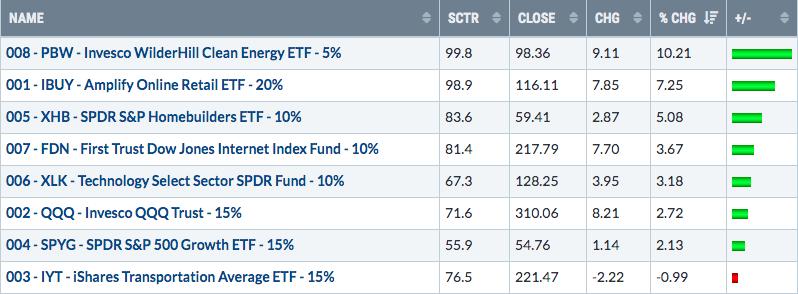
Transports were the only ETF that failed to beat the S&P 500 last week. It was the Model ETF Portfolio's best weekly performance vs. the S&P 500 since its inception in October.
Happy trading!
Tom Bowley, Chief Market Strategist
EarningsBeats.com
"Better timing. Better trades."