
EB Weekly Portfolio Report - Sunday, January 10, 2021
Upcoming Earnings Reports
According to Zacks.com, the following companies will be reporting earnings this week and each is a component of one of our portfolios:
Monday, January 11: None
Tuesday, January 12: None
Wednesday, January 13: None
Thursday, January 14: None
Friday, January 15: None
PLEASE NOTE: The above companies were provided after scanning the Zacks Earnings Calendar. My research is limited to what Zacks provides and I also can make a mistake from time to time, so please check for earnings dates for all companies that you own. We do hold our portfolio stocks through one earnings report, but every EarningsBeats.com member must make their own investing/trading decisions about holding stocks into earnings reports as it's the most volatile (risky) time to own a stock.
Portfolio Rules and Objectives
Here are the common traits and objectives of our portfolios:
- There are 10 leading stocks from up to 10 leading industries in each portfolio (at the time of selection). Generally, there will only be one stock per industry group, but there could be exceptions.
- They are held for an entire 90 day period, with no stops in place. We strive for consistency, transparency, and simplicity in our portfolios. EB.com members may hold these stocks for the entire 90 days, trade them, use stops, etc., but for purposes of our calculation, we will make no exceptions to our "buy and hold for three months" strategy.
- Every stock will generally be held through ONE earnings report
- The expectation is that relative winners will carry the portfolio to outperformance
- They were all entered into as of the close on Thursday, November 19th; members may choose to try to time better entries, but EB.com "purchased" as of November 19th's closing price
- Primary objective is to outperform the benchmark S&P 500
Here are several considerations for EB members:
- I would expect the Strong AD and Aggressive portfolios to be the riskiest, followed by the Model portfolio, and then the Income portfolio
- The Strong AD portfolio will be selected from a combination of rising accumulation/distribution lines and SCTRs above 80 at the time of selection. It is the only portfolio that does NOT require a revenue and EPS beat in its most recent quarterly earnings report
- The Income portfolio stocks will all pay dividends, with the expected average dividend yield to be at least 1.0%
- Drawdowns (losses) should be much milder on the Income portfolio, with more volatility expected on the other three; please review inception-to-date charts below to gain an idea of the volatility associated with each
- I believe the larger drawdown on the Income portfolio at the beginning of the pandemic was an anomaly, occurring as many defensive, higher-yielding companies uncharacteristically underperformed during a market decline.
- You should own or trade these stocks in whatever manner is most comfortable for you; while we will buy all 10 stocks in the manner identified above, feel free to trade certain stocks or wait for pullbacks if the stocks are overbought
- We have no idea what risk each member is willing or able to take. We are not registered investment advisors so be sure you understand the risk you take. Please consult your financial advisor.
- EarningsBeats.com shareholders/employees may own all or some of the portfolio stocks from time to time.
Weekly Snapshot
Here's a weekly recap:
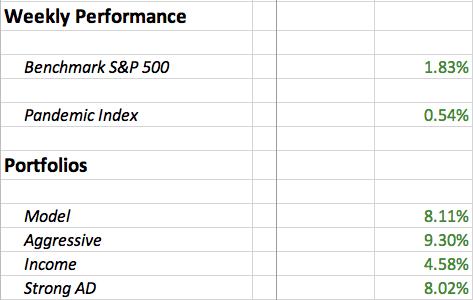
Our portfolios closed out the year with a limp, if you recall, as many of our stocks saw profit taking during the "Santa Claus Rally" period between Christmas and New Years. That certainly changed last week as all of our Portfolios absolutely crushed the S&P 500 in a tremendous start to 2021. It was at least short-term confirmation that growth stocks are alive and well. Also, note the Pandemic Index' meager 0.54% gain last week, well below that of the S&P 500. Many of these industry groups, and the stocks within them, are not in "full speed ahead" mode. We should still approach many of these areas with a lot of skepticism.
Weekly Summary
Benchmark S&P 500:
The S&P 500 had another stellar week, jumping 1.83%. The momentum right now couldn't be much better. The hourly, daily, and weekly charts all show the S&P 500 bouncing beautifully off 20 period EMA tests. While we're overbought (RSI 70) on the daily chart and nearly overbought (RSI 69) on the weekly chart, volume trends are strong. It's also very important to realize that overbought can become more overbought during secular bull market rallies. As a trader, I'd try to rotate my individual holdings. When a stock becomes extremely overbought, rotating into another leader that's currently consolidating likely makes sense. From a longer-term "buy and hold" perspective, just hang on for the ride. We only make position changes 4x per year in our portfolios, with the next "draft" day being February 19th.
Model Portfolio:
The Model Portfolio rocketed 8.11% higher, a staggering one-week gain to open 2021. Here's the updated inception-to-date chart of the portfolio:
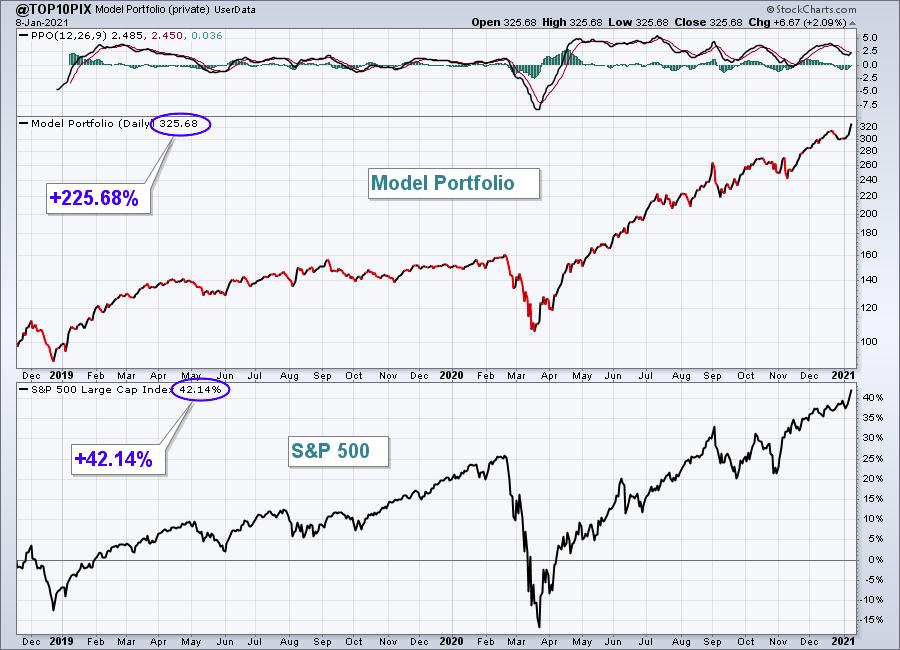
Here are how the Model portfolio component stocks performed last week:
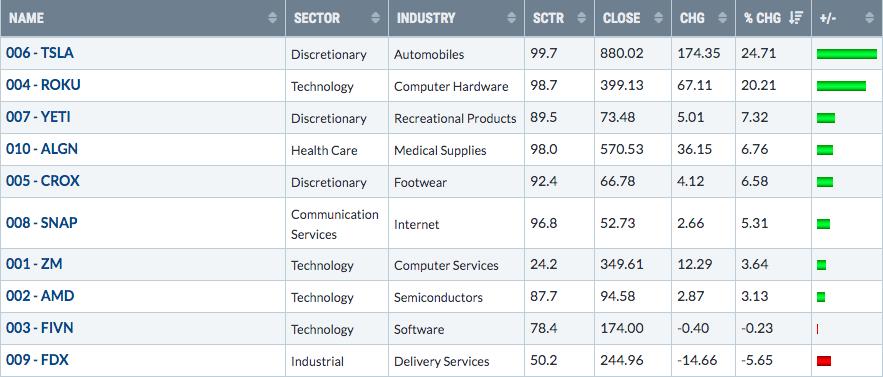
There's not a lot of negative technical information to share on this portfolio, but what there is mostly relates to FDX. Its daily chart lost price support that I had recently pointed out in the 255-260 range. It's worth noting also that the AD line has gone from a 52-week high to a 52-week low in less than 4 months. Part of the responsibility has to be borne by FDX, which is underperforming its peers. But the group itself - delivery services ($DJUSAF) - is currently trading at a 4-month, which certainly isn't helping. We'll hold FDX through February 19th, because that's what we do with all portfolio stocks, but clearly technical conditions have deteriorated here.
Aggressive Portfolio:
The Aggressive Portfolio surged 9.30%, setting a new high since its inception. Here's the updated inception-to-date chart of the portfolio:
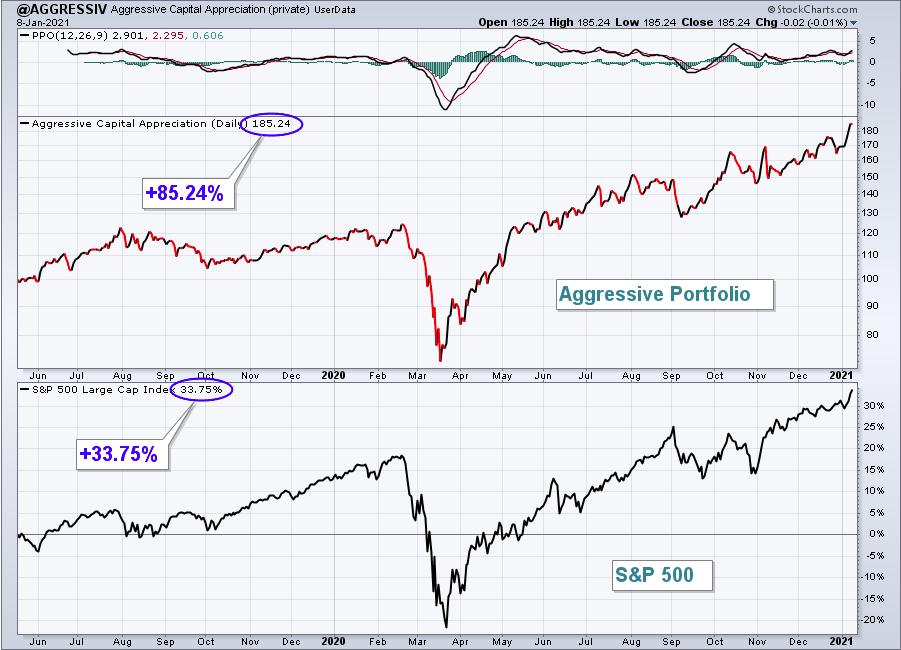
Here are how the Aggressive portfolio component stocks performed last week:
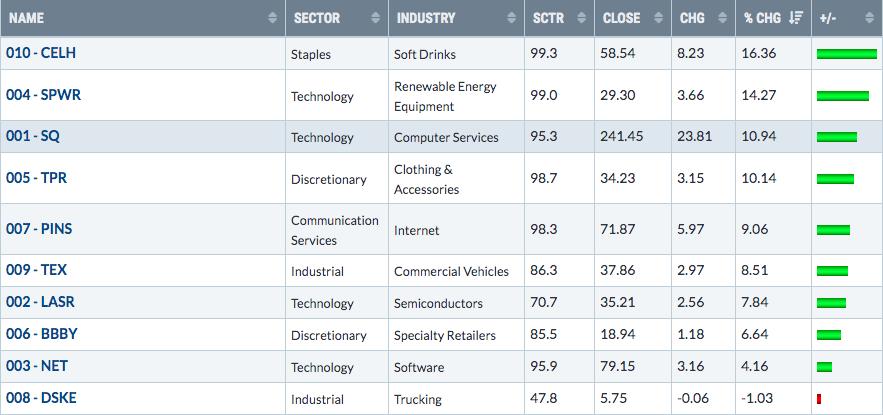
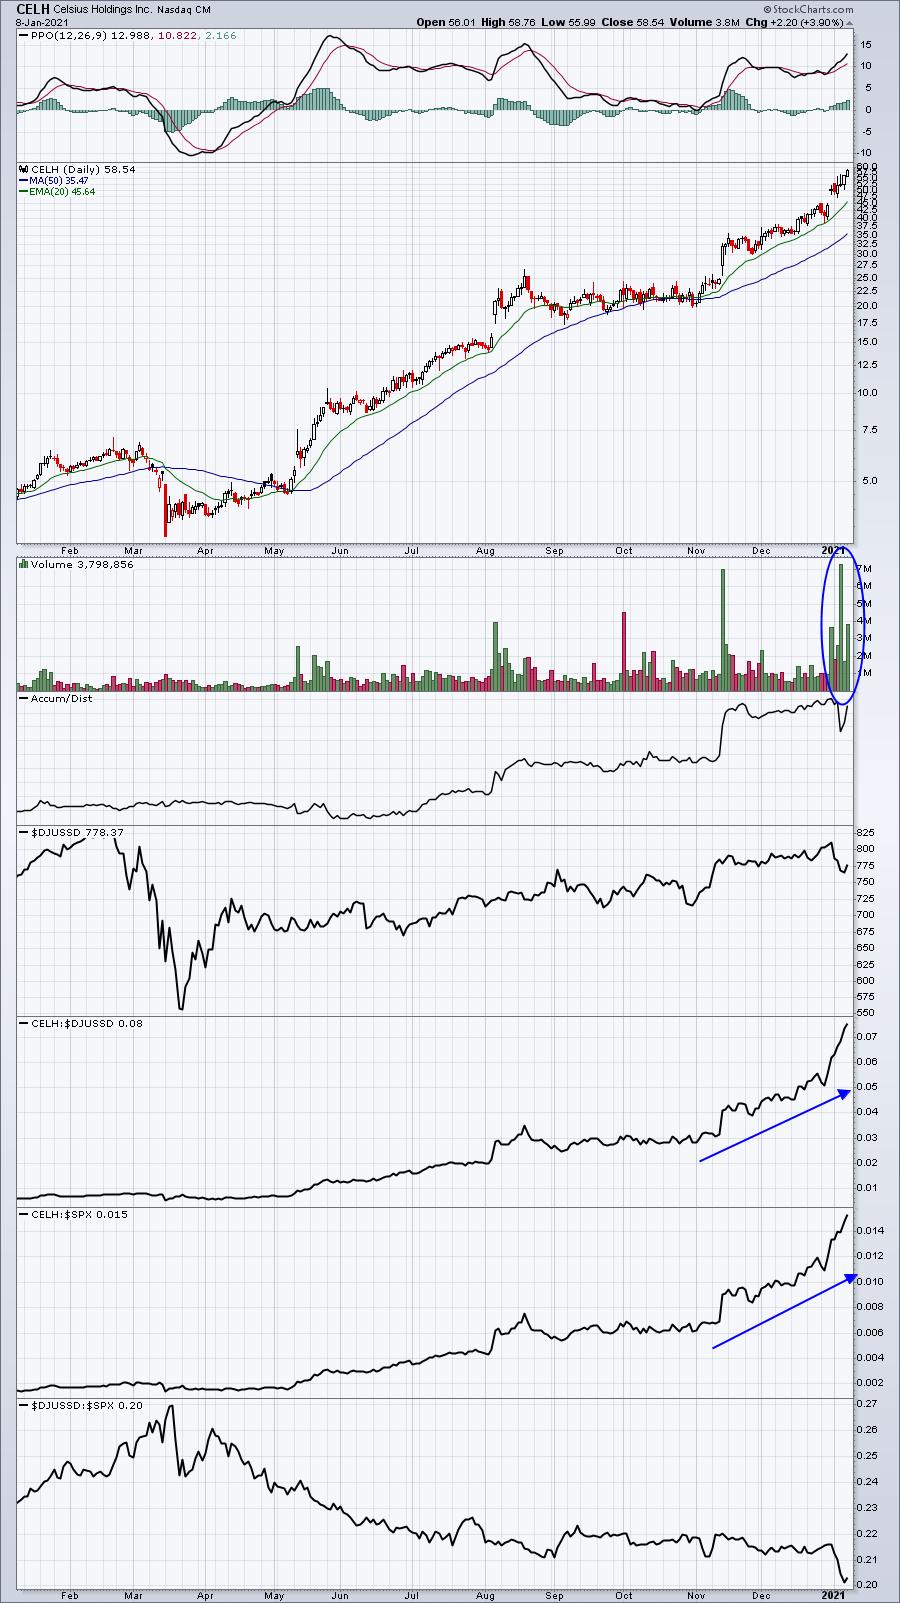
Last week's big winner was CELH, which just keeps moving higher on extremely heavy volume. It's crushing its peers and the benchmark S&P 500:
Income Portfolio:
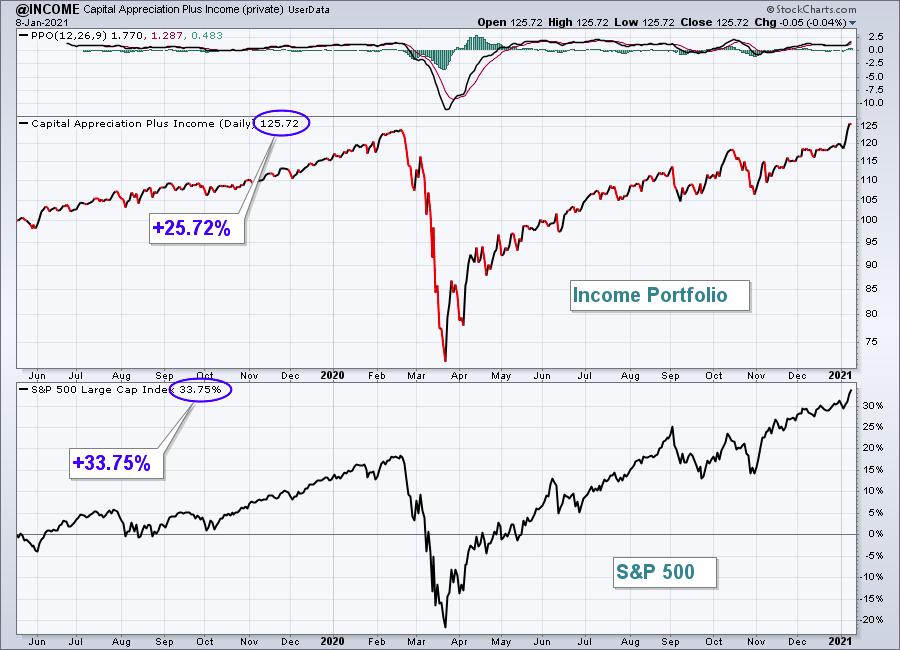
The Income Portfolio climbed 4.58%, posting one of its best absolute and relative performance weeks since its inception and finishing at a fresh new high. Here's the updated inception-to-date chart of the portfolio:
Here are how the Income portfolio component stocks performed last week:
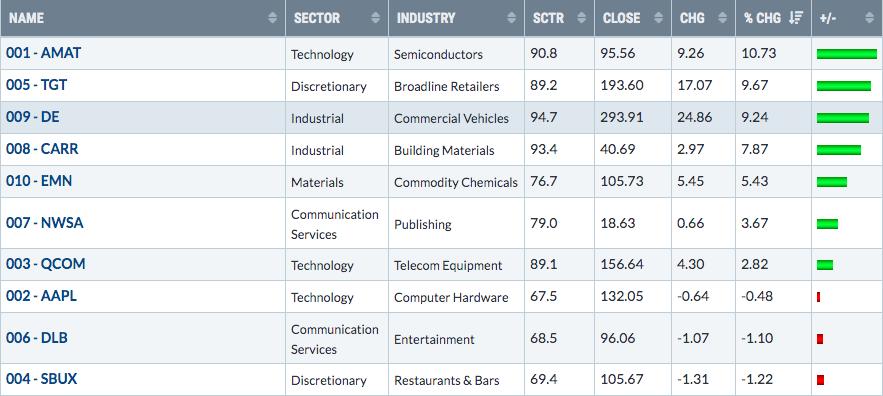
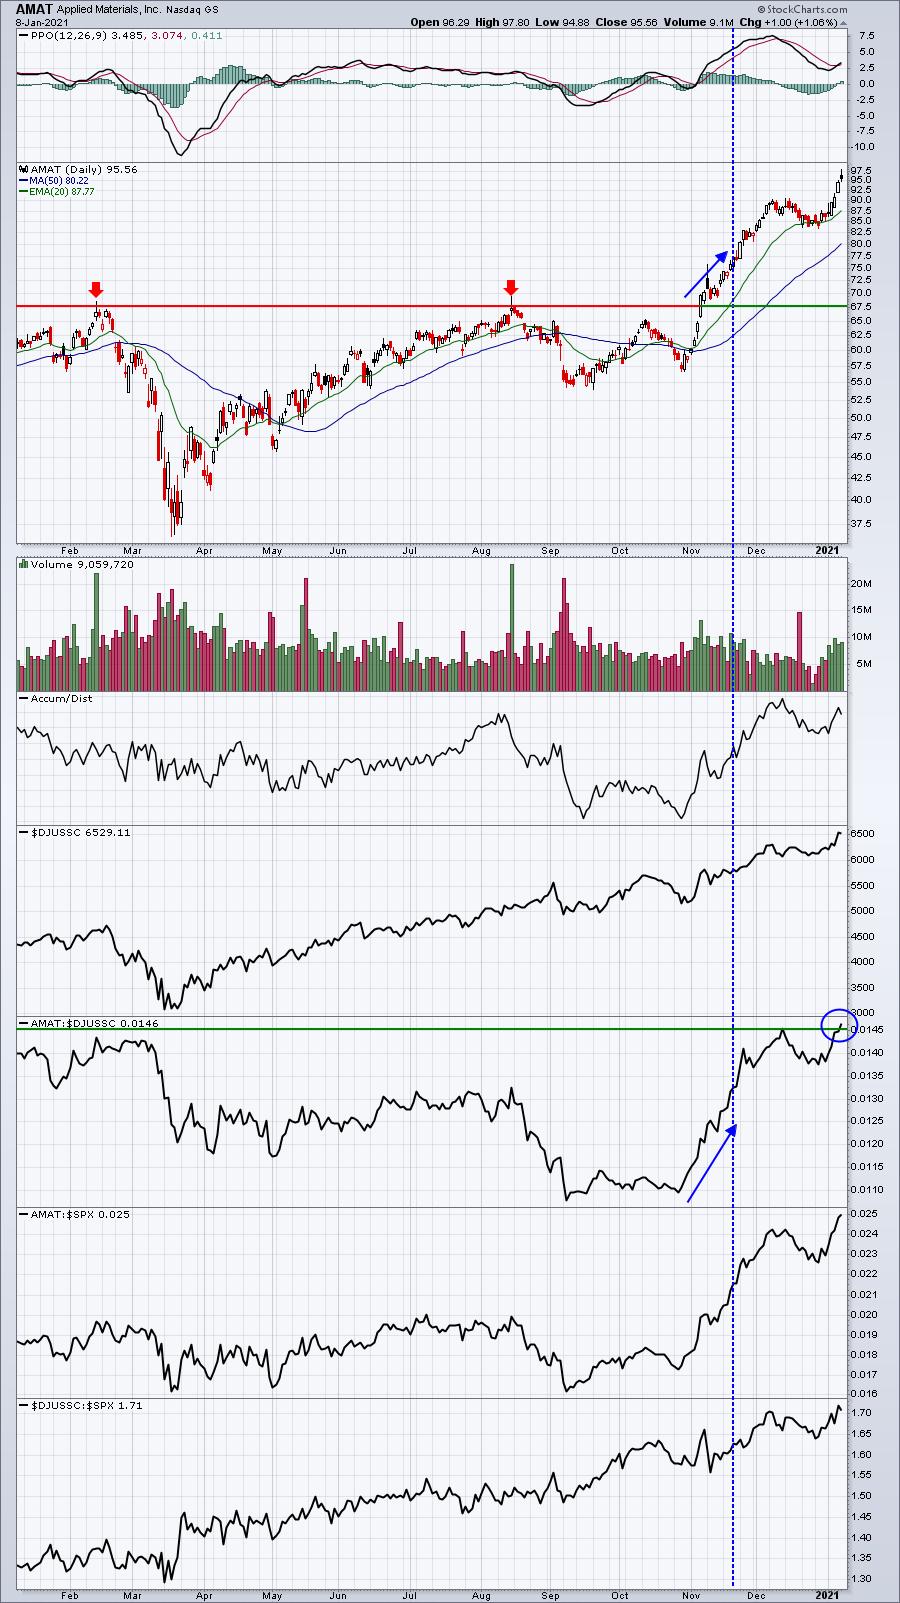
AMAT is part of the very strong semiconductor group ($DJUSSC). Thinking back to November 19th, when we added AMAT, the key was the absolute price breakout in the stock, along with rapidly-improving relative strength. It's turned out to be a great selection thus far:
Strong AD Portfolio:
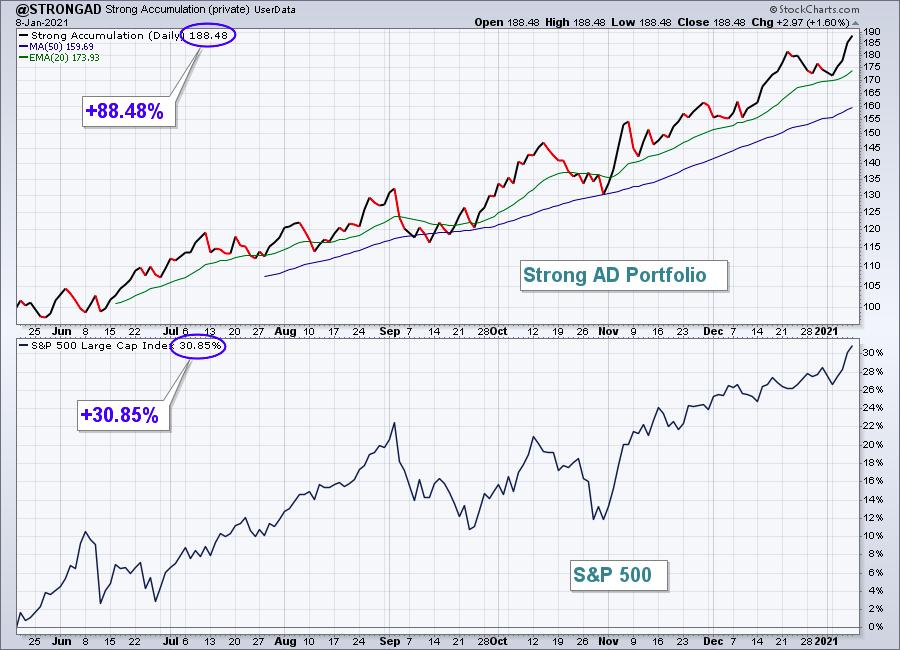
The Strong AD Portfolio shot up 8.02%, having another stellar week relative to the benchmark S&P 500. Here's the updated inception-to-date chart of the portfolio:
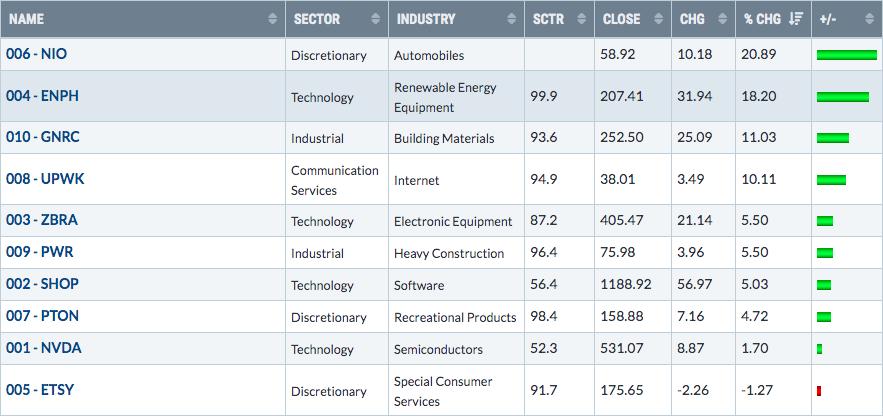
Here are how the Strong AD portfolio component stocks performed last week:
The performance of our Strong AD Portfolio since its inception has been nothing short of staggering. This portfolio is now up 88% in less than 8 months! I believe we'll have many opportunities throughout 2021, though trying to duplicate this type of return will likely prove futile.
Summary
32 of our 40 portfolio stocks outperformed the S&P 500 last week, with 11 gaining more than 10% on the week. That's absolutely staggering performance and really kick-started our portfolios to open 2021. While we track our stock portfolios based on our fiscal quarters that begin February 19th, May 19th, August 19th, and November 19th, if you're interested in how our portfolios have done by calendar year, here's a summary:
Model Portfolio:
- 2019: +51.92% (vs. S&P 500 +28.88%)
- 2020: +100.96% (vs. S&P 500 +16.26%)
Aggressive Portfolio:
- 2020: +44.49% (vs. S&P 500 +16.26%)
Income Portfolio:
- 2020: +4.05% (vs. S&P 500 +16.26%)
Strong AD Portfolio:
- inception date was May 19, 2020, so no full-year results available
Needless to say, we've raised the bar pretty high for 2021, but we certainly hope to consistently outperform the benchmark S&P 500.
Model ETF Portfolio
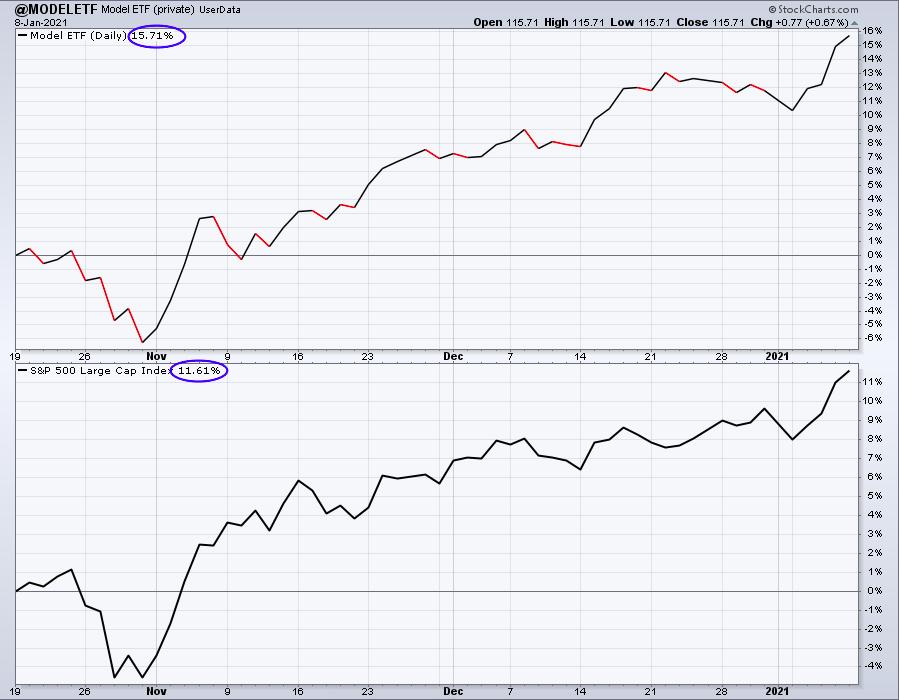
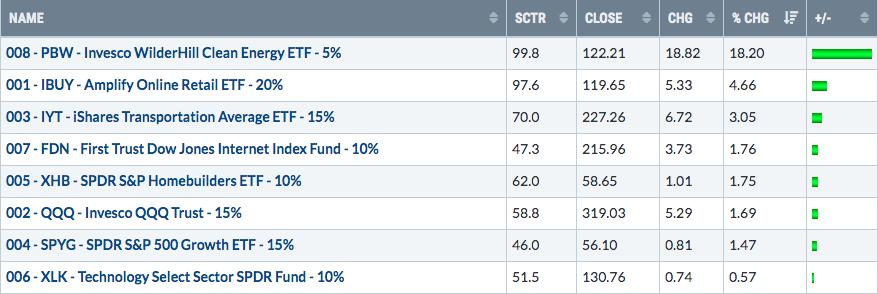
I was planning to include results for this portfolio in a separate ETF report, but we're not quite ready to do that. So I'll give you a quick update here as we approach our next Model ETF Portfolio "draft" (to be held on Tuesday, January 19th).
Here's the updated inception-to-date chart of the Model ETF Portfolio:
Here are how the Model ETF Portfolio component ETFs performed last week:
Happy trading!
Tom Bowley, Chief Market Strategist
EarningsBeats.com
"Better timing. Better trades."