
EB Weekly Portfolio Report - Sunday, January 31, 2021
Upcoming Earnings Reports
According to Zacks.com, the following companies will be reporting earnings this week and each is a component of one of our portfolios:
Monday, February 1: None
Tuesday, February 2: None
Wednesday, February 3: QCOM, ALGN
Thursday, February 4: SNAP, PTON, PINS, NWSA, TPR
Friday, February 5: None
PLEASE NOTE: The above companies were provided after scanning the Zacks Earnings Calendar. My research is limited to what Zacks provides and I also can make a mistake from time to time, so please check for earnings dates for all companies that you own. We do hold our portfolio stocks through one earnings report, but every EarningsBeats.com member must make their own investing/trading decisions about holding stocks into earnings reports as it's the most volatile (risky) time to own a stock.
Portfolio Rules and Objectives
Here are the common traits and objectives of our portfolios:
- There are 10 leading stocks from up to 10 leading industries in each portfolio (at the time of selection). Generally, there will only be one stock per industry group, but there could be exceptions.
- They are held for an entire 90 day period, with no stops in place. We strive for consistency, transparency, and simplicity in our portfolios. EB.com members may hold these stocks for the entire 90 days, trade them, use stops, etc., but for purposes of our calculation, we will make no exceptions to our "buy and hold for three months" strategy.
- Every stock will generally be held through ONE earnings report
- The expectation is that relative winners will carry the portfolio to outperformance
- They were all entered into as of the close on Thursday, November 19th; members may choose to try to time better entries, but EB.com "purchased" as of November 19th's closing price
- Primary objective is to outperform the benchmark S&P 500
Here are several considerations for EB members:
- I would expect the Strong AD and Aggressive portfolios to be the riskiest, followed by the Model portfolio, and then the Income portfolio
- The Strong AD portfolio will be selected from a combination of rising accumulation/distribution lines and SCTRs above 80 at the time of selection. It is the only portfolio that does NOT require a revenue and EPS beat in its most recent quarterly earnings report
- The Income portfolio stocks will all pay dividends, with the expected average dividend yield to be at least 1.0%
- Drawdowns (losses) should be much milder on the Income portfolio, with more volatility expected on the other three; please review inception-to-date charts below to gain an idea of the volatility associated with each
- I believe the larger drawdown on the Income portfolio at the beginning of the pandemic was an anomaly, occurring as many defensive, higher-yielding companies uncharacteristically underperformed during a market decline.
- You should own or trade these stocks in whatever manner is most comfortable for you; while we will buy all 10 stocks in the manner identified above, feel free to trade certain stocks or wait for pullbacks if the stocks are overbought
- We have no idea what risk each member is willing or able to take. We are not registered investment advisors so be sure you understand the risk you take. Please consult your financial advisor.
- EarningsBeats.com shareholders/employees may own all or some of the portfolio stocks from time to time.
Weekly Snapshot
Here's a weekly recap:
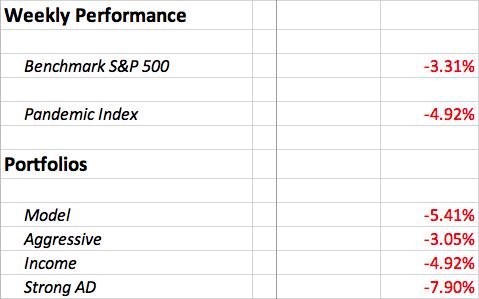
The S&P 500 had a rough week and our portfolios had an even rougher week. Only our Aggressive Portfolio was able to beat the S&P 500 as growth stocks, relative to value stocks, turned lower from a key 1.80 relative resistance level that was tested on Wednesday.
Weekly Summary
Benchmark S&P 500:
Last week, I showed how the breakout to all-time highs was accompanied by strength in the three most important sectors (XLK, XLY, and XLC). Well, last week we gave up those gains and more, yet all three of these sectors performed mostly in the middle of the pack:
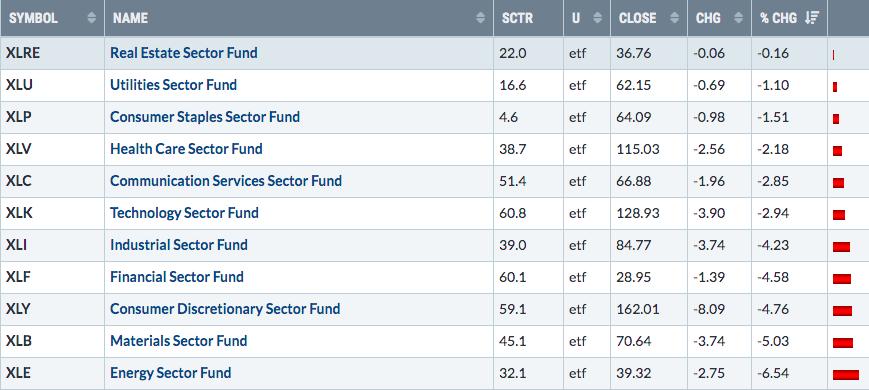
When the S&P 500 set yet another all-time high early last week, the XLK, XLY, and XLC all were at or near relative highs vs. the S&P 500. That's not how tops typically form, which suggests to me this will likely be a very brief period of selling/consolidation.
Model Portfolio:
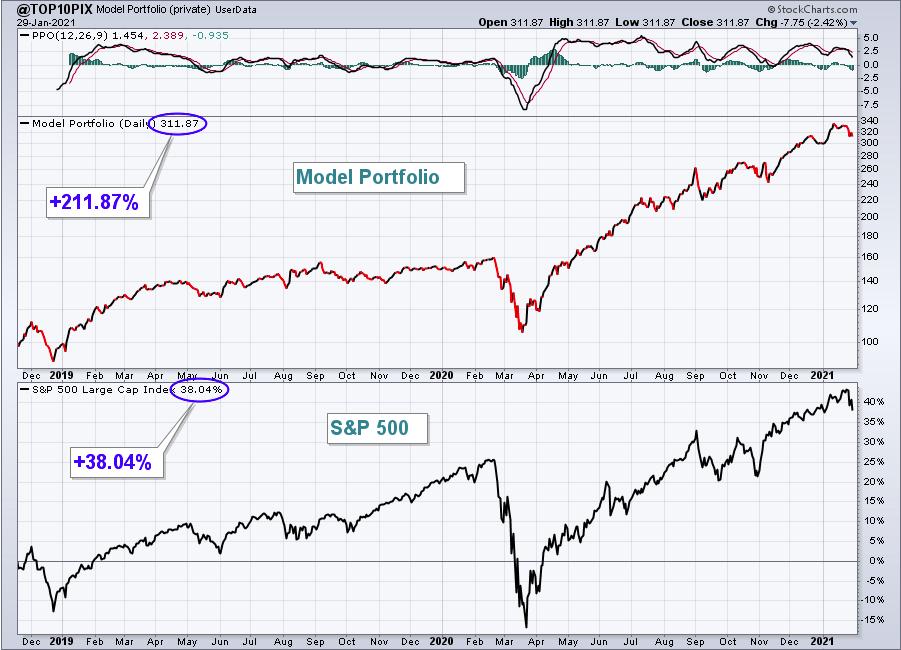
The Model Portfolio fell 5.41%, trailing the S&P 500 last week. Here's the updated inception-to-date chart of the portfolio:
Here are how the Model portfolio component stocks performed last week:
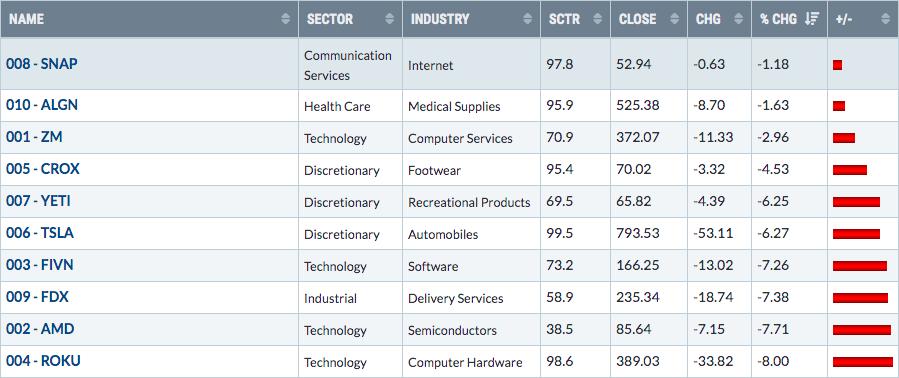
Several component stocks struggled last week, but ROKU's weakness is likely presenting an opportunity:
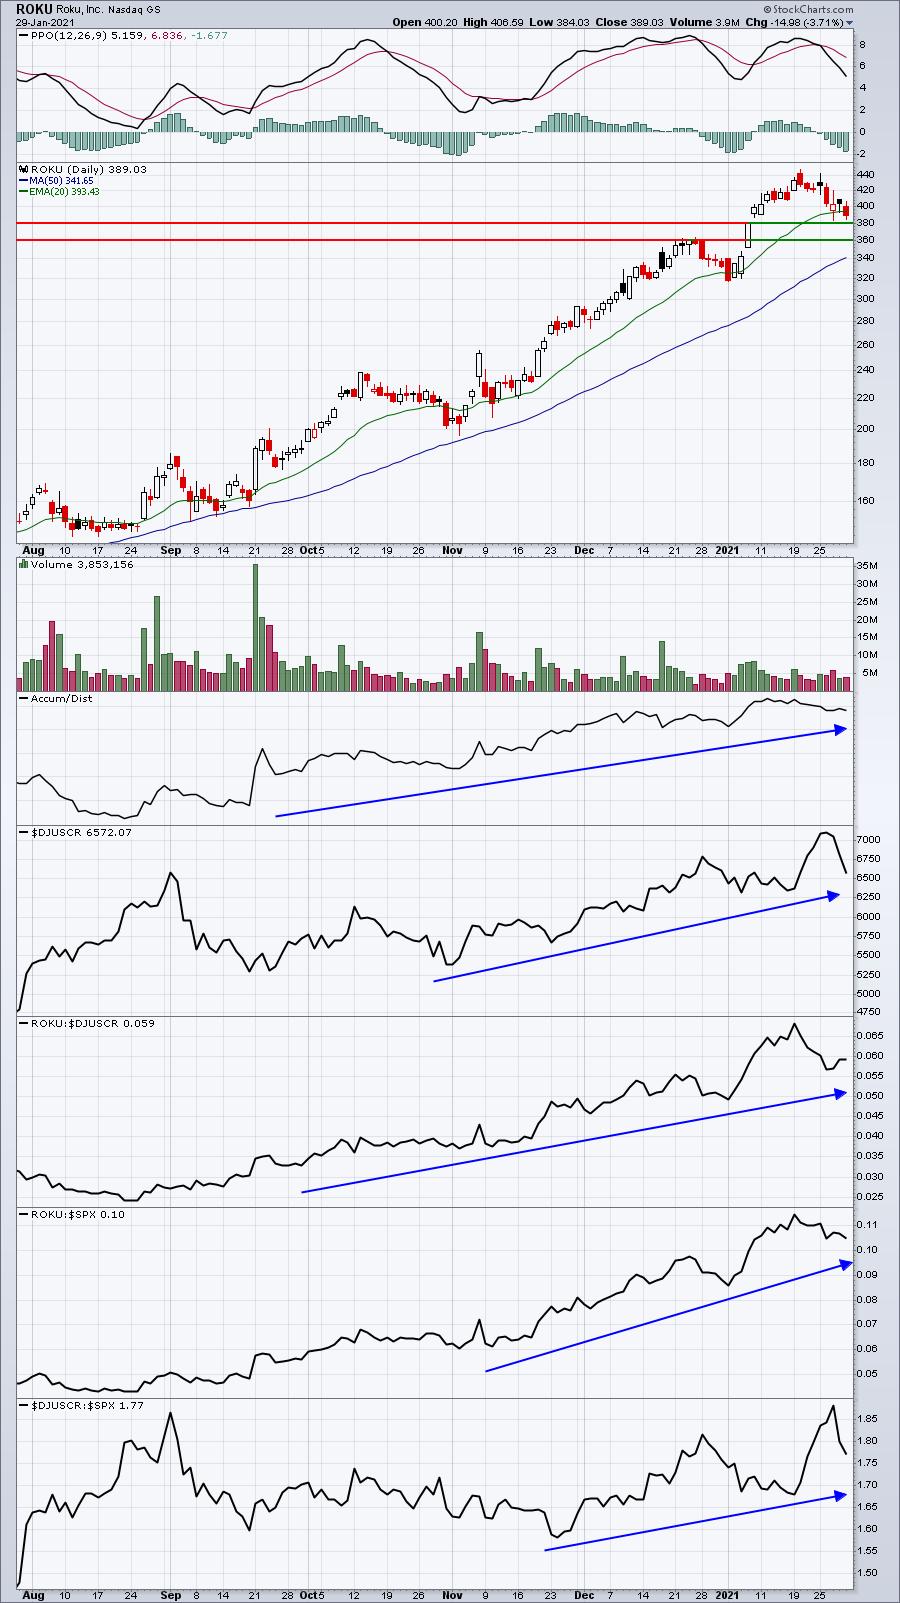
Price and gap support are approaching and the volume on last week's selling was light. ROKU remains an excellent relative performer in computer hardware and I'd expect it to perform very well when the overall market reverses back to the upside.
Aggressive Portfolio:
The Aggressive Portfolio dropped 3.05%, but still managed to outperform the S&P 500. Here's the updated inception-to-date chart of the portfolio:
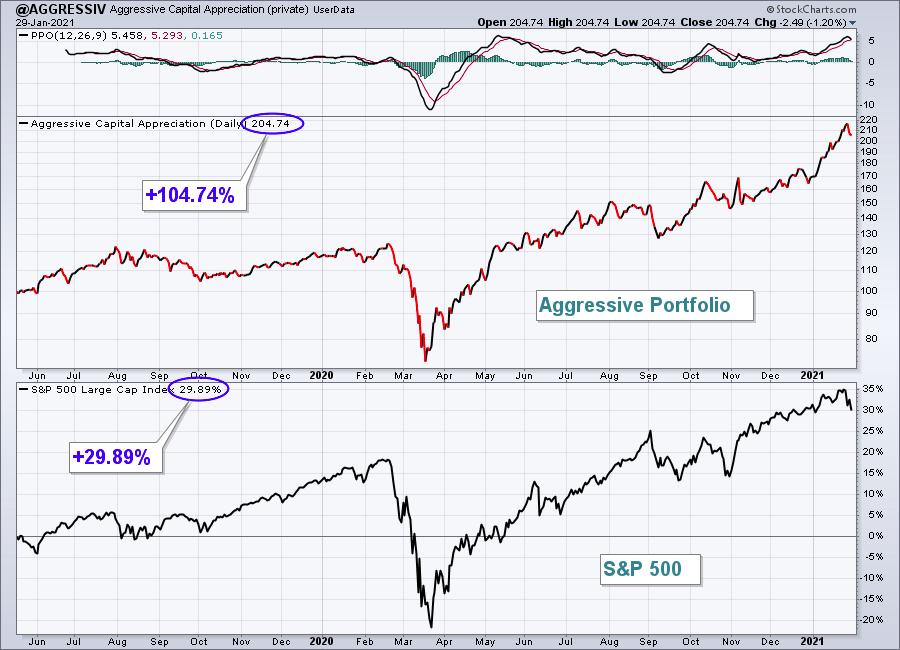
Here are how the Aggressive portfolio component stocks performed last week:
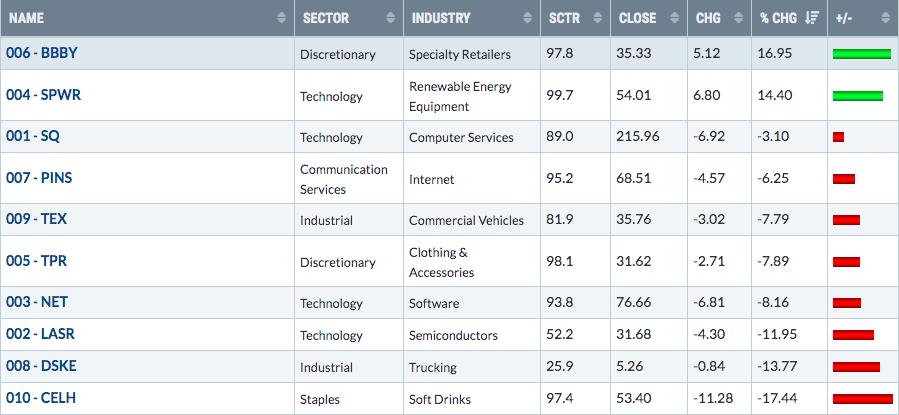
The fact that the Aggressive Portfolio managed to outperform the S&P 500 last week was a positive, but honestly it was only due to two stocks - BBBY and SPWR. Several component stocks have very difficult weeks including CELH:
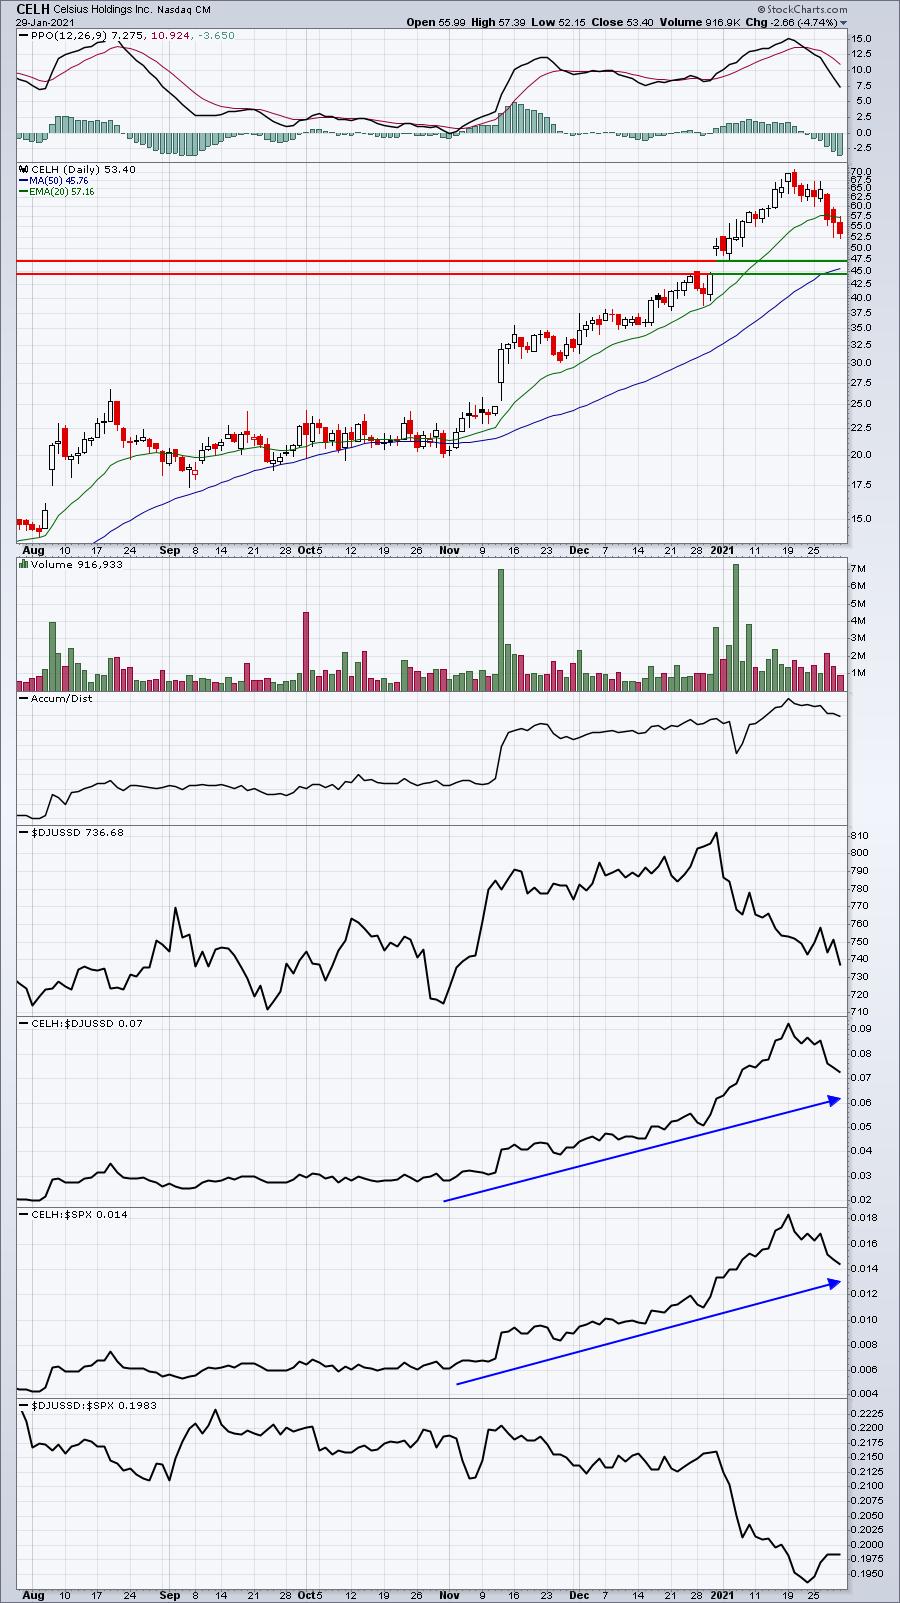
CELH has been a massive outperformer, despite hailing from the not-so-great soft drink industry ($DJUSSD). After failing to hold its rising 20 day EMA, there's an increased likelihood it could revisit price and gap support.
Income Portfolio:
The Income Portfolio pulled back 4.92%, losing ground to the S&P 500. Here's the updated inception-to-date chart of the portfolio:
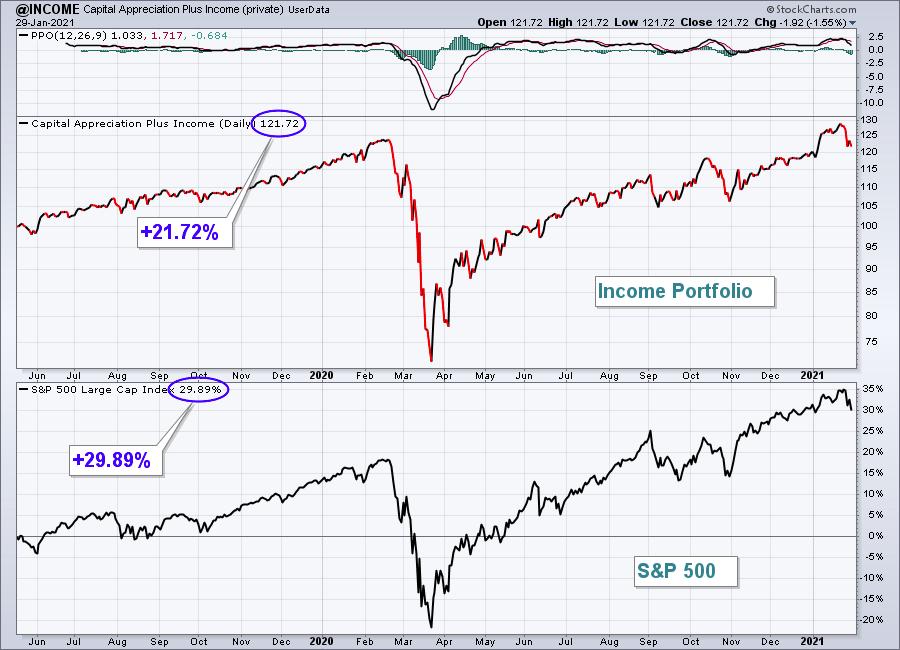
Here are how the Income portfolio component stocks performed last week:
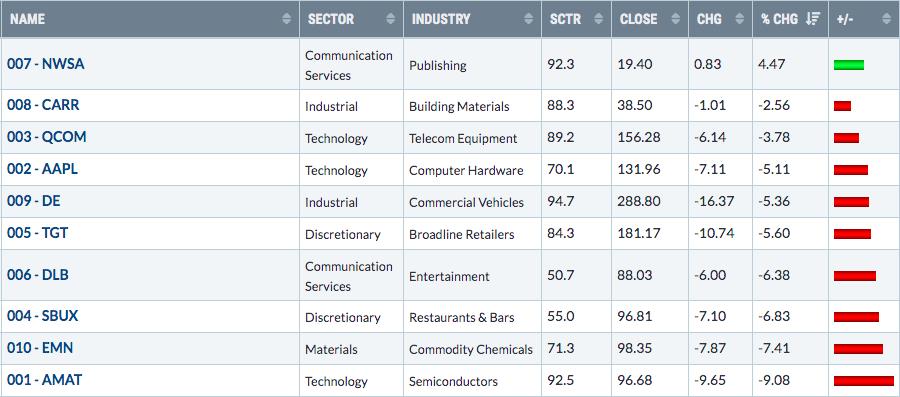
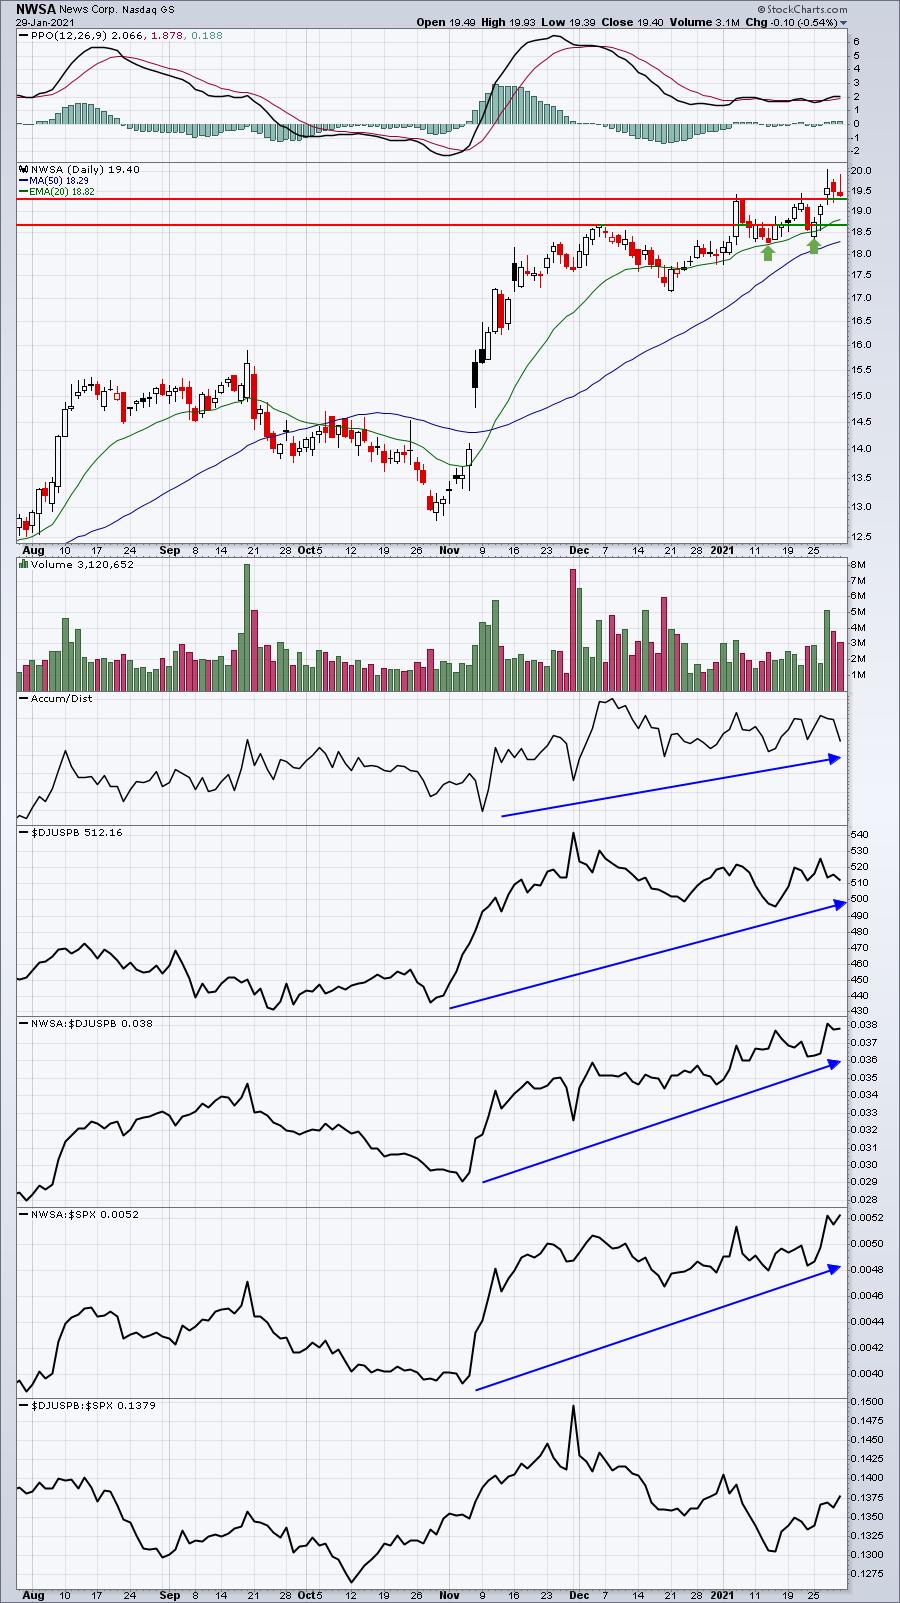
While AMAT takes a well-deserved breather before its upcoming earning in a week and a half, NWSA was busy breaking above early January highs and to an all-time high:
Strong AD Portfolio:
The Strong AD Portfolio tumbled 7.90%, doubling the loss on the S&P 500. Here's the updated inception-to-date chart of the portfolio:
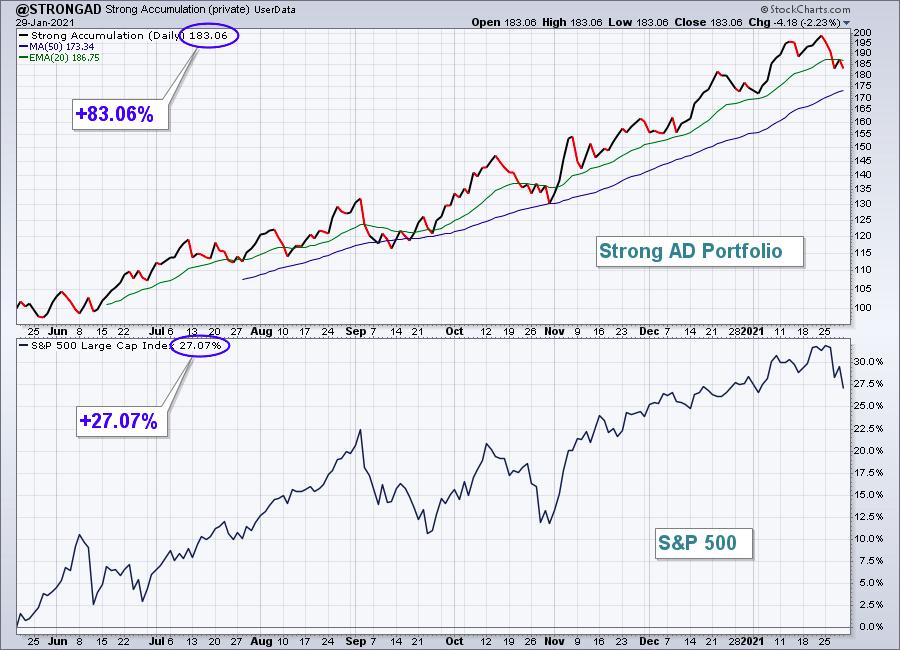
Here are how the Strong AD portfolio component stocks performed last week:
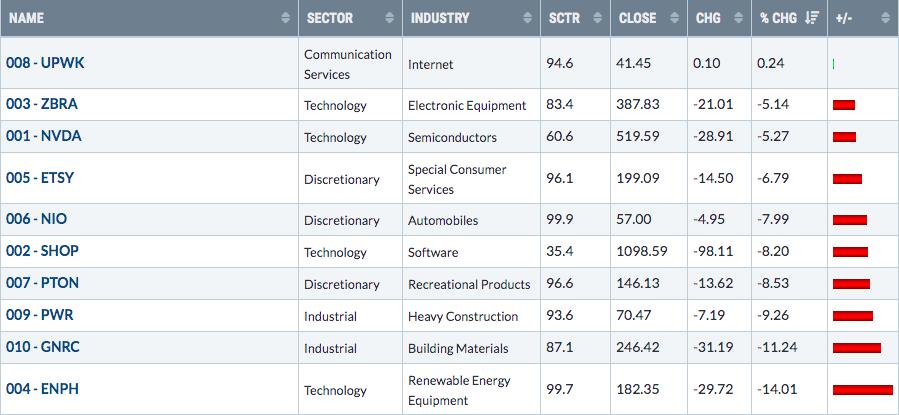
It was clearly a rough week for our Strong AD Portfolio last week. After looking at all the charts, however, I believe ZBRA might be best-positioned for a rebound at its current price:
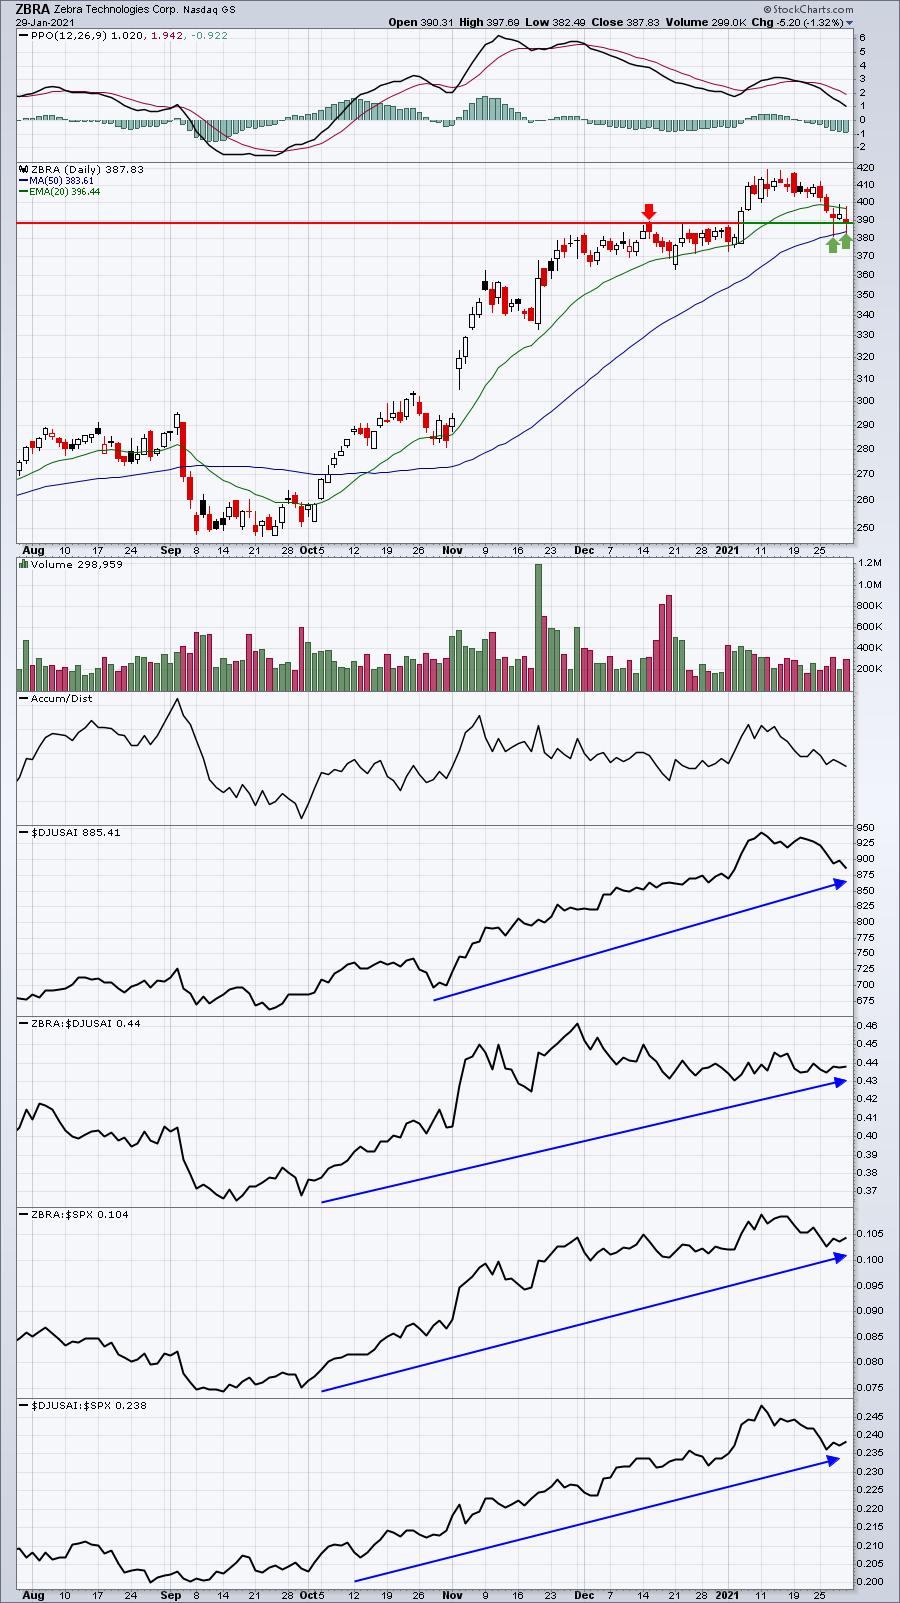
The lower PPO on the higher price represents a negative divergence, which typically results in a 50 day SMA and/or PPO centerline test. We saw both price support and that 50 day SMA tested late last week on the market's overall weakness. ZBRA remains a leader, however, in a very strong electronic equipment index ($DJUSAI). I look for a rebound fairly soon.
Summary
In the January Seasonality Report that was published 4 weeks ago, I pointed out the following January seasonal performance for the S&P 500 since 1950:
January 1-18: +35.16%
January 19-31: -3.21%
True to form, the S&P 500 performed well heading into the earnings season. But once the actual earnings started to be released, the S&P 500 struggled. The "buy on rumor, sell on news" hit the U.S. stock market yet one more time.
Earnings, thus far, have been extremely bullish. Over the past two weeks, and among companies with market caps of $5 billion or greater, there have been 186 companies beat Wall Street consensus estimates as to EPS (earnings per share). 40 have either matched expectations or fallen short. Of the 186 that beat estimates, those beats have averaged 22% higher than the estimate. That's crazy earnings acceleration and will eventually be reflected in a much higher S&P 500, in my opinion. Don't lose sight of these numbers, because Wall Street has a way of trying to make us forget by focusing on headlines that do not matter in the long run.
Model ETF Portfolio
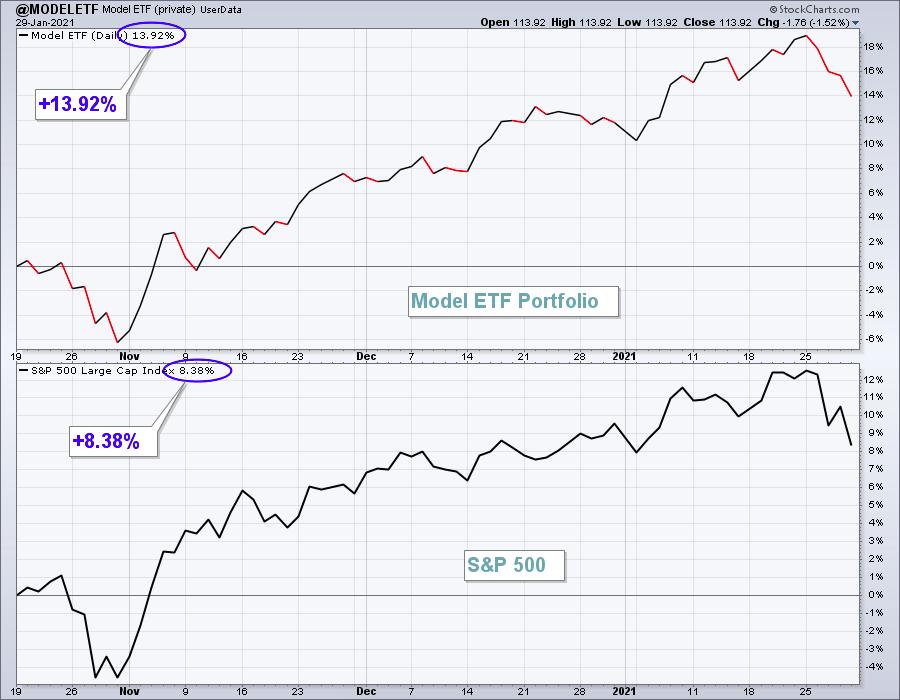
We just completed our first full week of our latest Model ETF Portfolio selections. We continue to maintain a sizable advantage over the S&P 500 since the Model ETF Portfolio's inception on October 19th, 2020, but we did give back a bit of that cumulative advantage last week.
Here's the updated inception-to-date chart of the Model ETF Portfolio:
Here are how the Model ETF Portfolio component ETFs performed last week:
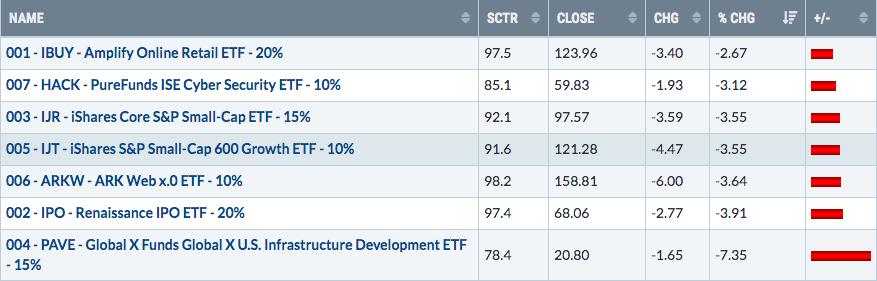
6 of our 7 ETFs traded roughly the same of the S&P 500, but PAVE failed to keep up with either its sector - industrials - or the benchmark S&P 500.
Happy trading!
Tom Bowley, Chief Market Strategist
EarningsBeats.com
"Better timing. Better trades."