
EB Weekly Portfolio Report - Sunday, March 7, 2021
Special Note
Before I get into this week's report, I wanted to paraphrase a few questions that I received from members late last week and my response:
Question: Have the portfolios (excluding the Income Portfolio) underperformed like this in the past?
Answer: Since the inception of our various portfolios, the Income Portfolio has been the weakest performer, but during a bull market, I'd expect the others to outperform this more defensive, more income-oriented portfolio. But let me turn my attention to the other three portfolios and our past history.
We had one other very similar situation to what we've experienced during the first two weeks of this quarter. When we first started the Strong AD Portfolio on May 19, 2020, the timing could not have been worse. This portfolio was invested in 10 growth names that were performing very well during the initial stages of the pandemic (March through May). From May 19th through June 8th, the Strong AD Portfolio lost 1.1%, which might not seem to be that bad on the surface. But the S&P 500 moved from 2922.94 on May 19th to 3232.39 on June 8th, representing a 310 point gain, or a 10.6% gain. So our Strong AD Portfolio underperformed the S&P 500 by 11.7% in just 3 weeks. It recovered by August 19th to beat the S&P 500, +19.35% vs. +15.46%.
That's probably been the best comparison to what we've seen the past couple weeks. The stock market's "theme" of investing in growth changed to investing in value. Our Strong AD portfolio owned NVDA, AMZN, PTON, NFLX, EA, WORK, VRTX, PYPL, WING, and MASI during that May-Aug 2020 period. These were growth stocks designed to benefit from the pandemic. When the stock market favored value stocks from May 19th to June 8th, our Strong AD Portfolio suffered significantly. That's, in a nutshell, the same thing we've dealt with over the past couple weeks. We're set up for outperformance by growth stocks and money has been consistently rotating to value.
I'm not a Registered Investment Advisor, so I cannot provide financial advice to any of our members. Nor would I want to since I don't have any knowledge of financial background, goals, objectives, etc. But I what I can say is that these portfolios are designed to provide education for our members. We hold them through everything for three months, then we reassess the market and select another 10 equal-weighted stocks to include in each of our portfolios for the next quarter. Because we do not adjust our portfolios, we're certainly subject to some whipsaw as market conditions and themes change. That's true of any portfolio, fund, ETF, etc., that is not actively-managed day-to-day.
This is a long response, but a great question. The key ratio to watch as we move forward is the IWF:IWD (growth vs. value). That ratio has tumbled from 1.73 on the February 19th close to the 1.54 low on Friday. In my opinion, this relative weakness of ours isn't about poor stock selection, it's more about the shift in the market towards value stocks. If we see this ratio rise back to 1.73 and our portfolios are still significantly underperforming, then that would likely be the result of poor stock selection or poor sector allocation.
Looking ahead, I'm still of the opinion that our GDP grows much, much stronger than most are forecasting. I also believe our interest rates will remain very low historically, even if they do climb a bit more in 2021. While the media continues its narrative that higher interest rates are bad for the stock market, I completely disagree. Rising rates are a reflection of a strengthening economy ahead, so bond investors sell bonds (which, in turn, causes interest rates to rise) and then buy stocks. If I'm correct about the economic environment going forward, I do not believe that growth stocks will take a long-term back seat to value stocks. When the theme of "growth" returns, so too will our portfolios, or at least that's what I'd expect. That is all in my opinion, of course.
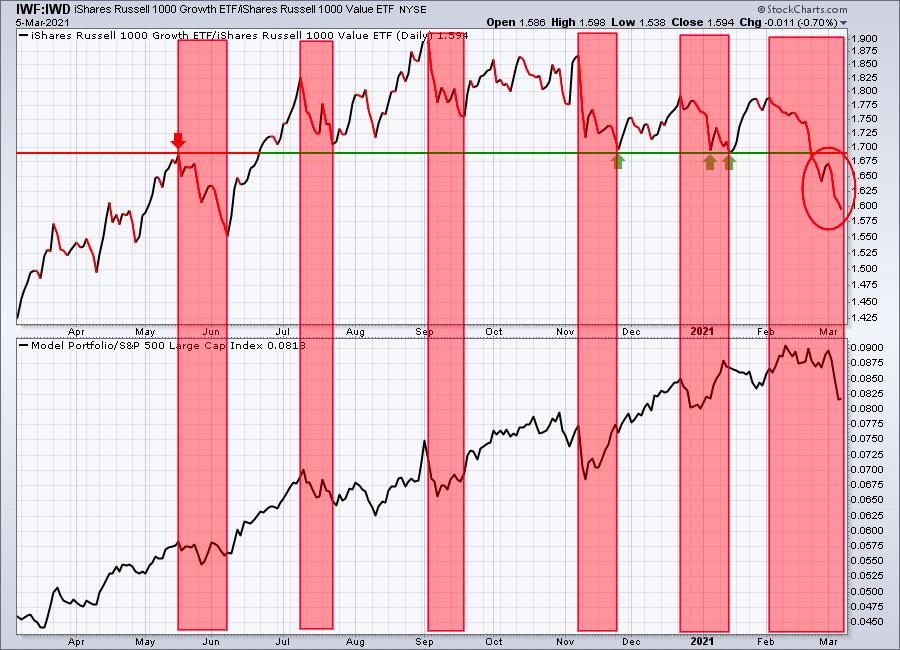
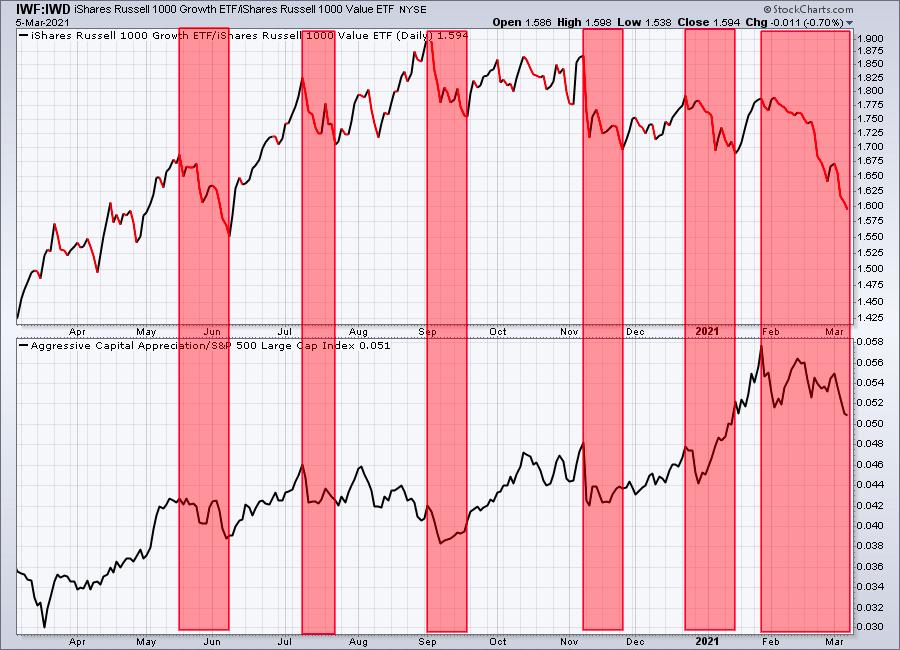
To visualize the importance of the IWF:IWD on our portfolio performance, I'm including three charts for the Model, Aggressive, and Strong AD Portfolios, highlighting in red-shaded areas the periods in which the IWF:IWD ratio dropped significantly (growth stocks underperformed). The lower panel of the chart highlights the relative performance of our portfolios vs. the benchmark S&P 500:
Model Portfolio:
Aggressive Portfolio:
Strong AD Portfolio:
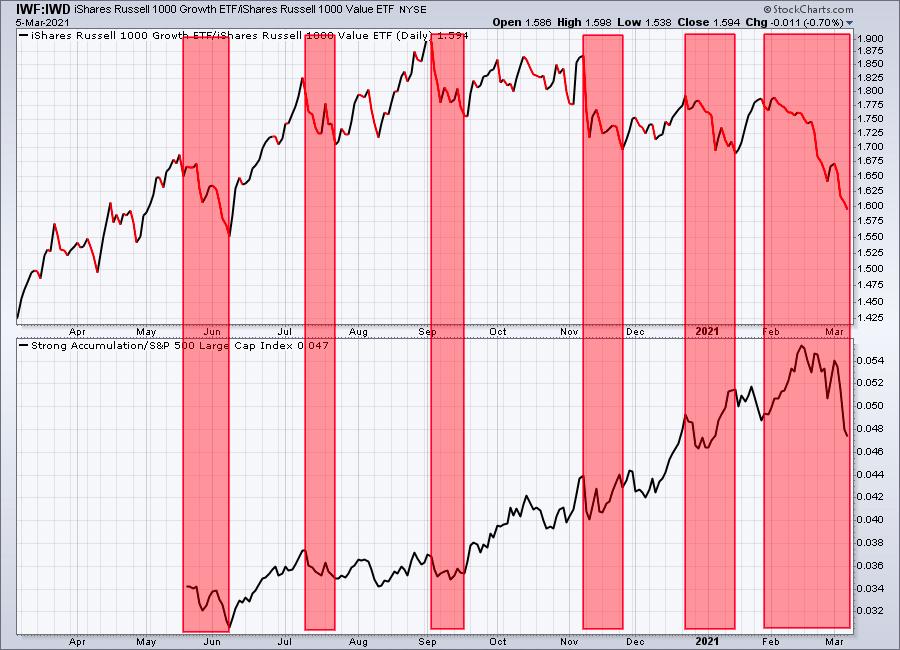
We don't see our portfolios take a hit every time the IWF:IWD falters and that's most likely the result of sticking with leading stocks in leading industry groups. But clearly, the direction of the IWF:IWD growth vs. value ratio is a MAJOR factor in our performance. The ratio's precipitous decline over the past 5 weeks, coupled with underperformance by both technology (XLK) and consumer discretionary (XLY) has impacted our portfolios significantly.
Upcoming Earnings Reports
According to Zacks.com, the following companies will be reporting earnings this week and each is a component of one of our portfolios:
Monday, March 8: None
Tuesday, March 9: None
Wednesday, March 10: None
Thursday, March 11: None
Friday, March 12: None
PLEASE NOTE: The above companies were provided after scanning the Zacks Earnings Calendar. My research is limited to what Zacks provides and I also can make a mistake from time to time, so please check for earnings dates for all companies that you own. We do hold our portfolio stocks through one earnings report, but every EarningsBeats.com member must make their own investing/trading decisions about holding stocks into earnings reports as it's the most volatile (risky) time to own a stock.
Portfolio Rules and Objectives
Here are the common traits and objectives of our portfolios:
- There are 10 leading stocks from up to 10 leading industries in each portfolio (at the time of selection). Generally, there will only be one stock per industry group, but there could be exceptions.
- They are held for an entire 90 day period, with no stops in place. We strive for consistency, transparency, and simplicity in our portfolios. EB.com members may hold these stocks for the entire 90 days, trade them, use stops, etc., but for purposes of our calculation, we will make no exceptions to our "buy and hold for three months" strategy.
- Every stock will generally be held through ONE earnings report
- The expectation is that relative winners will carry the portfolio to outperformance
- They were all entered into as of the close on Friday, February 19th; members may choose to try to time better entries, but EB.com "purchased" as of February 19th's closing price
- Primary objective is to outperform the benchmark S&P 500
Here are several considerations for EB members:
- I would expect the Strong AD and Aggressive portfolios to be the riskiest, followed by the Model portfolio, and then the Income portfolio
- The Strong AD portfolio will be selected from a combination of rising accumulation/distribution lines and SCTRs above 80 at the time of selection. It is the only portfolio that does NOT require a revenue and EPS beat in its most recent quarterly earnings report
- The Income portfolio stocks will all pay dividends, with the expected average dividend yield to be at least 1.0%
- Drawdowns (losses) should be much milder on the Income portfolio, with more volatility expected on the other three; please review inception-to-date charts below to gain an idea of the volatility associated with each
- I believe the larger drawdown on the Income portfolio at the beginning of the pandemic was an anomaly, occurring as many defensive, higher-yielding companies uncharacteristically underperformed during a market decline.
- You should own or trade these stocks in whatever manner is most comfortable for you; while we will buy all 10 stocks in the manner identified above, feel free to trade certain stocks or wait for pullbacks if the stocks are overbought
- We have no idea what risk each member is willing or able to take. We are not registered investment advisors so be sure you understand the risk you take. Please consult your financial advisor.
- EarningsBeats.com shareholders/employees may own all or some of the portfolio stocks from time to time.
Weekly Snapshot
Here's a weekly recap:
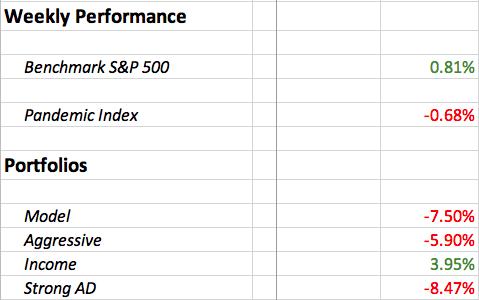
The flight from growth stocks to value stocks continued last week and had a very negative impact on our portfolio performance. Our Income Portfolio performed well, but it has limited exposure to the technology sector, which has served it well this quarter thus far.
Weekly Summary
Benchmark S&P 500:
The S&P 500 gained 0.81%, though it was an extremely volatile week. This benchmark index has fairly solid support in the 3600-3700 area as reflected below:
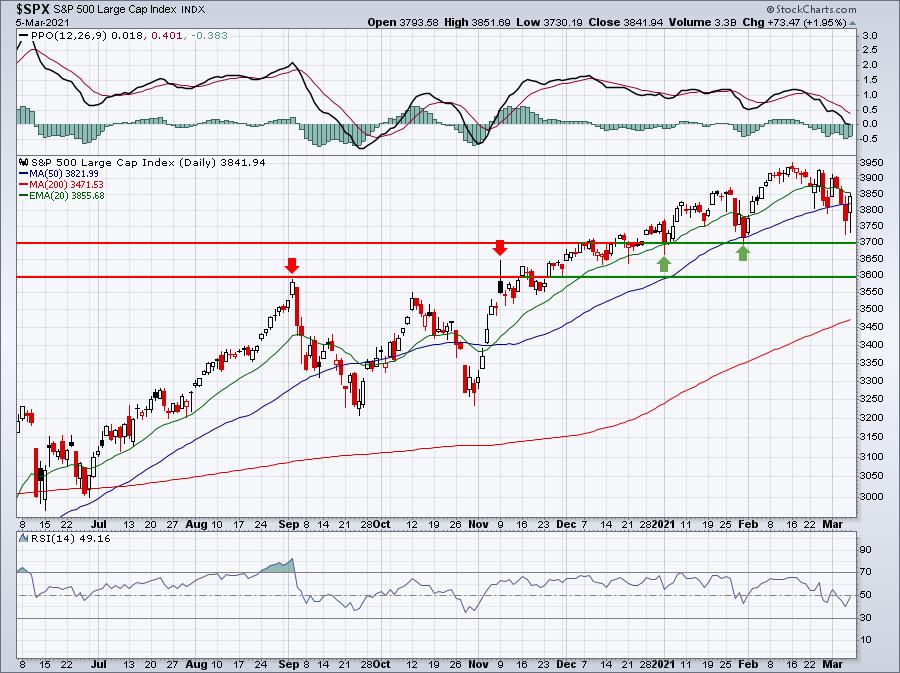
To the upside, keep an eye on the now-declining 20-day EMA. Failure to clear that moving average and a subsequent new short-term low would confirm a short-term downtrend remains in play.
Model Portfolio:
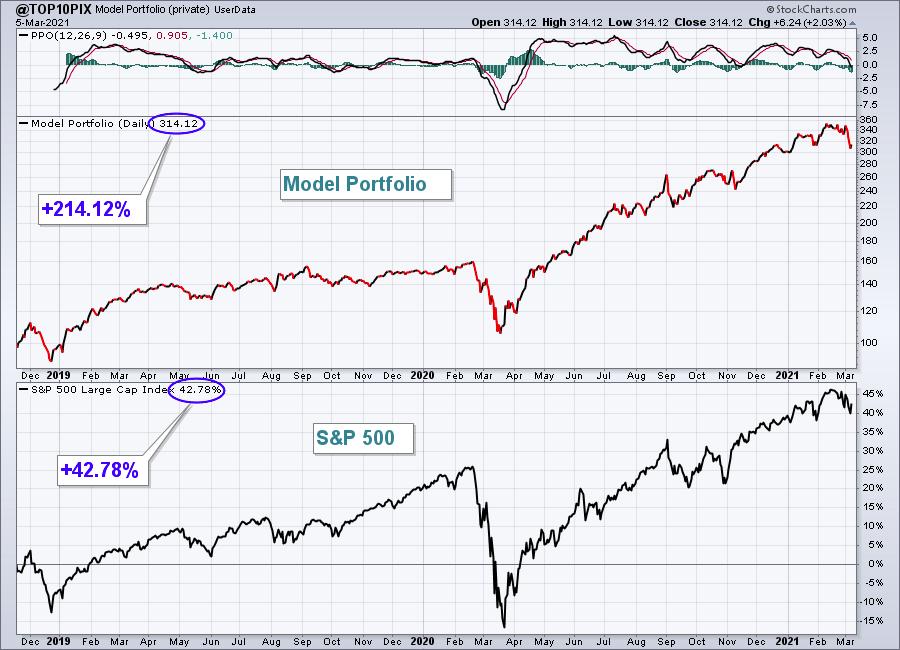
The Model Portfolio lost 7.50%, trailing the S&P 500 significantly last week. Here's the updated inception-to-date chart of the portfolio:
Here are how the Model portfolio component stocks performed last week:
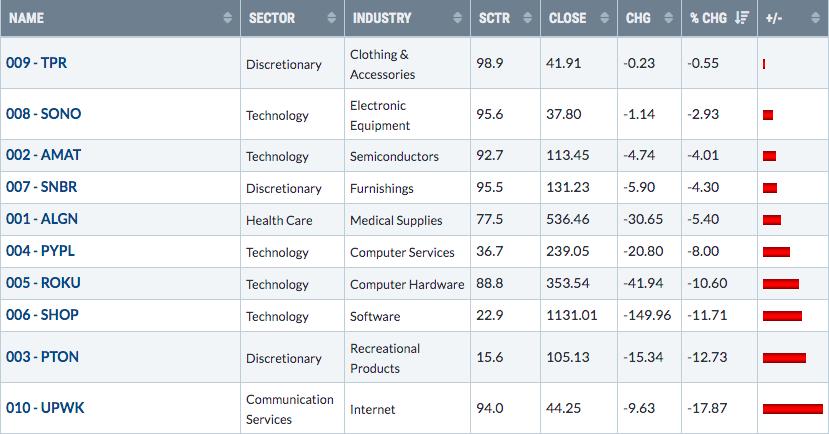
I mentioned last week that PTON could test its November price low and it did that before rebounding. For this week, let's look at UPWK:
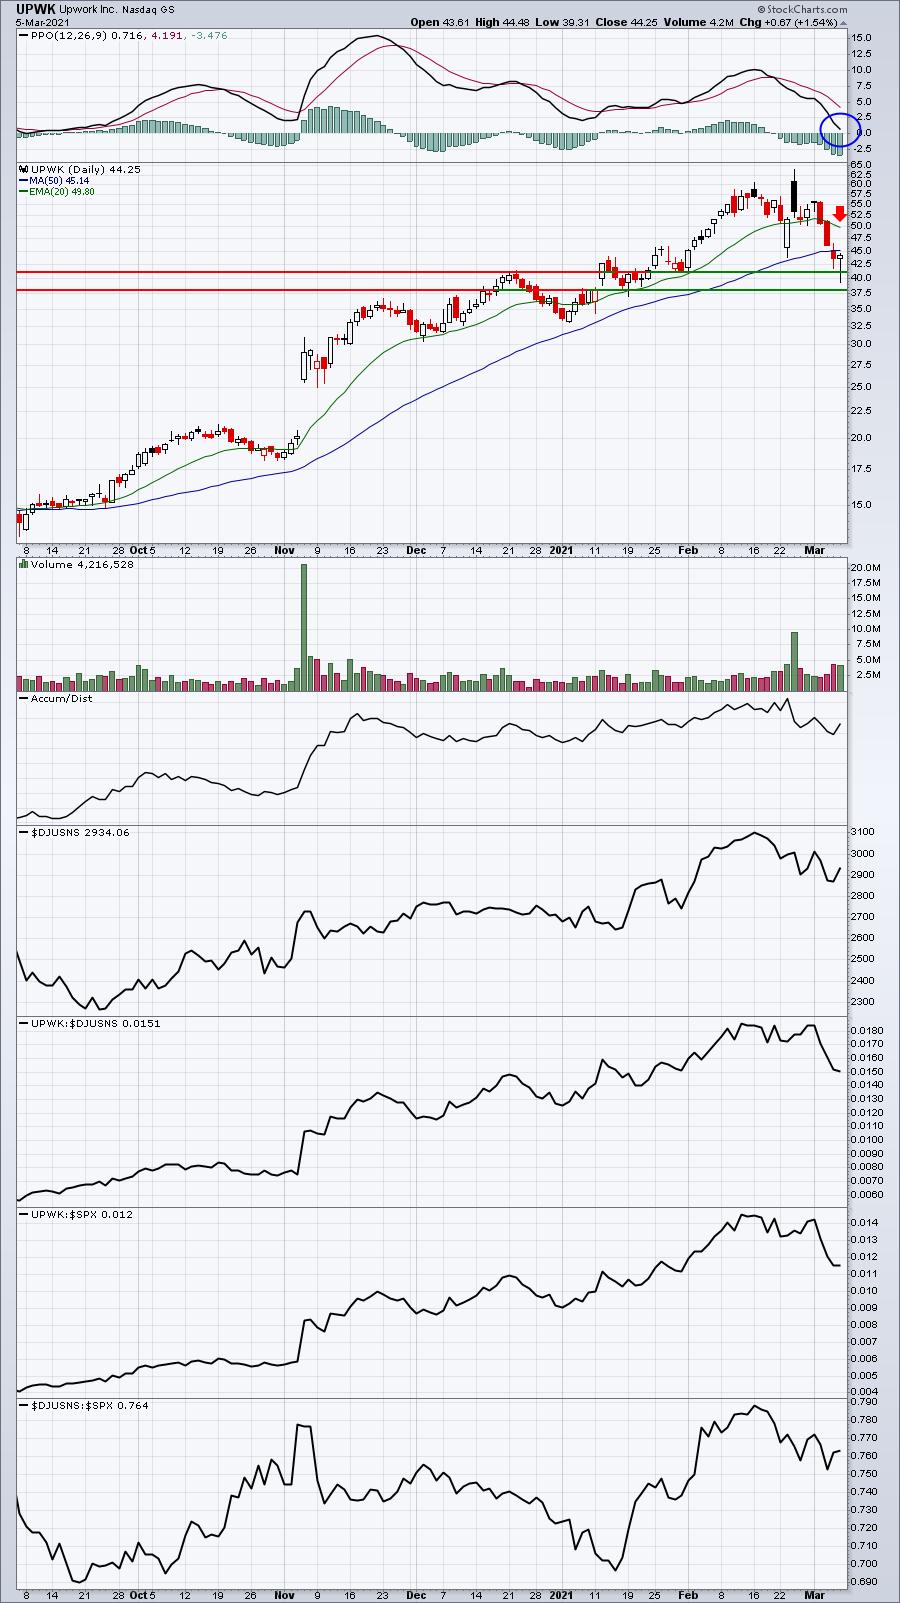
I like the chart on UPWK, but there are challenges ahead. First, does the support hold? And if it does, and the 20-day EMA is tested, can UPWK close back above it? Relative strength and the AD line suggests UPWK will be fine further down the road, but the short-term remains dicey.
Aggressive Portfolio:
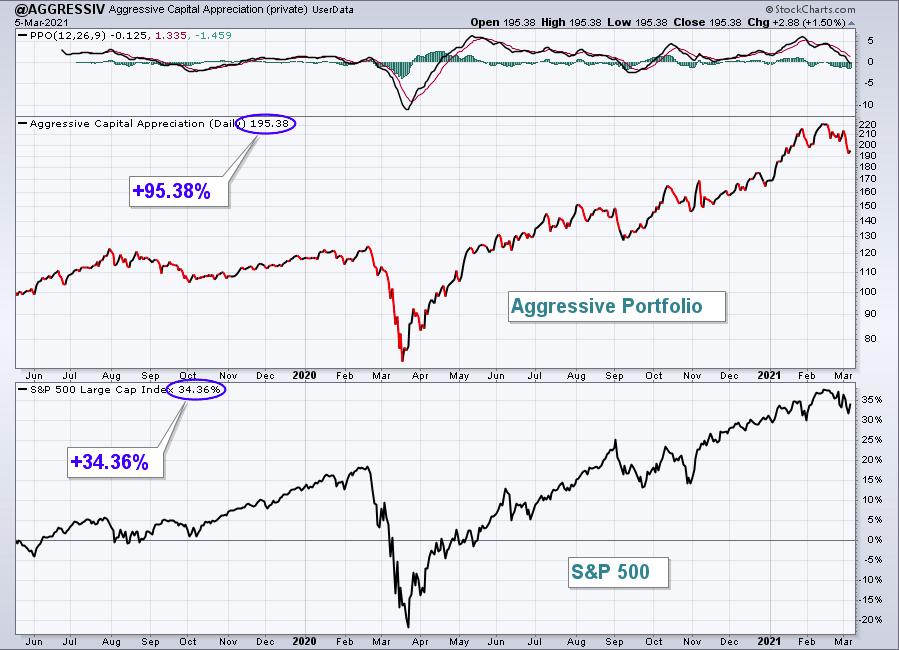
The Aggressive Portfolio fell 5.90%, losing additional ground to the benchmark S&P 500. Here's the updated inception-to-date chart of the portfolio:
Here are how the Aggressive portfolio component stocks performed last week:
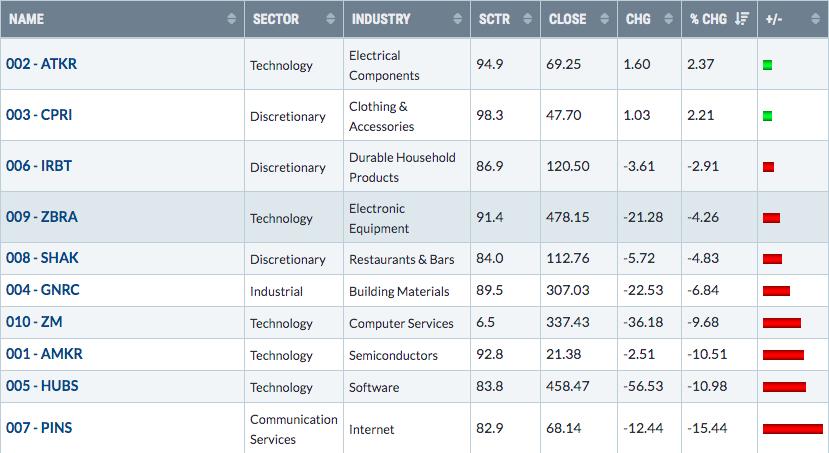
Like UPWK, PINS is in the internet space ($DJUSNS), so one key will be how the group performs next week. ZM lost nearly 10% last week, but it did rebound at, what I believe, is the most important support level on its chart:
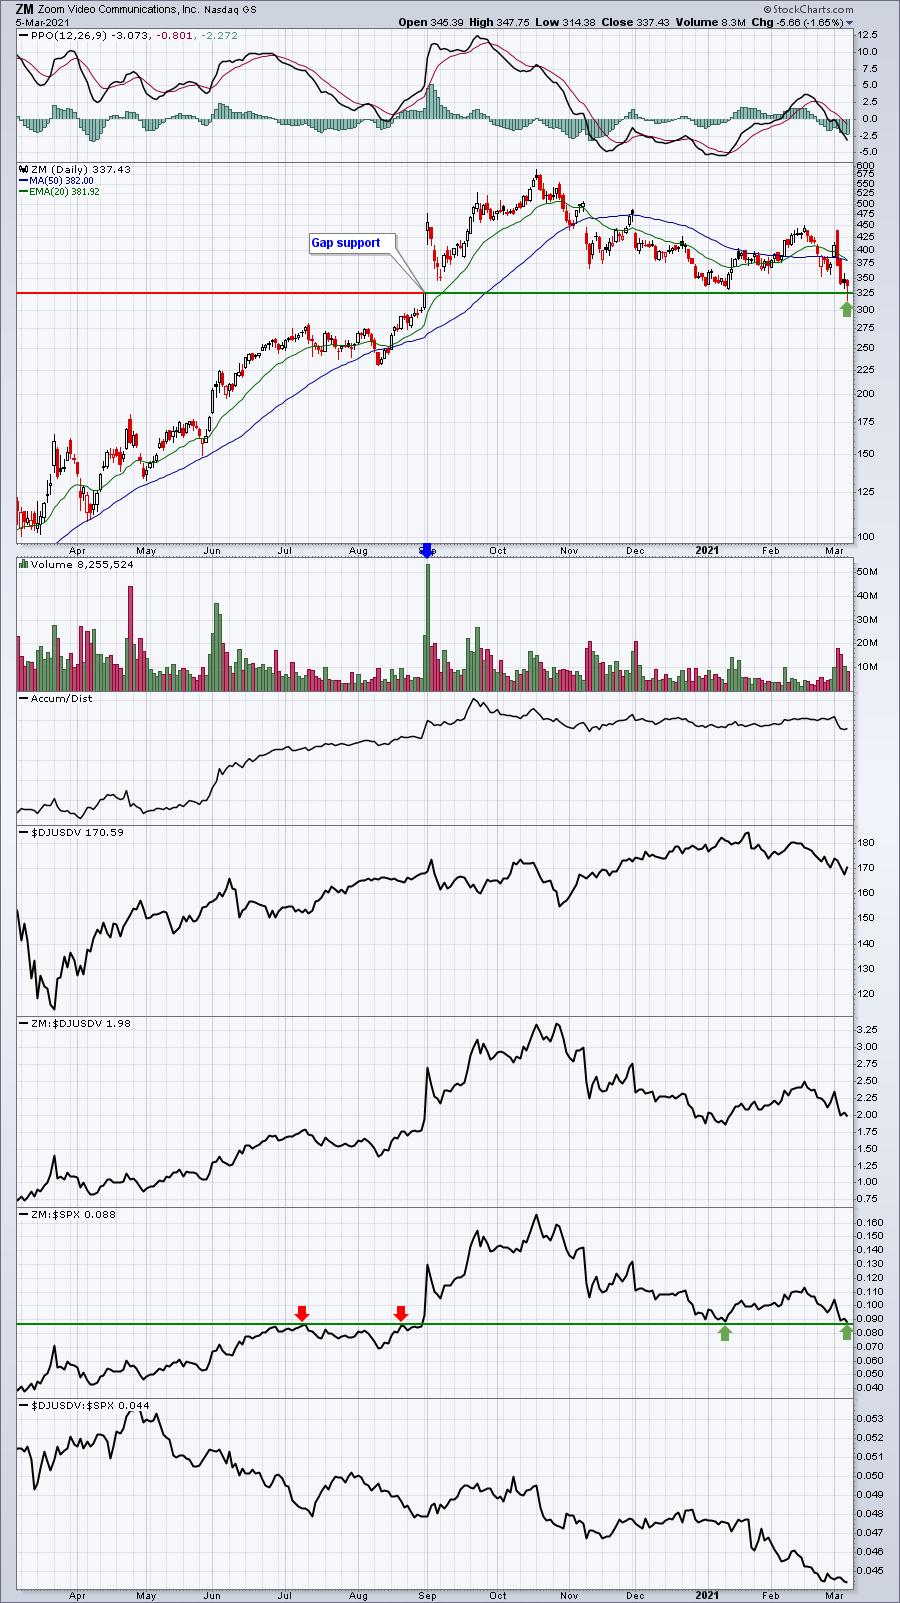
Note that ZM, in addition to testing important gap support, is also testing its price relative support level vs. the S&P 500. It's important for ZM to hold both of these support levels.
Income Portfolio:
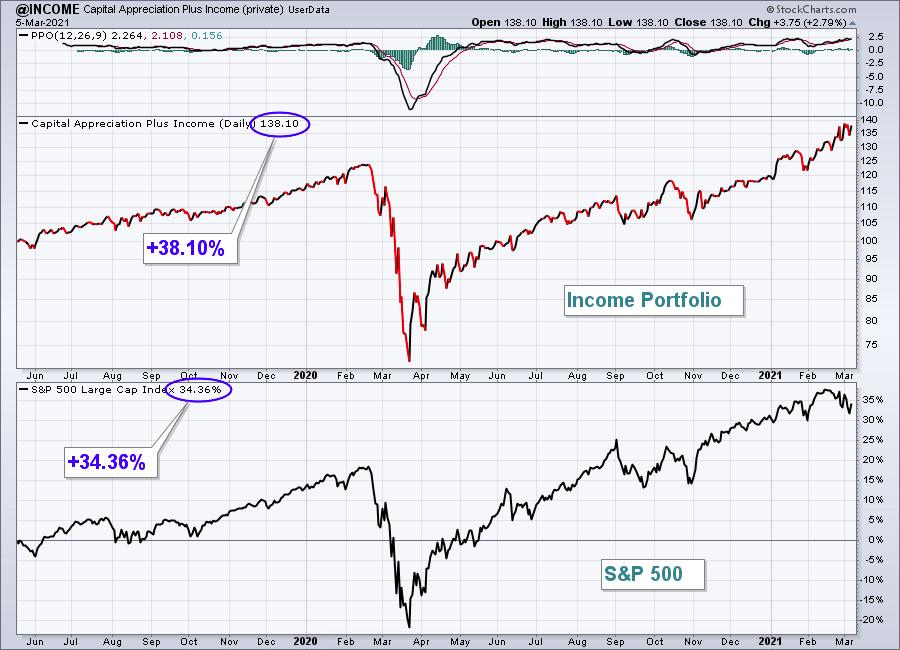
The Income Portfolio gained 3.95%, and is now comfortably ahead of the S&P 500 since the portfolio's inception. Here's the updated inception-to-date chart of the portfolio:
Here are how the Income portfolio component stocks performed last week:
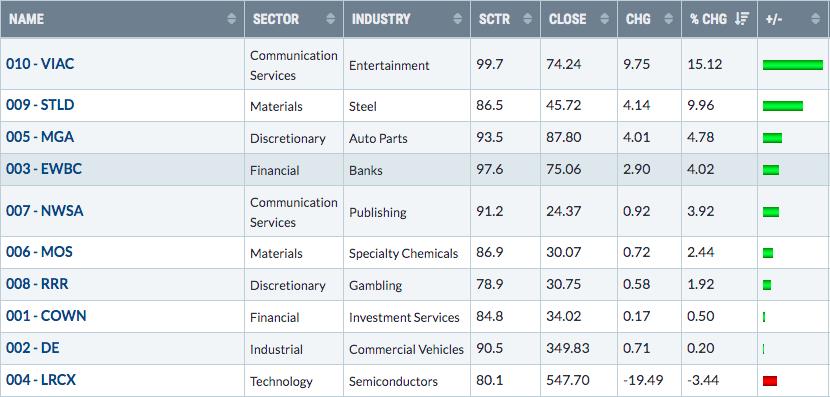
9 of 10 component stocks gained ground last week, which was amazing given the overall market performance. This portfolio benefited from owning just one technology stock (LRCX), which, by the way, was the portfolio's lone loser last week.
Strong AD Portfolio:
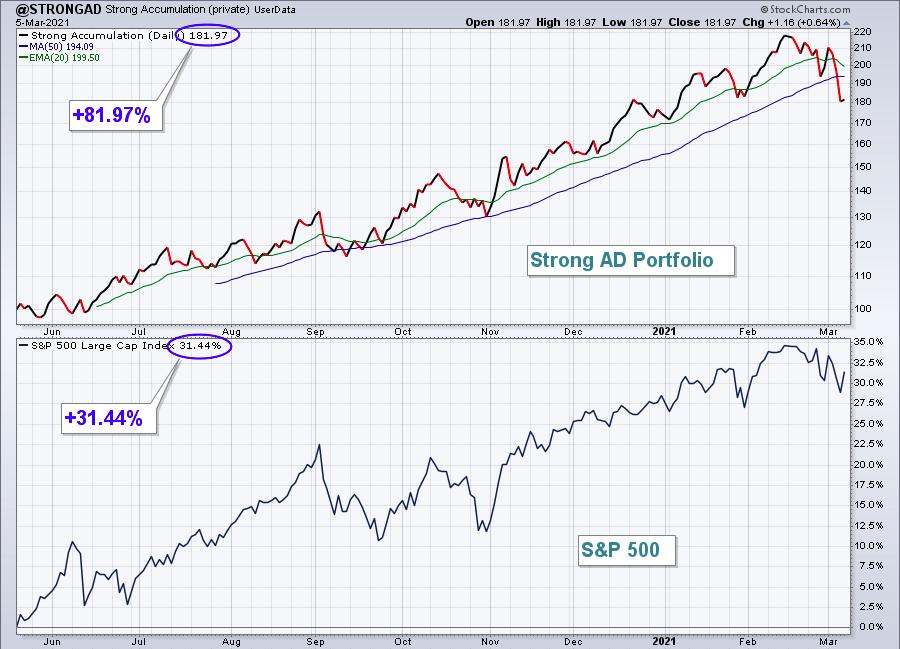
The Strong AD Portfolio dropped 8.47%, having one of its worst weeks since its inception in May 2020. Here's the updated inception-to-date chart of the portfolio:
Here are how the Strong AD portfolio component stocks performed last week:
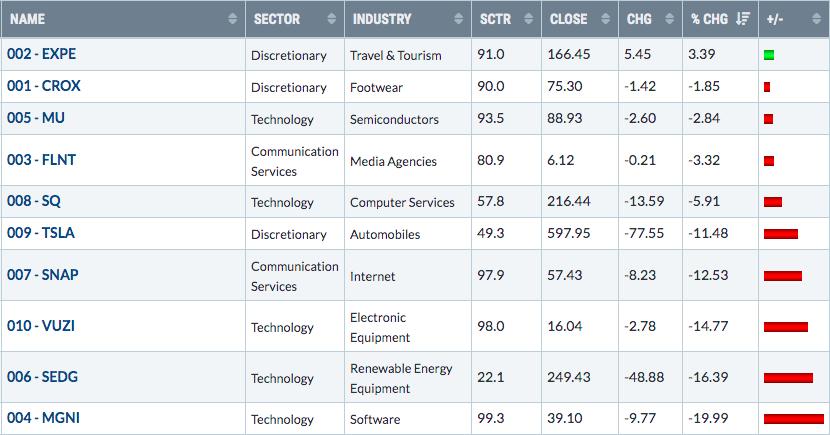
The growth stocks in our Strong AD Portfolio were hammered last week. As bad as the week was, it was MUCH worse mid-morning on Friday before a significant reversal. MGNI, for instance, traded below 34 on Friday before a big rally:
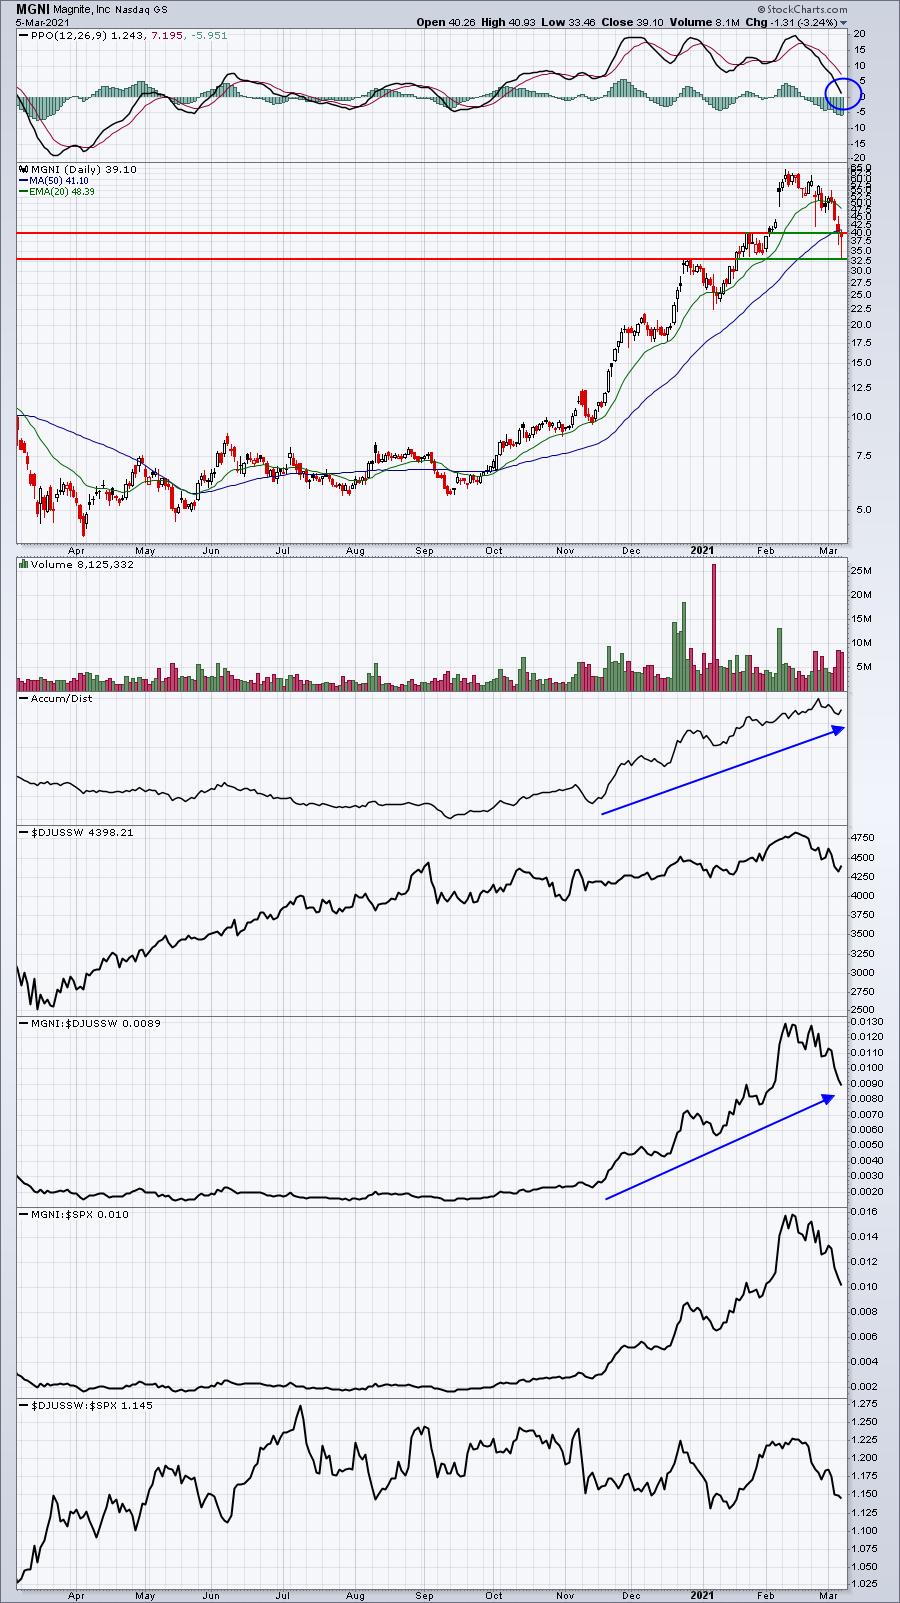
Corrections can be severe in stocks that gain so much during rallies. That's been the case here with MGNI. I do still like the overall relative strength in MGNI and, based on its strong AD line, I expect that the current selling is being looked upon as an opportunity by institutions. We'll find out in time.
Summary
Excluding the Income Portfolio, it was a brutal week for our portfolios. Conditions simply were not conducive to gains as growth companies were routinely sold - as a group. It wasn't that certain areas of growth stocks were being sold. It was that nearly every growth stock was being sold. While the recovery on Friday felt much better than the alternative, we still have work to do on that IWF:IWD chart. Here's how it looks on a very short-term 10-day, 10-minute chart:
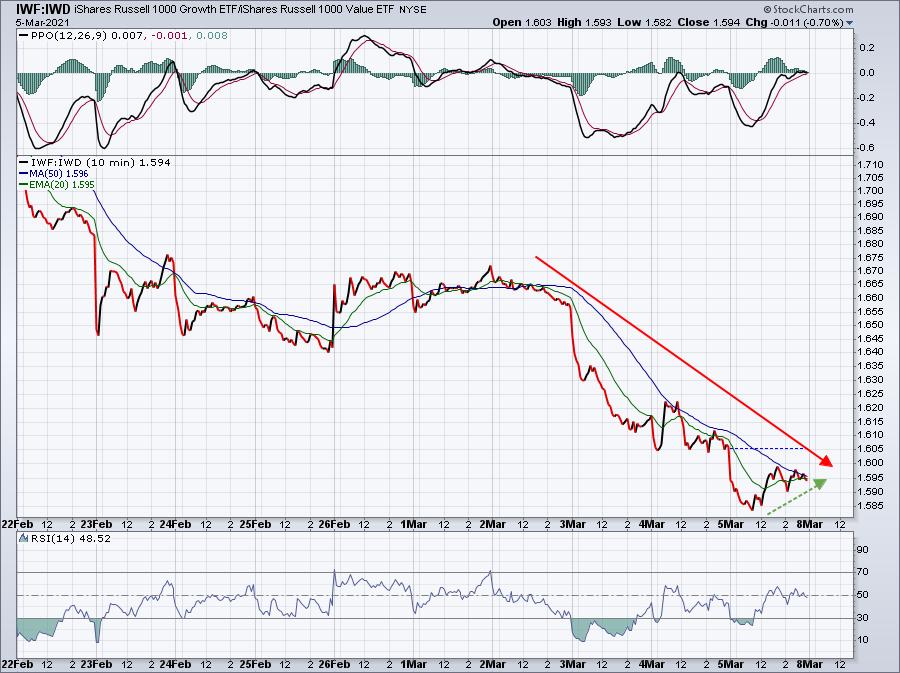
We need to keep in mind that March is not typically kind to technology (XLK) and consumer discretionary (XLY) stocks. I've said recently on a few occasions that we need to temper our expectations until we begin to make our next earnings run higher. I certainly don't expect to see a continued panicked selloff, but I can't rule it out either. Based on my belief of stronger economic activity ahead, I expect that growth will eventually outperform again. The question, in my view, will be the timing.
Model ETF Portfolio
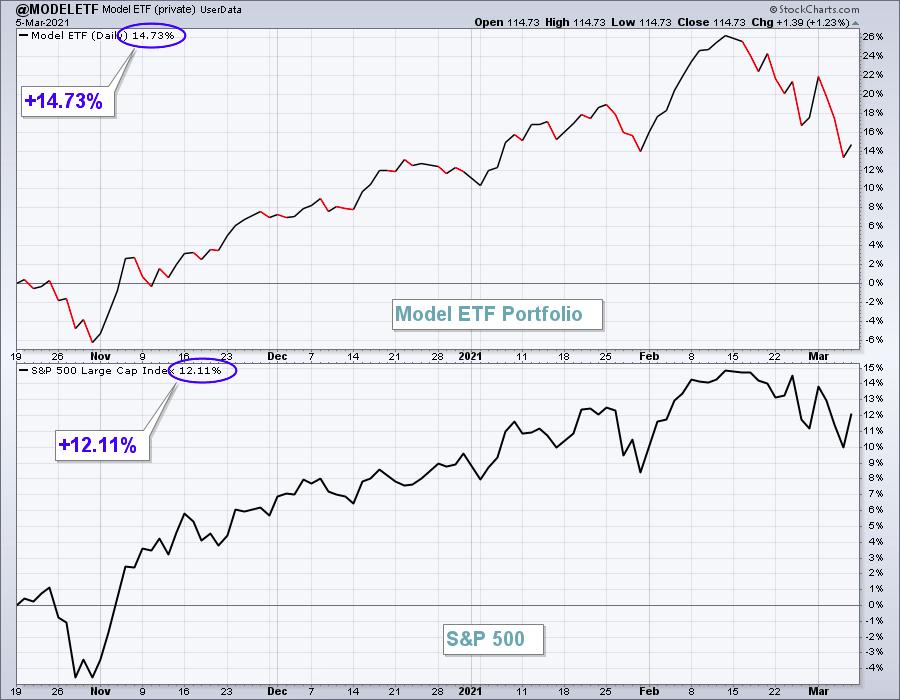
Our Model ETF Portfolio also took it on the chin last week, dropping 2.44% as the growth portion of our Model ETF portfolio took another big hit last week. I was looking for a rebound in growth last week that never really materially, with the exception of Monday.
Here's the updated inception-to-date chart of the Model ETF Portfolio:
Here are how the Model ETF Portfolio component ETFs performed last week:
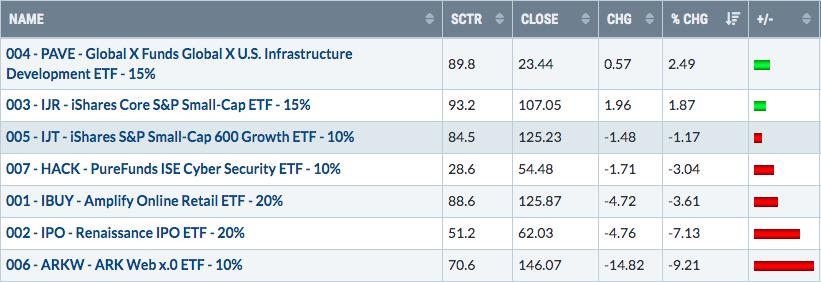
There are a lot of growth stocks in those bottom 5 ETFs that all lost ground last week to varying degrees.
Happy trading!
Tom Bowley, Chief Market Strategist
EarningsBeats.com
"Better timing. Better trades."