
EB Weekly Portfolio Report - Sunday, March 21, 2021
Upcoming Earnings Reports
According to Zacks.com, the following companies will be reporting earnings this week and each is a component of one of our portfolios:
Monday, March 22: None
Tuesday, March 23: None
Wednesday, March 24: None
Thursday, March 25: None
Friday, March 26: None
PLEASE NOTE: The above companies were provided after scanning the Zacks Earnings Calendar. My research is limited to what Zacks provides and I also can make a mistake from time to time, so please check for earnings dates for all companies that you own. We do hold our portfolio stocks through one earnings report, but every EarningsBeats.com member must make their own investing/trading decisions about holding stocks into earnings reports as it's the most volatile (risky) time to own a stock.
Portfolio Rules and Objectives
Here are the common traits and objectives of our portfolios:
- There are 10 leading stocks from up to 10 leading industries in each portfolio (at the time of selection). Generally, there will only be one stock per industry group, but there could be exceptions.
- They are held for an entire 90 day period, with no stops in place. We strive for consistency, transparency, and simplicity in our portfolios. EB.com members may hold these stocks for the entire 90 days, trade them, use stops, etc., but for purposes of our calculation, we will make no exceptions to our "buy and hold for three months" strategy.
- Every stock will generally be held through ONE earnings report
- The expectation is that relative winners will carry the portfolio to outperformance
- They were all entered into as of the close on Friday, February 19th; members may choose to try to time better entries, but EB.com "purchased" as of February 19th's closing price
- Primary objective is to outperform the benchmark S&P 500
Here are several considerations for EB members:
- I would expect the Strong AD and Aggressive portfolios to be the riskiest, followed by the Model portfolio, and then the Income portfolio
- The Strong AD portfolio will be selected from a combination of rising accumulation/distribution lines and SCTRs above 80 at the time of selection. It is the only portfolio that does NOT require a revenue and EPS beat in its most recent quarterly earnings report
- The Income portfolio stocks will all pay dividends, with the expected average dividend yield to be at least 1.0%
- Drawdowns (losses) should be much milder on the Income portfolio, with more volatility expected on the other three; please review inception-to-date charts below to gain an idea of the volatility associated with each
- I believe the larger drawdown on the Income portfolio at the beginning of the pandemic was an anomaly, occurring as many defensive, higher-yielding companies uncharacteristically underperformed during a market decline.
- You should own or trade these stocks in whatever manner is most comfortable for you; while we will buy all 10 stocks in the manner identified above, feel free to trade certain stocks or wait for pullbacks if the stocks are overbought
- We have no idea what risk each member is willing or able to take. We are not registered investment advisors so be sure you understand the risk you take. Please consult your financial advisor.
- EarningsBeats.com shareholders/employees may own all or some of the portfolio stocks from time to time.
Weekly Snapshot
Here's a weekly recap:
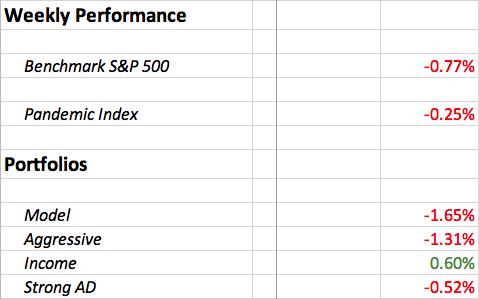
Weekly Summary
Benchmark S&P 500:
The S&P 500 climbed within one-half percent of its first test of 4000 in its history as it reached an intraday high of 3983.87 on Wednesday afternoon, an hour after the FOMC policy statement was released. But the market makers put that history-making breakout above 4000 on hold as March monthly options were set to expire at Friday's close. Rarely will you see records being broken into an options expiration. There's simply too much short-term money on the line for that. Next week could provide those records, but it's generally a good idea to remain cautious into the week following options expiration. Any calls that are exercised requires market makers to sell short, so they continue to have incentive to move prices lower the week after options expire. Historically, the Monday after options expire is the WORST day of the calendar month. That's tomorrow so just be aware of that. The Monday after options expire doesn't go down every month, but the tendency is much higher than other days throughout the calendar month.
Model Portfolio:
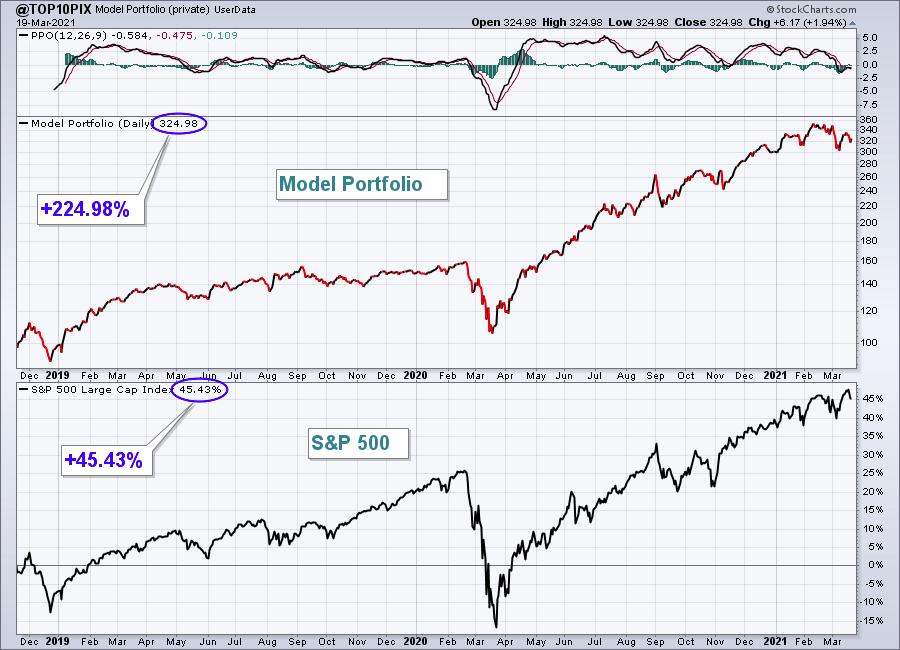
The Model Portfolio dropped 1.65%, trailing the S&P 500 by less than 1 percentage point. Here's the updated inception-to-date chart of the portfolio:
Here are how the Model portfolio component stocks performed last week:
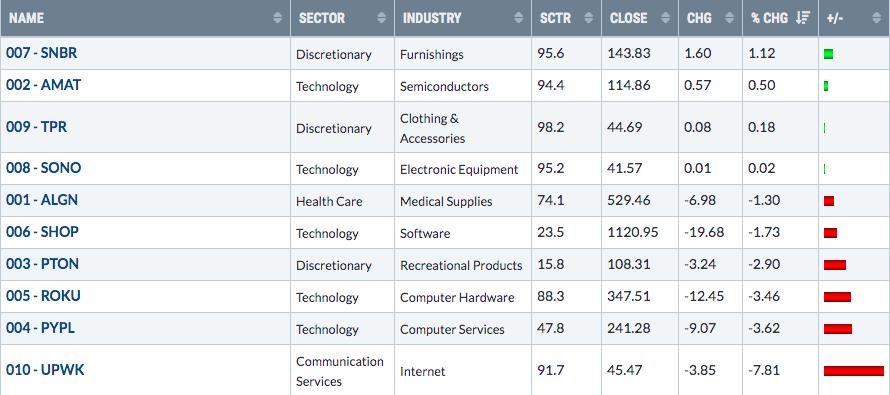
UPWK's loss was essentially the difference between our Model Portfolio and the S&P 500 last week. I didn't calculate max pain on UPWK on Tuesday, but I did calculate the estimate as of Tuesday's high using the number of open interest calls and puts as of Friday's close. This is what I came up with:
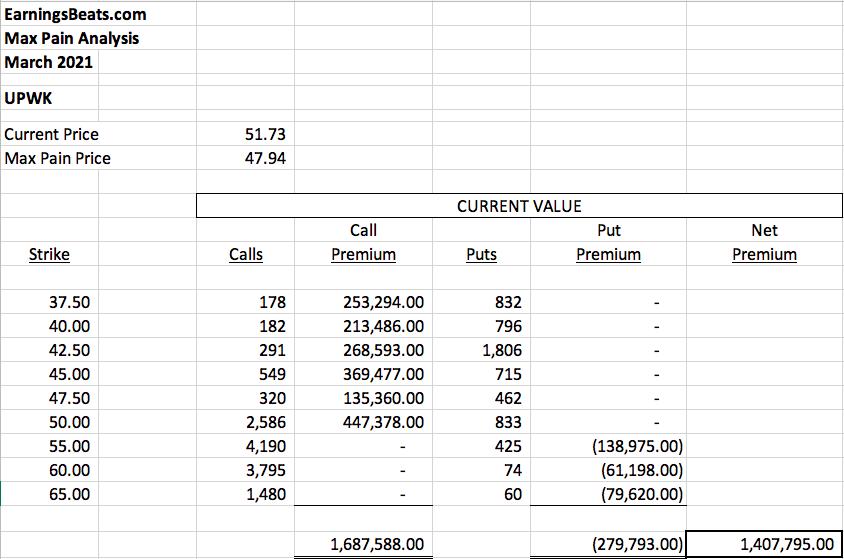
The 51.73 represents UPWK's price at Tuesday's high. Max pain was 47.94. That represented nearly an 8% decline expected simply based on max pain. As I always state, I just use max pain as a directional clue. And it was telling us that UPWK was likely to drop heading into options expiration. By Friday's low, UPWK was at 43.59, but max pain was above 47. So it then reversed back up to close at 45.47. I believe market makers were wiping out call and put premium all over the place. During the 3 days prior to Tuesday, UPWK traded in a fairly narrow range from 47.00 to 49.61. In the 3 days after Tuesday, UPWK traded in a wild, 43.59 to 51.73 range. So when I say volatility can increase significantly into options expiration, UPWK is a perfect example to illustrate this.
Aggressive Portfolio:
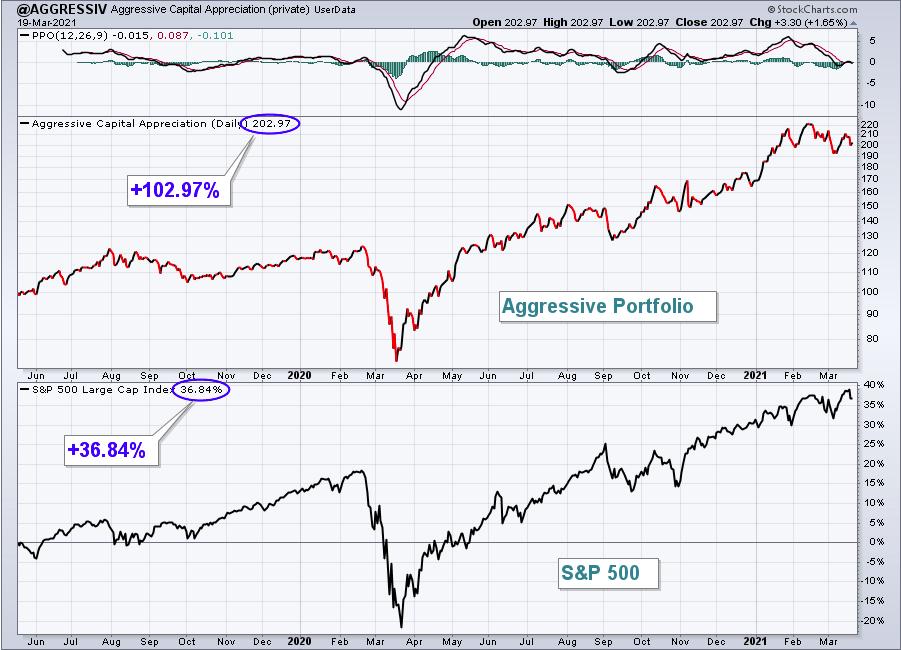
The Aggressive Portfolio gave back 1.31% last week, losing a bit of ground to the benchmark S&P 500 . Here's the updated inception-to-date chart of the portfolio:
Here are how the Aggressive portfolio component stocks performed last week:
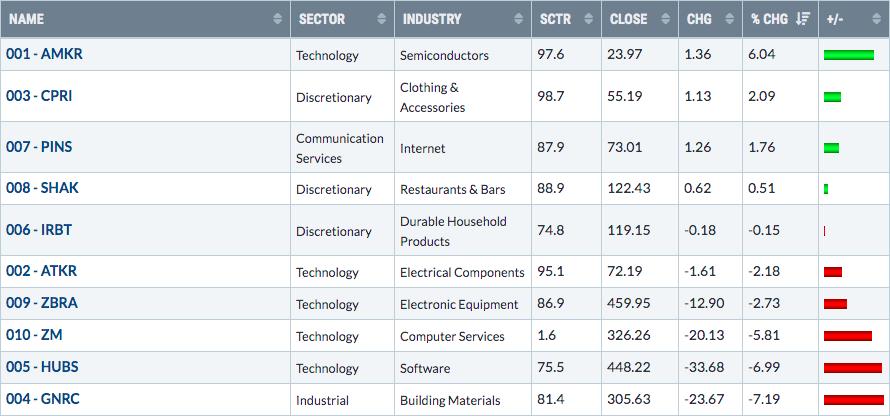
AMKR had a solid week and remains in a very bullish pattern:
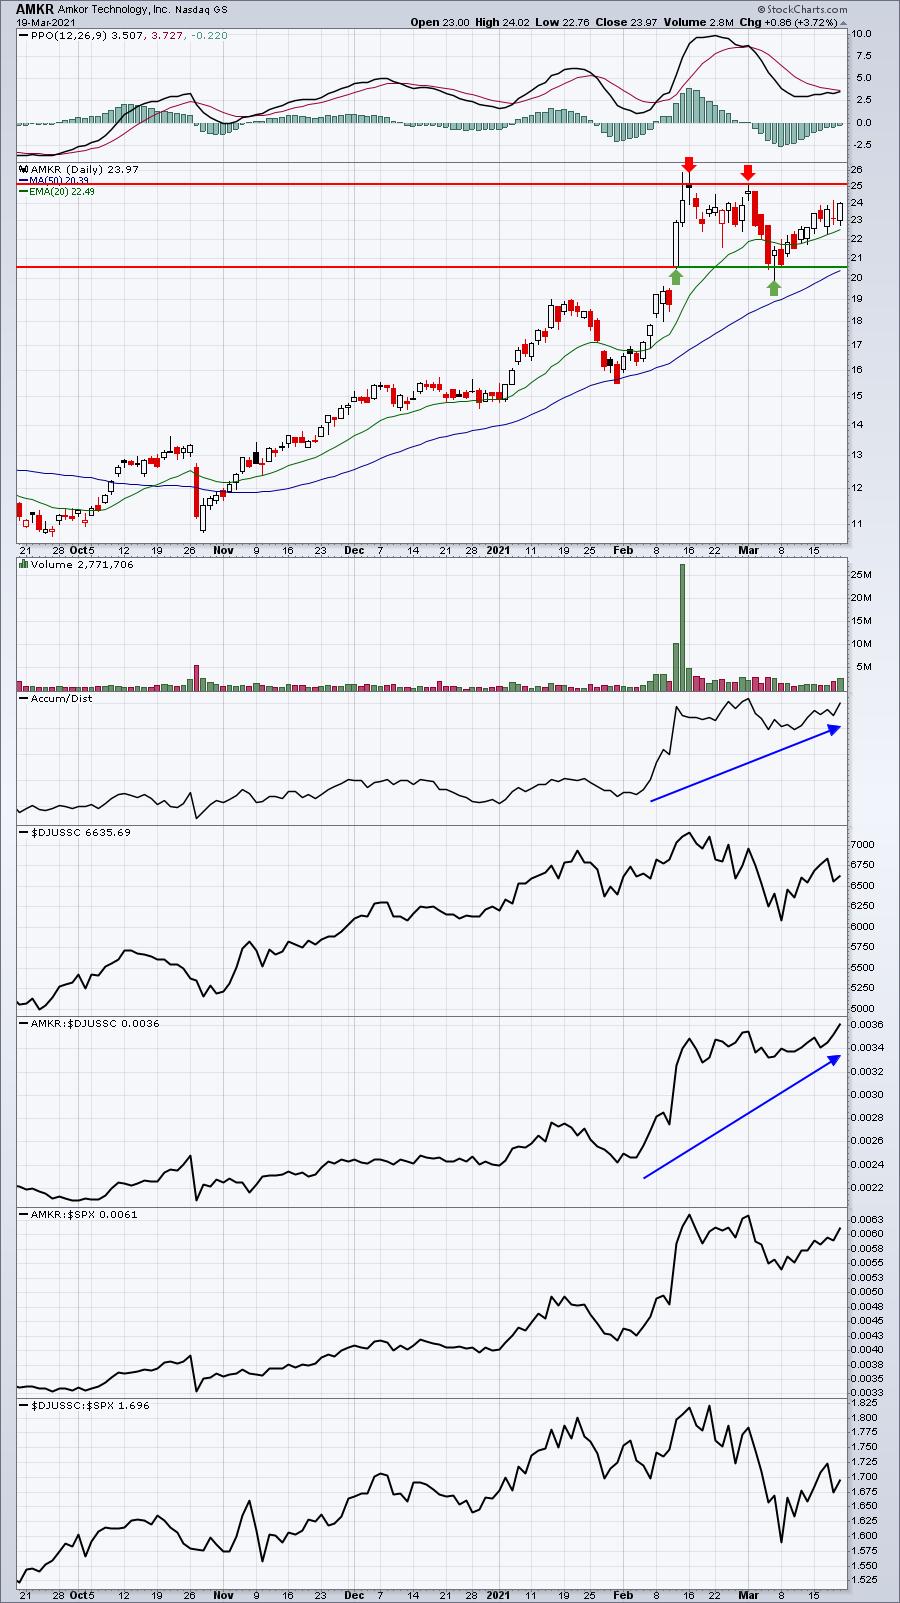
Perhaps the most bullish part of this chart is the fact that AMKR has broken out to fresh new relative highs vs. its semiconductor peers ($DJUSSC). The current price range is clear to me: roughly 20.50 support to a tad over 25.00 resistance.
Income Portfolio:
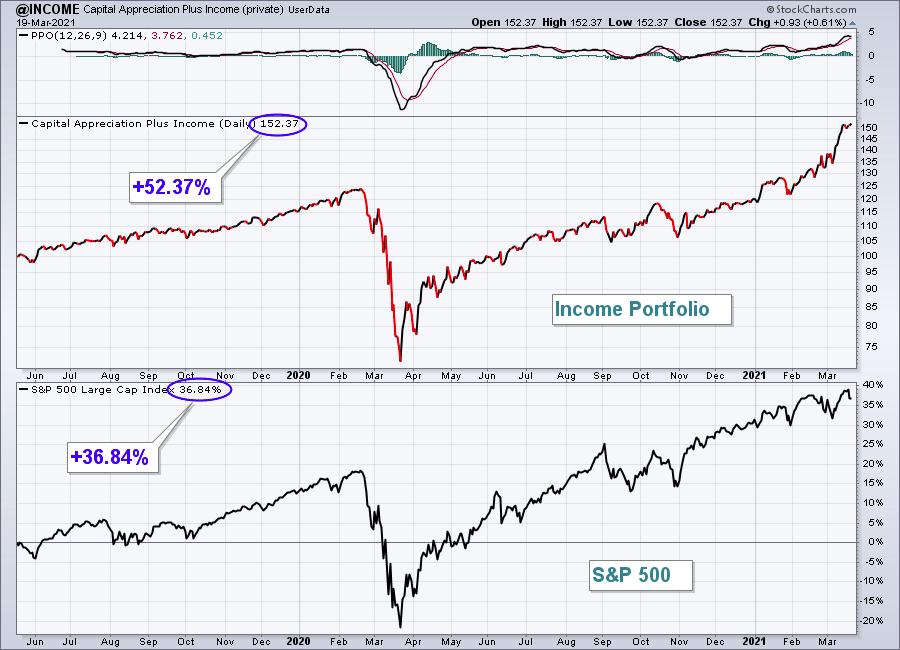
The Income Portfolio gained 0.60%, adding to a very strong first month of this quarter. Here's the updated inception-to-date chart of the portfolio:
Here are how the Income portfolio component stocks performed last week:
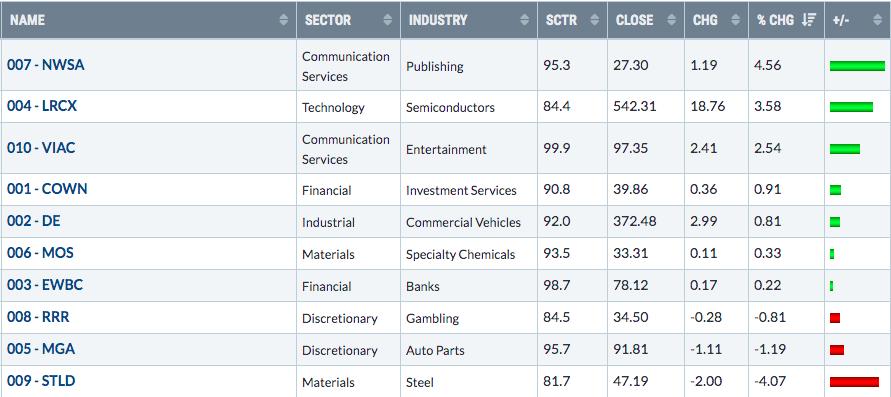
7 out of 10 component stocks finished higher last week, easily outperforming the benchmark S&P 500. The worst performer, STLD, simply pulled back to test its rising 20 day EMA. Or did it? Once again, let's look at the max pain calculation of STLD:
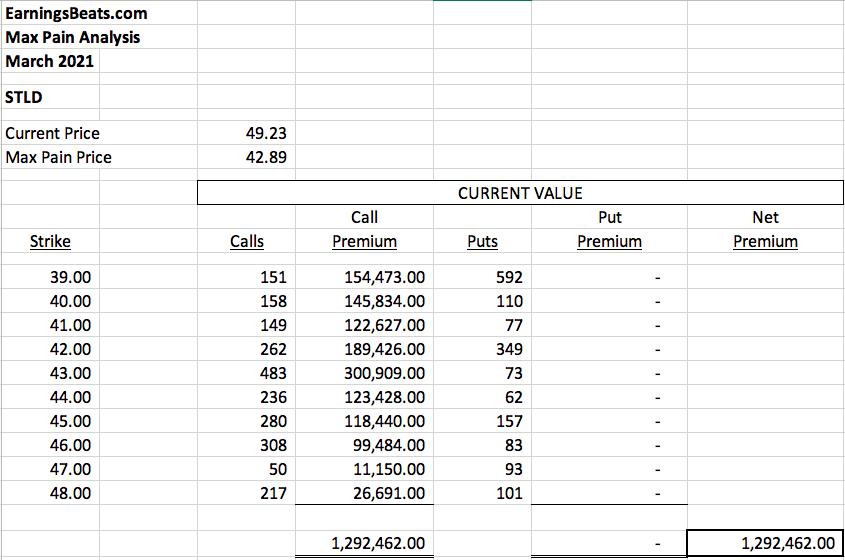
The current price of 49.23 was the Thursday high at around noon ET. Max pain to eliminate $1.3 million of option premium was at 42.89. But it was almost Friday, so there's no way a stock could be manipulated like that, right? Well, here's the 5-day 10-minute chart of STLD:
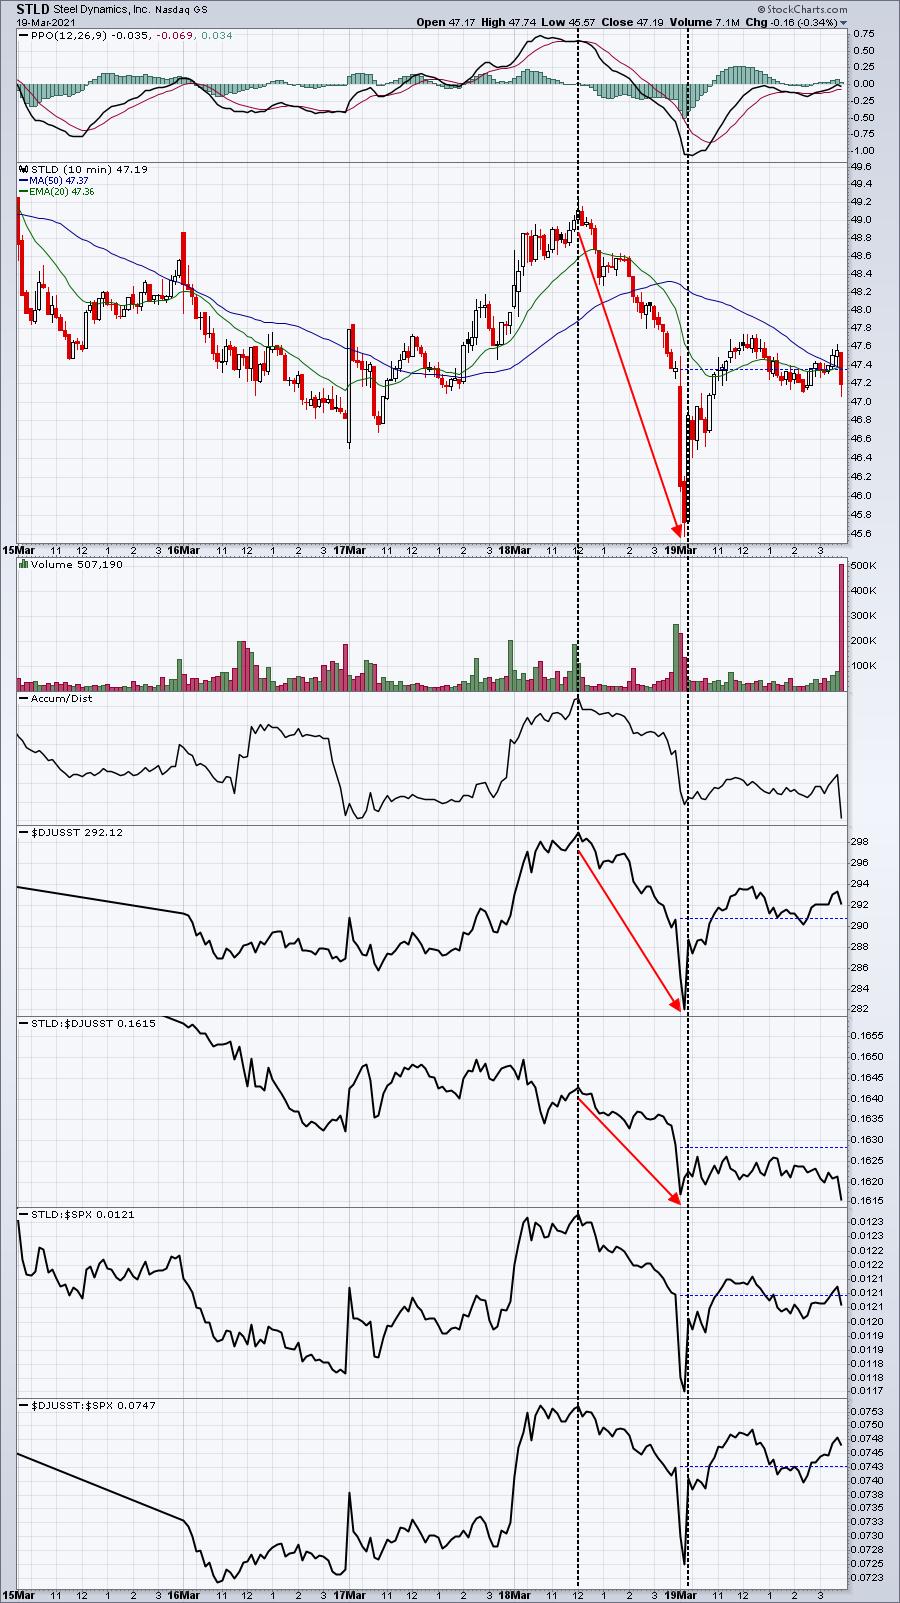
Look at the volume on Thursday during the afternoon. It was not very heavy, so it would be difficult to convince me that market makers simply started selling short to drive STLD's price lower. Then one final gap lower on Friday nearly did the trick as STLD's low was 45.57, nearly 4 bucks off the high from Thursday. At the low, most of the $1.3 million in net call premium was lost. This short-term whipsaw will have no impact whatsoever on our portfolio performance as we don't allow our emotions to force us into trades. We hold for 90 days and then close out positions on May 19th. But this type of market behavior is very important to a short-term trader who is in a potential to benefit from it (or get crushed by it).
Strong AD Portfolio:
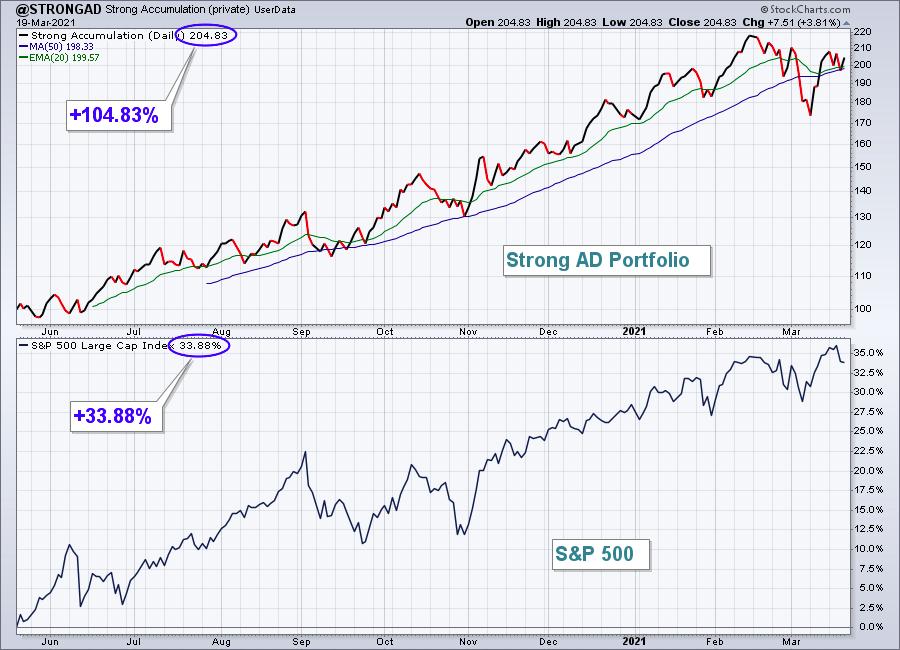
The Strong AD Portfolio fell 0.52%, but managed to slightly outperform the S&P 500. Here's the updated inception-to-date chart of the portfolio:
Here are how the Strong AD portfolio component stocks performed last week:
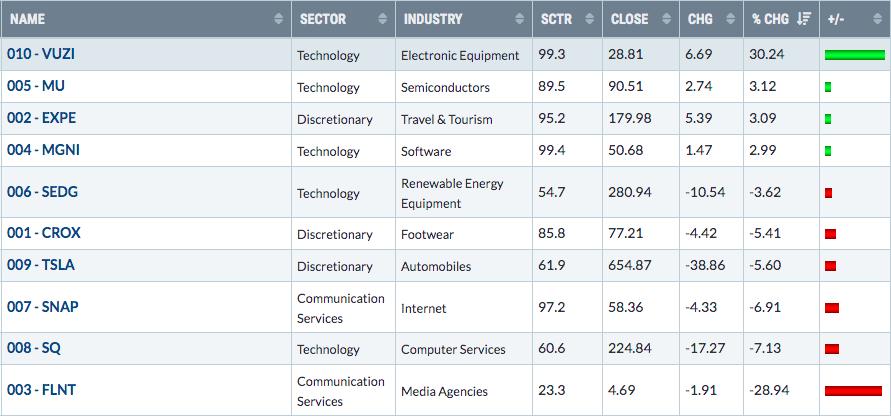
I think it's fairly obvious to see which 2 Strong AD stocks reported earnings last week. VUZI reported excellent results and had a huge week, while FLNT missed estimates and lost key price support at 6.00.
Summary
Option expiration week tends to be somewhat volatile and last week didn't disappoint. Those expiring options, together with a Fed meeting, proved to make for lots of whipsaw action. The most strength clearly came in the final two hours on Wednesday after Fed Chief Jay Powell essentially changed little, assuring the bond and stock markets that the Fed remains quite dovish, despite signs of increasing risks of inflation. By Thursday, however, all of that was forgotten and the final two hours that day saw significant selling pressure. After early weakness on Friday, the bulls mounted a bit of a comeback. By week's end, the benchmark S&P 500's loss was fractional for the week as a whole. Our portfolios lost a bid of ground, but for an options expiration week, it wasn't bad at all.
Model ETF Portfolio
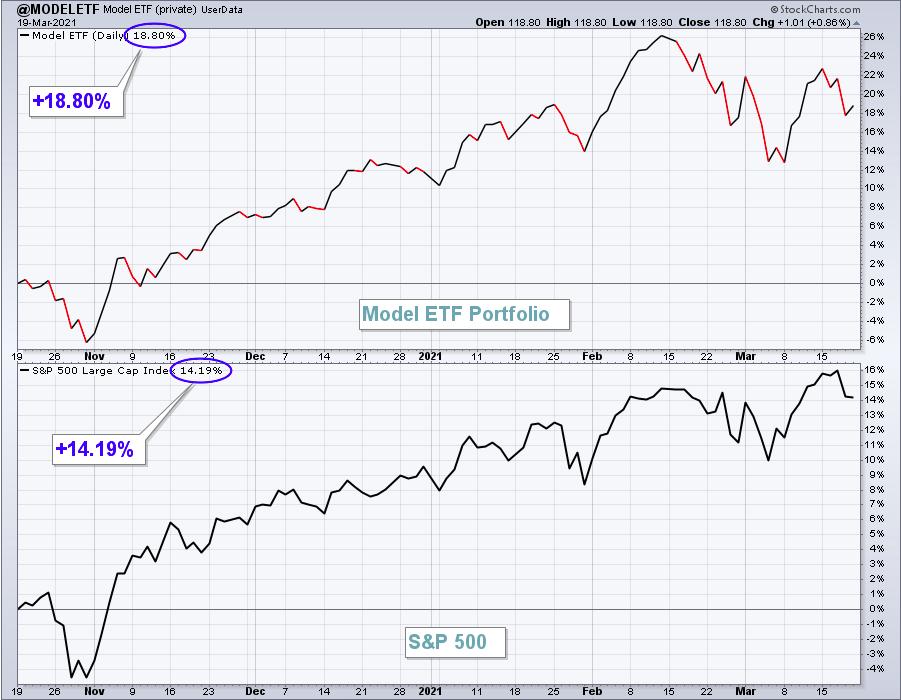
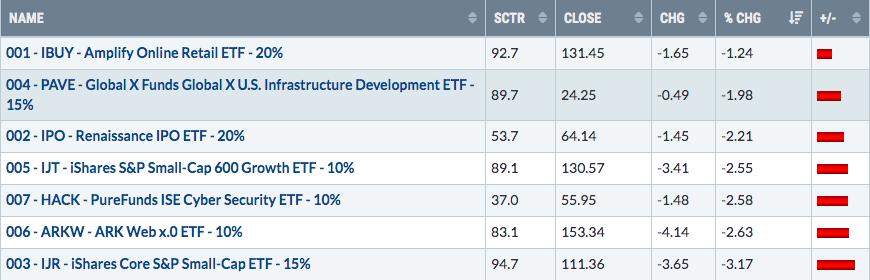
Our Model ETF Portfolio dropped 2.24% last week, underperforming the S&P 500 for the week. Small caps had one of their worst weeks since the vaccine news was released last November as the S&P 600 Small Cap Index ($SML) lost 3.05%. That contributed to the IJR and IJT losing 3.17% and 2.55%, respectively.
Here's the updated inception-to-date chart of the Model ETF Portfolio:
Here are how the Model ETF Portfolio component ETFs performed last week:
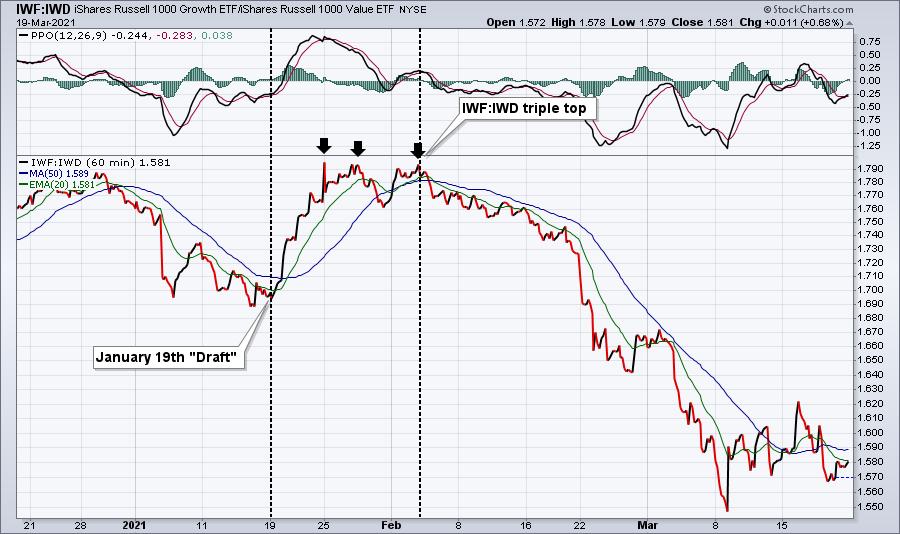
Our overall Model ETF Portfolio performance hasn't been all that bad considering our focus on growth stocks. Shortly after our Model ETF Portfolio draft on January 19th, the IWF:IWD (growth vs. value ratio) topped and has been falling ever since:
Happy trading!
Tom Bowley, Chief Market Strategist
EarningsBeats.com
"Better timing. Better trades."