
EB Weekly Portfolio Report - Sunday, March 28, 2021
Upcoming Earnings Reports
According to Zacks.com, the following companies will be reporting earnings this week and each is a component of one of our portfolios:
Monday, March 29: None
Tuesday, March 30: None
Wednesday, March 31: MU
Thursday, April 1: None
Friday, April 2: None
PLEASE NOTE: The above companies were provided after scanning the Zacks Earnings Calendar. My research is limited to what Zacks provides and I also can make a mistake from time to time, so please check for earnings dates for all companies that you own. We do hold our portfolio stocks through one earnings report, but every EarningsBeats.com member must make their own investing/trading decisions about holding stocks into earnings reports as it's the most volatile (risky) time to own a stock.
Portfolio Rules and Objectives
Here are the common traits and objectives of our portfolios:
- There are 10 leading stocks from up to 10 leading industries in each portfolio (at the time of selection). Generally, there will only be one stock per industry group, but there could be exceptions.
- They are held for an entire 90 day period, with no stops in place. We strive for consistency, transparency, and simplicity in our portfolios. EB.com members may hold these stocks for the entire 90 days, trade them, use stops, etc., but for purposes of our calculation, we will make no exceptions to our "buy and hold for three months" strategy.
- Every stock will generally be held through ONE earnings report
- The expectation is that relative winners will carry the portfolio to outperformance
- They were all entered into as of the close on Friday, February 19th; members may choose to try to time better entries, but EB.com "purchased" as of February 19th's closing price
- Primary objective is to outperform the benchmark S&P 500
Here are several considerations for EB members:
- I would expect the Strong AD and Aggressive portfolios to be the riskiest, followed by the Model portfolio, and then the Income portfolio
- The Strong AD portfolio will be selected from a combination of rising accumulation/distribution lines and SCTRs above 80 at the time of selection. It is the only portfolio that does NOT require a revenue and EPS beat in its most recent quarterly earnings report
- The Income portfolio stocks will all pay dividends, with the expected average dividend yield to be at least 1.0%
- Drawdowns (losses) should be much milder on the Income portfolio, with more volatility expected on the other three; please review inception-to-date charts below to gain an idea of the volatility associated with each
- I believe the larger drawdown on the Income portfolio at the beginning of the pandemic was an anomaly, occurring as many defensive, higher-yielding companies uncharacteristically underperformed during a market decline.
- You should own or trade these stocks in whatever manner is most comfortable for you; while we will buy all 10 stocks in the manner identified above, feel free to trade certain stocks or wait for pullbacks if the stocks are overbought
- We have no idea what risk each member is willing or able to take. We are not registered investment advisors so be sure you understand the risk you take. Please consult your financial advisor.
- EarningsBeats.com shareholders/employees may own all or some of the portfolio stocks from time to time.
Weekly Snapshot
Here's a weekly recap:
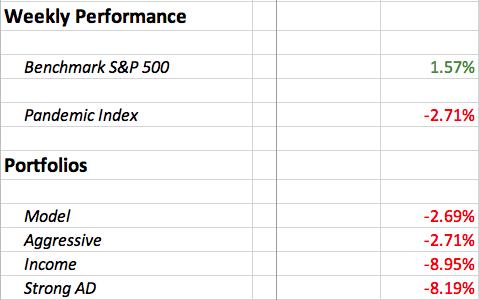
It was another rough week for our portfolios as leadership names from many areas were sold off hard. Semiconductors ($DJUSSC) finished the week higher after a huge 4.5% gain on Friday. Otherwise, the weekly results would have been even worse. It's important to understand that our investment theme remains growth stocks. We're expecting 2021 GDP to reach 6.5% (as the Fed has indicated) or possibly much higher. That combined with a 10-year treasury yield ($TNX) that remains near historic lows should bode well for companies that continue to grow their earnings rapidly and above Wall Street consensus estimates.
Weekly Summary
Benchmark S&P 500:
The S&P 500 gained 1.57% last week, closing at 3974.54 on Friday. That eclipsed the previous record high close of 3974.12 on March 17th. The intraday high of 3983.87 that day still remains as the record all-time high, however. To illustrate how brutal the last 6 weeks have been for the NASDAQ 100 ($NDX), here's a 10-year relative weekly chart of the NDX vs. the SPX:
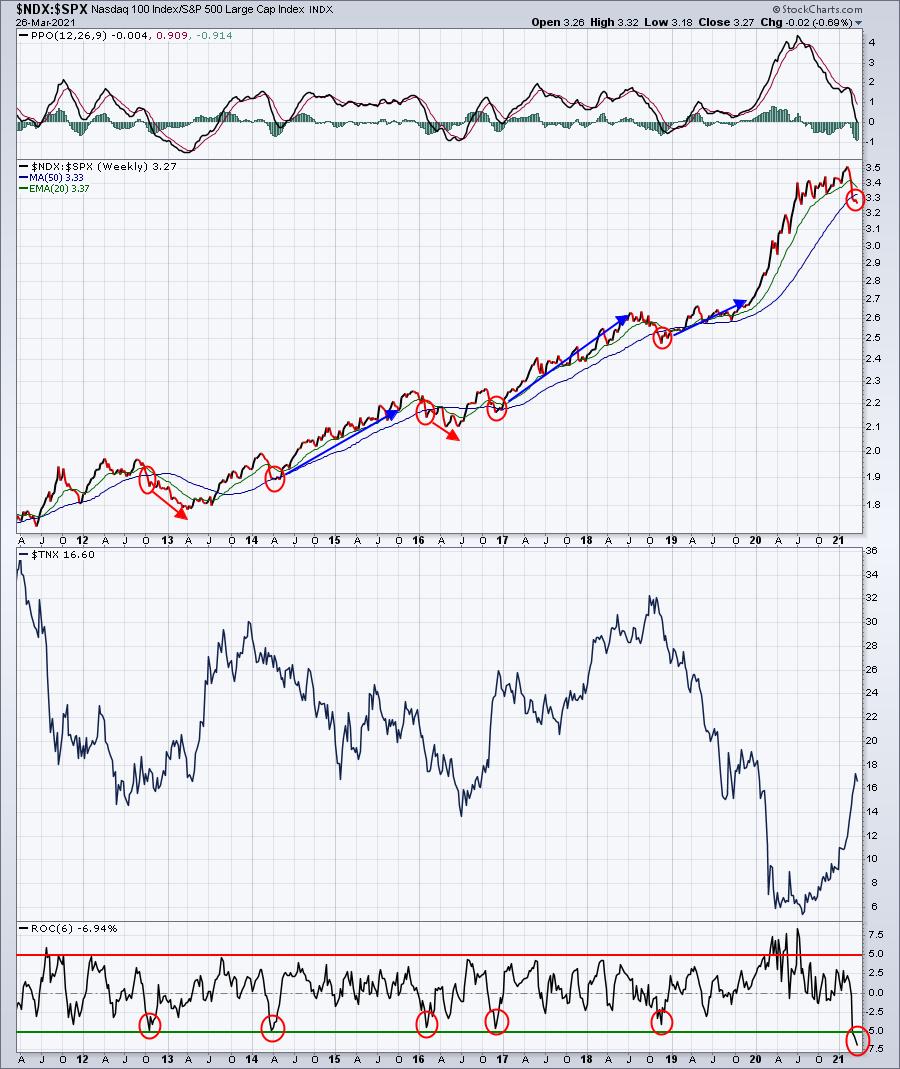
The bottom panel shows a 6-week rate of change of the NDX relative performance. Until the last several weeks, this ratio never went below -5.0%. This current period of NDX relative weakness is THE WORST in the past 10 years. I believe part of this is justified as we transition and the stock market rotates somewhat to those beaten-up sectors and industries that were ignored last year. After all, in 2020, the NDX:SPX relative ratio 6-week rate of change soared above +5.0%, something it had not done over the past 10 years. Keep in mind, however, that nothing has changed in terms of growth forecasts. If anything, they've grown stronger. Yes, higher interest rates will play a role in valuations, but not nearly as much as the media would have us believe. This is my opinion based on my background in public accounting. I performed valuations of companies and NOTHING is more important than (1) future earnings growth and (2) the acceleration of future earnings growth. Feel free to agree or disagree. Currently, the market is disagreeing. If you look back at periods of strong acceleration in the 10-year treasury yield ($TNX) - like 2016 to 2018, when the TNX rose from 1.40% to 3.25%, the rate of change of the NDX vs. SPX stayed mostly in positive territory. Technology stocks didn't lose ground because of higher treasury yields. And THAT was with much slower growth. That's why I'm personally not giving up on technology stocks, despite what the media is telling us to do.
For each of the portfolios below, I'm providing one stock that, I believe, remains under accumulation as we move into earnings season.
Model Portfolio:
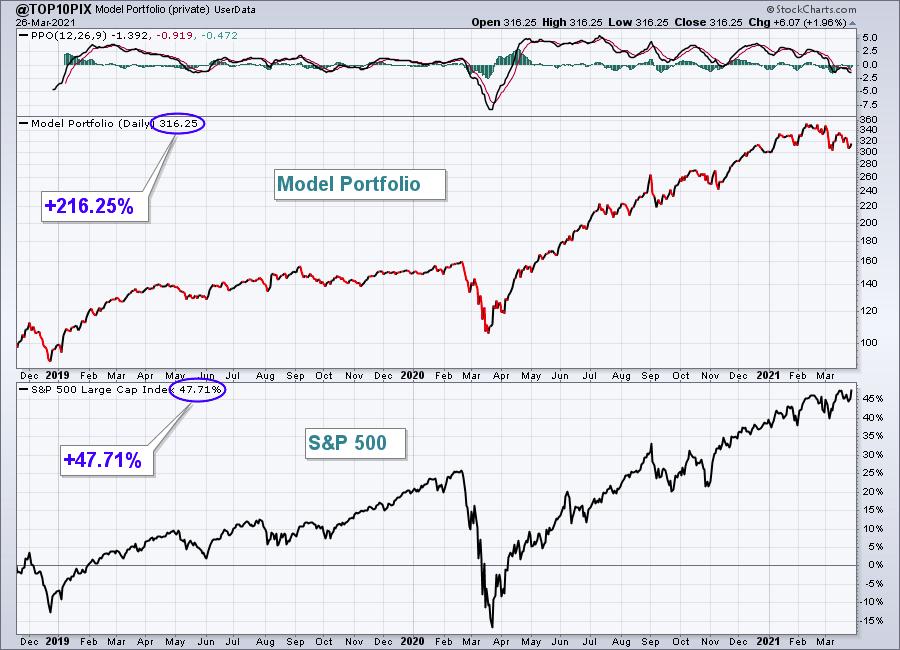
The Model Portfolio slipped 2.69% last week, falling further behind the S&P 500 this quarter. Here's the updated inception-to-date chart of the portfolio:
Here are how the Model portfolio component stocks performed last week:
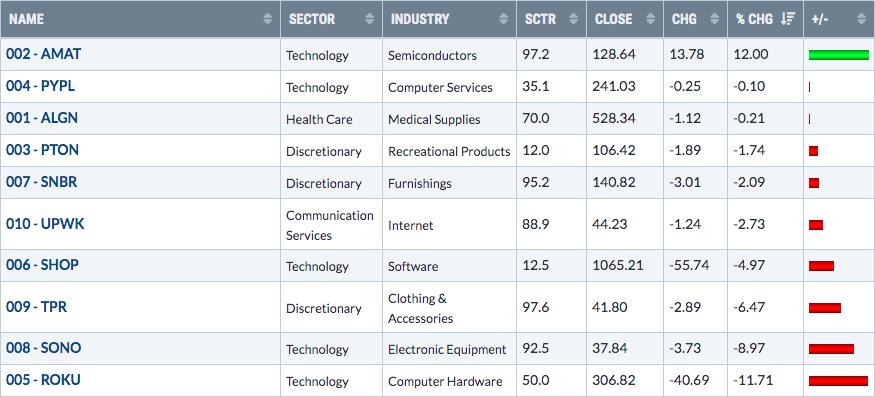
I know many software stocks ($DJUSSW) seem to be left for dead right now, and SHOP's loss of one-third of its market cap in 6 weeks has been brutal, but the AD line seems to be painting a picture of retail selling and institutional buying:
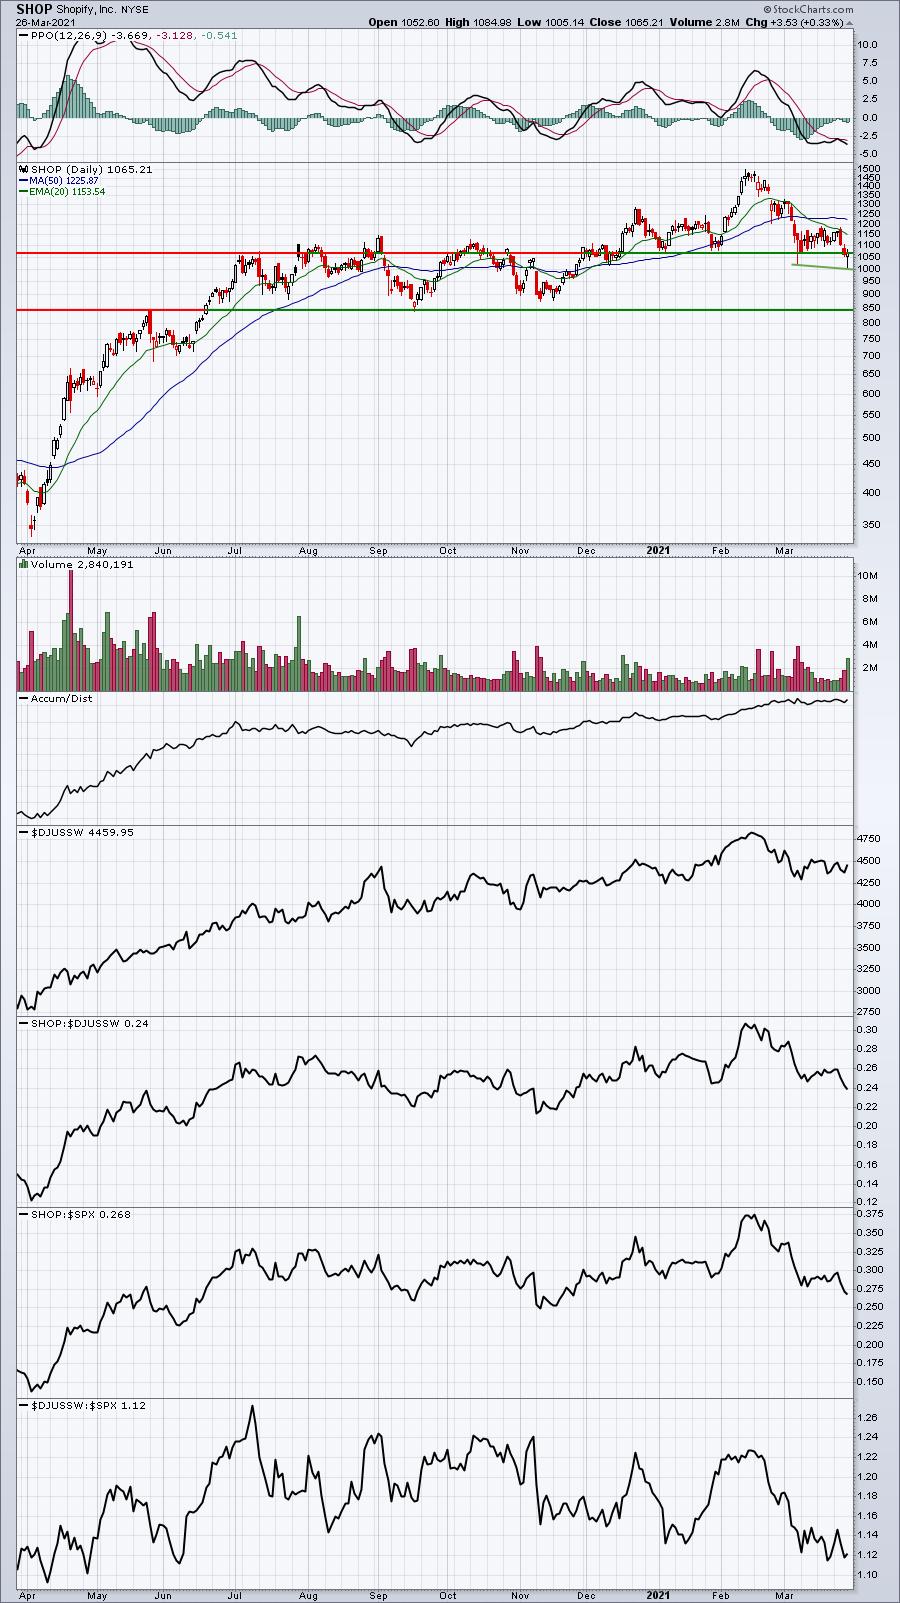
If Friday's intraday low doesn't hold, then SHOP definitely could see further downside, possibly as low at 850 or so to test the low from September. But given that the AD line has held up so well, I'd bank more on a recovery into earnings season.
Aggressive Portfolio:
The Aggressive Portfolio fell 2.71%, trailing the benchmark S&P 500 for the week. Here's the updated inception-to-date chart of the portfolio:
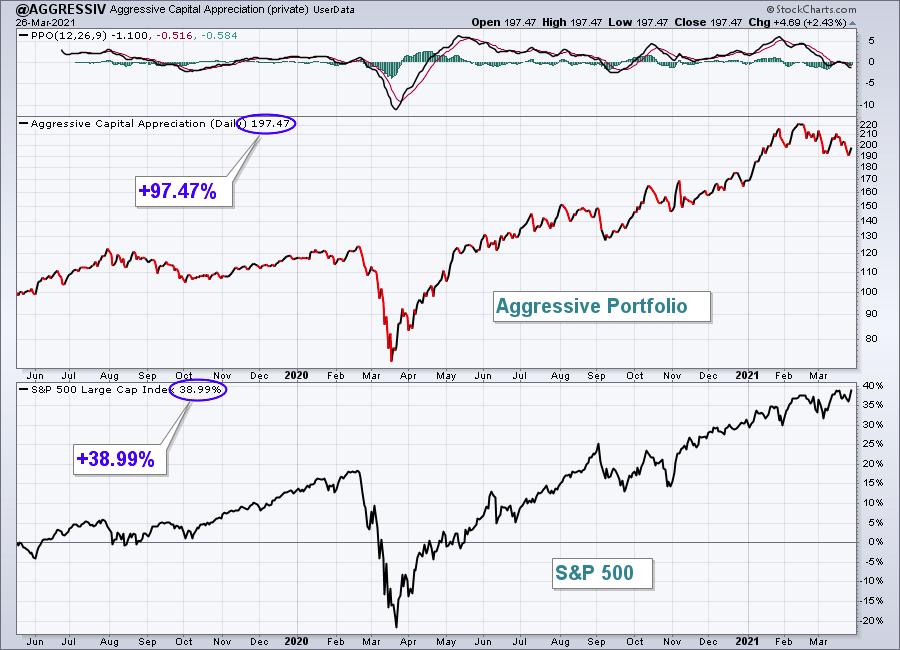
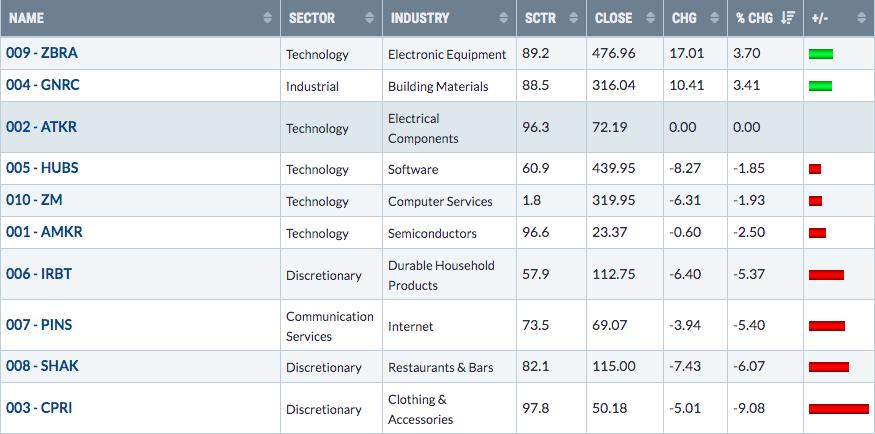
Here are how the Aggressive portfolio component stocks performed last week:
PINS has fallen back significantly since nearly touching 90 back on February 16th:
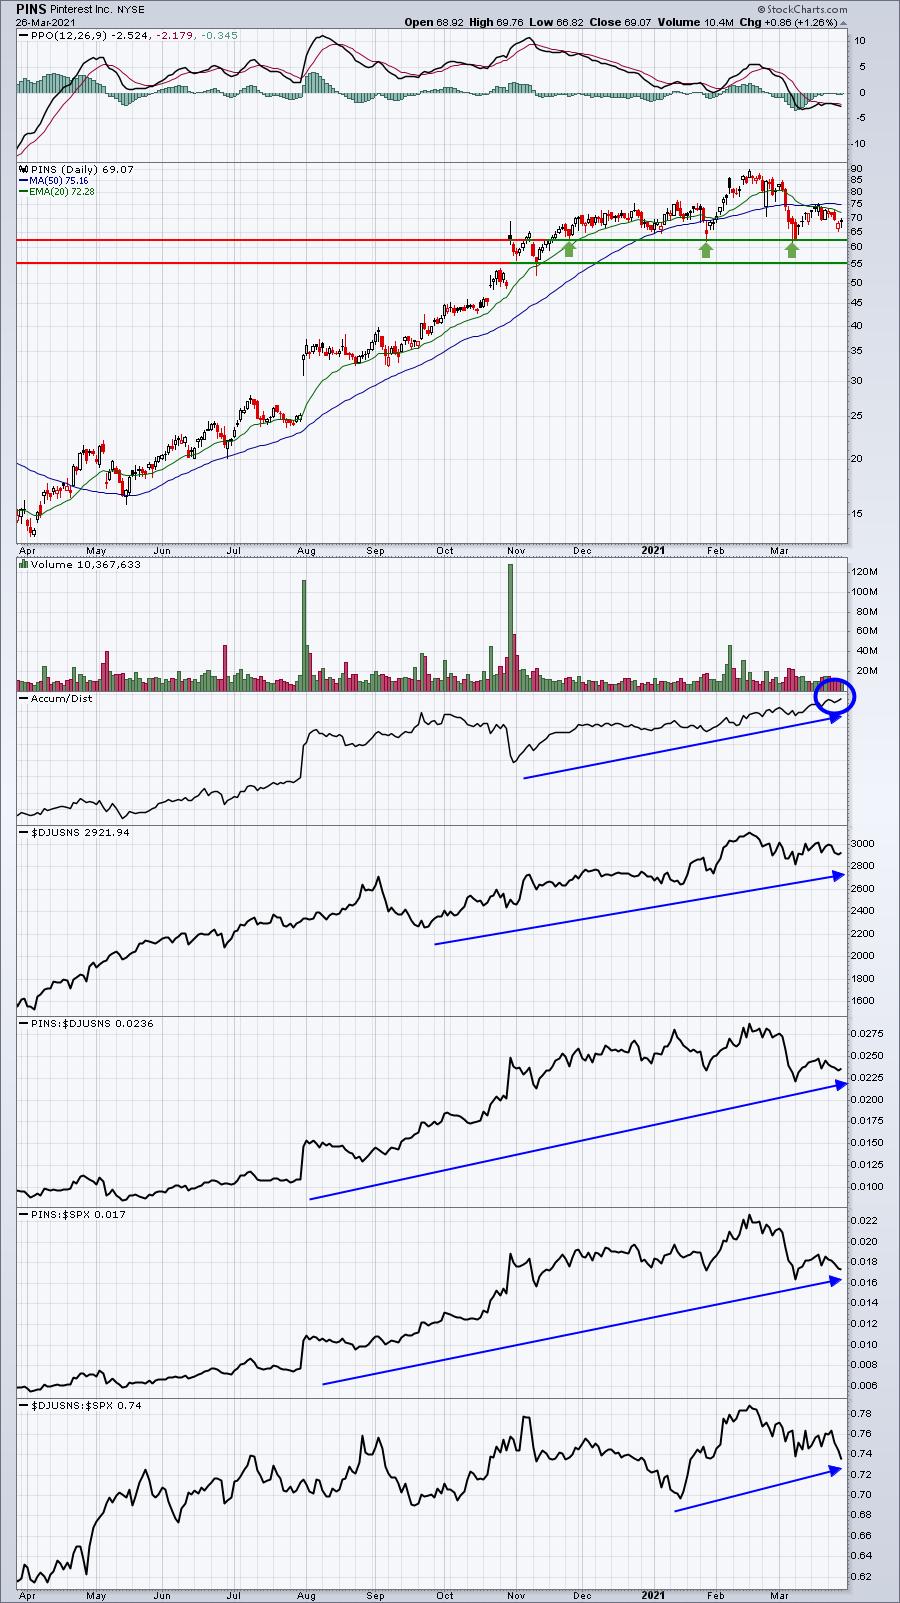
Support near 262-263 seems to be rock solid, but the more interesting development on this chart is the AD line breaking to a fresh 52-week high. PINS certainly doesn't appear to be a stock that's being unloaded by institutions.
Income Portfolio:
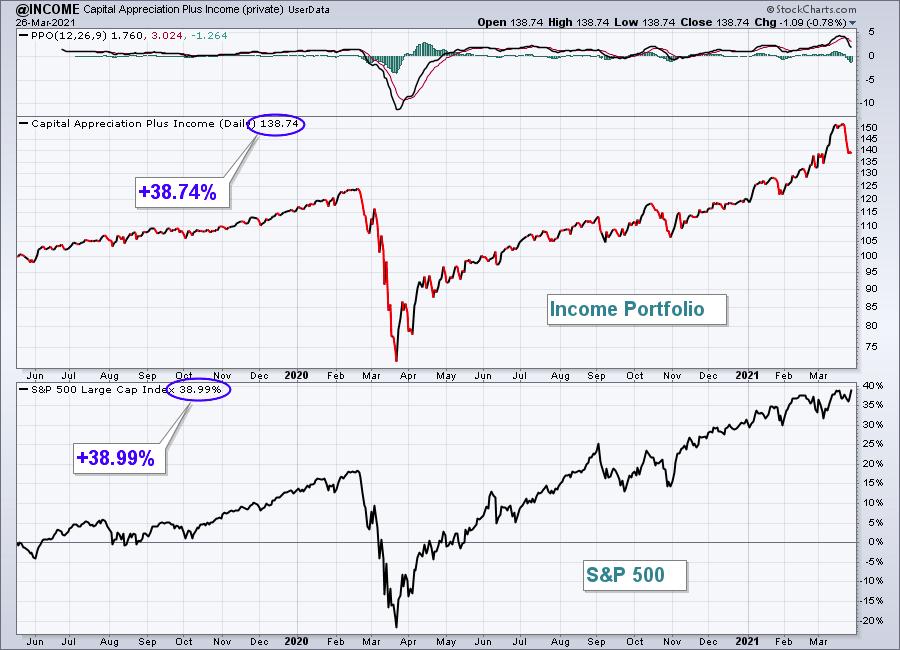
The Income Portfolio dropped 8.95%, giving up all of its advantage over the S&P 500 since its inception. Here's the updated inception-to-date chart of the portfolio:
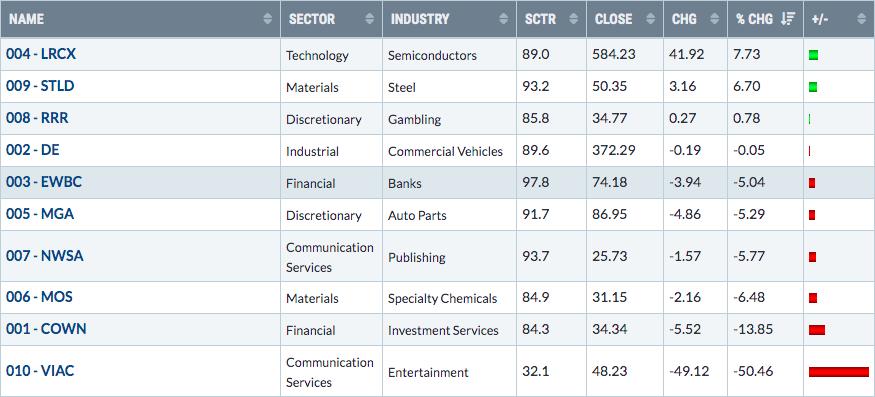
Here are how the Income portfolio component stocks performed last week:
Of these 10 stocks, I'd have to say RRR's AD line is the strongest:
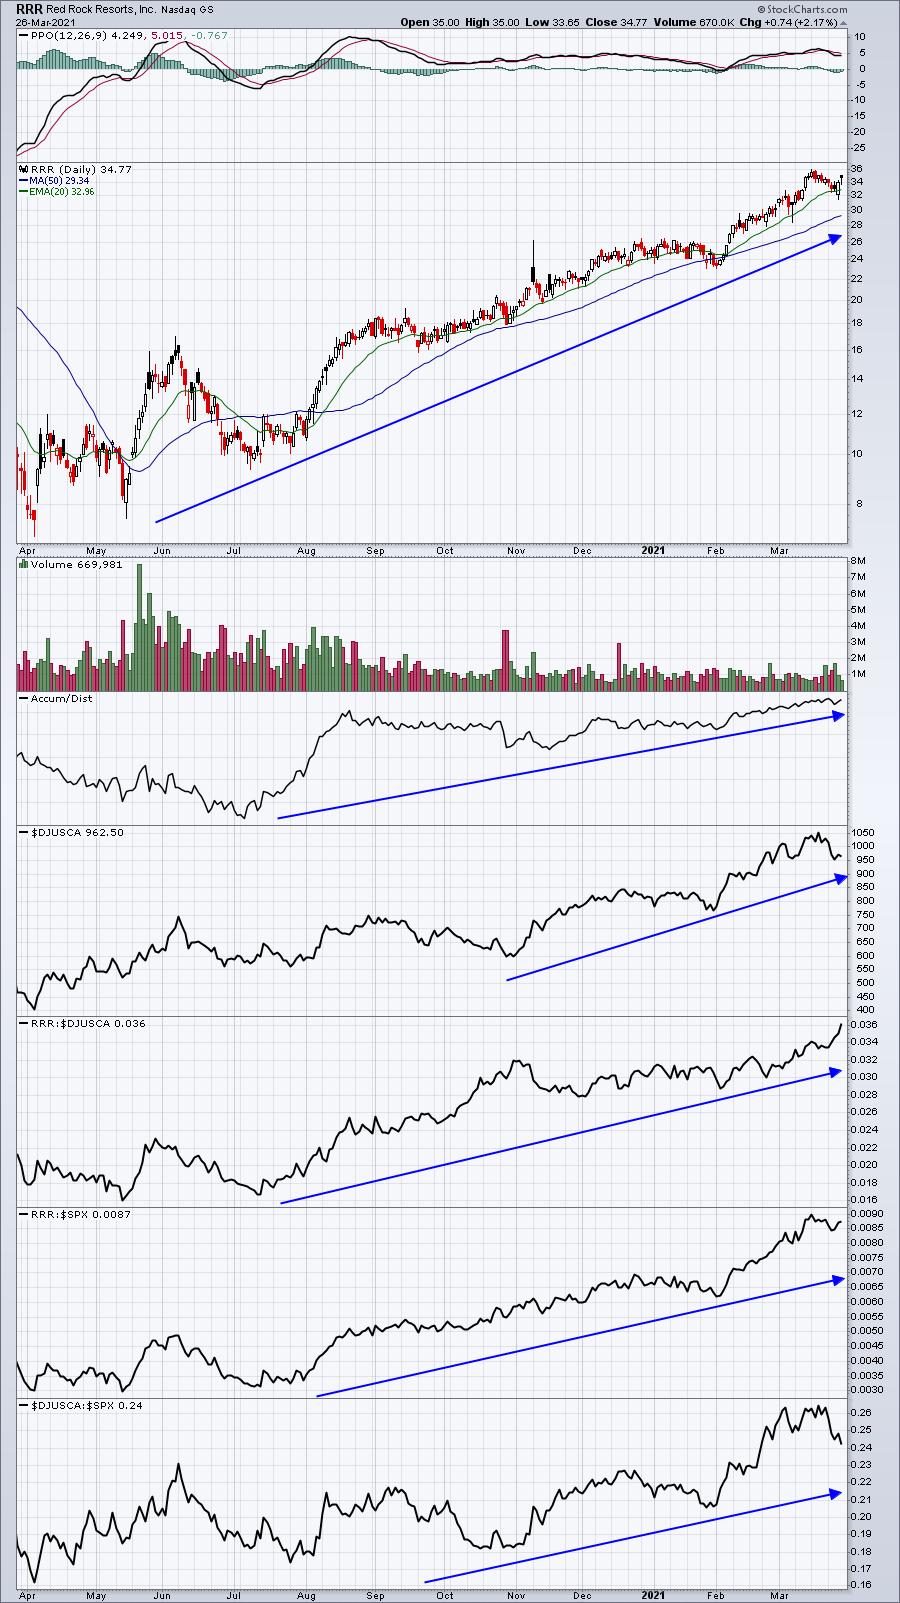
It's hard to argue with the excellent relative strength here as well.
Strong AD Portfolio:
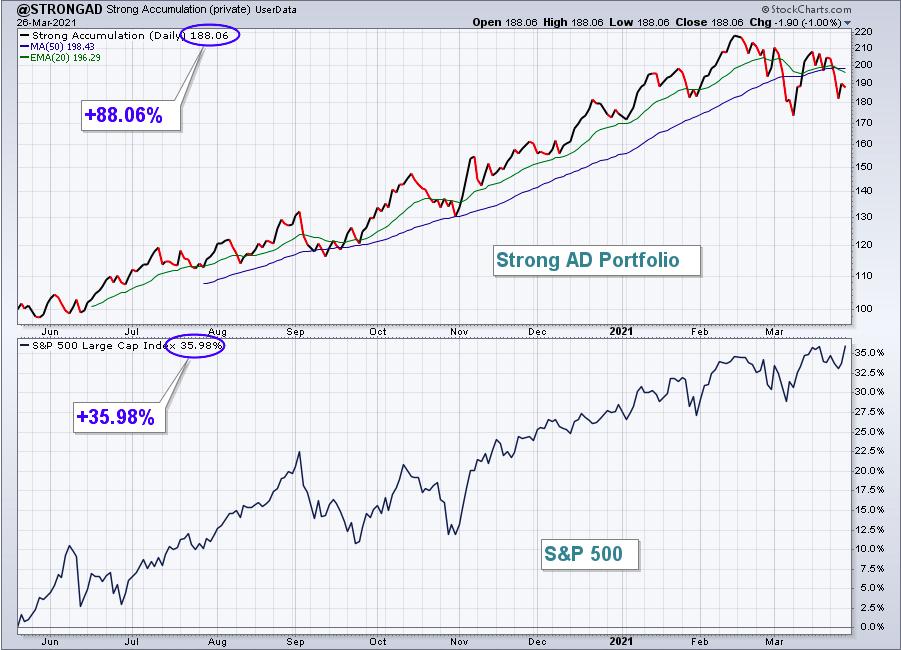
The Strong AD Portfolio tumbled 8.19%, suffering through another poor week of growth stock performance. Here's the updated inception-to-date chart of the portfolio:
Here are how the Strong AD portfolio component stocks performed last week:
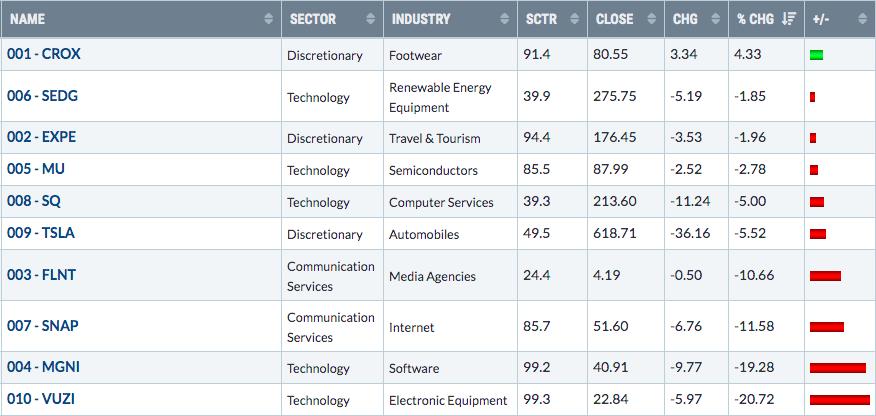
If you looked solely at the AD lines of the stocks in this portfolio, you'd never suspect any weakness was taking place on their respective charts. I believe if growth returns to favor as earnings season grows near, this is the portfolio likely to benefit the most. It's an aggressive group, but I could've picked just about any stock - other than FLNT, which missed earnings expectations recently - to highlight its strong AD line. VUZI's AD is at a new high. MGNI and SNAP both have remained fairly strong, but I've already featured software and internet, so let's go with TSLA. I see so many folks writing off TSLA right now. I believe that's a big mistake and apparently plenty on Wall Street agree with me as the AD line set a new high a week ago and remains very resilient:
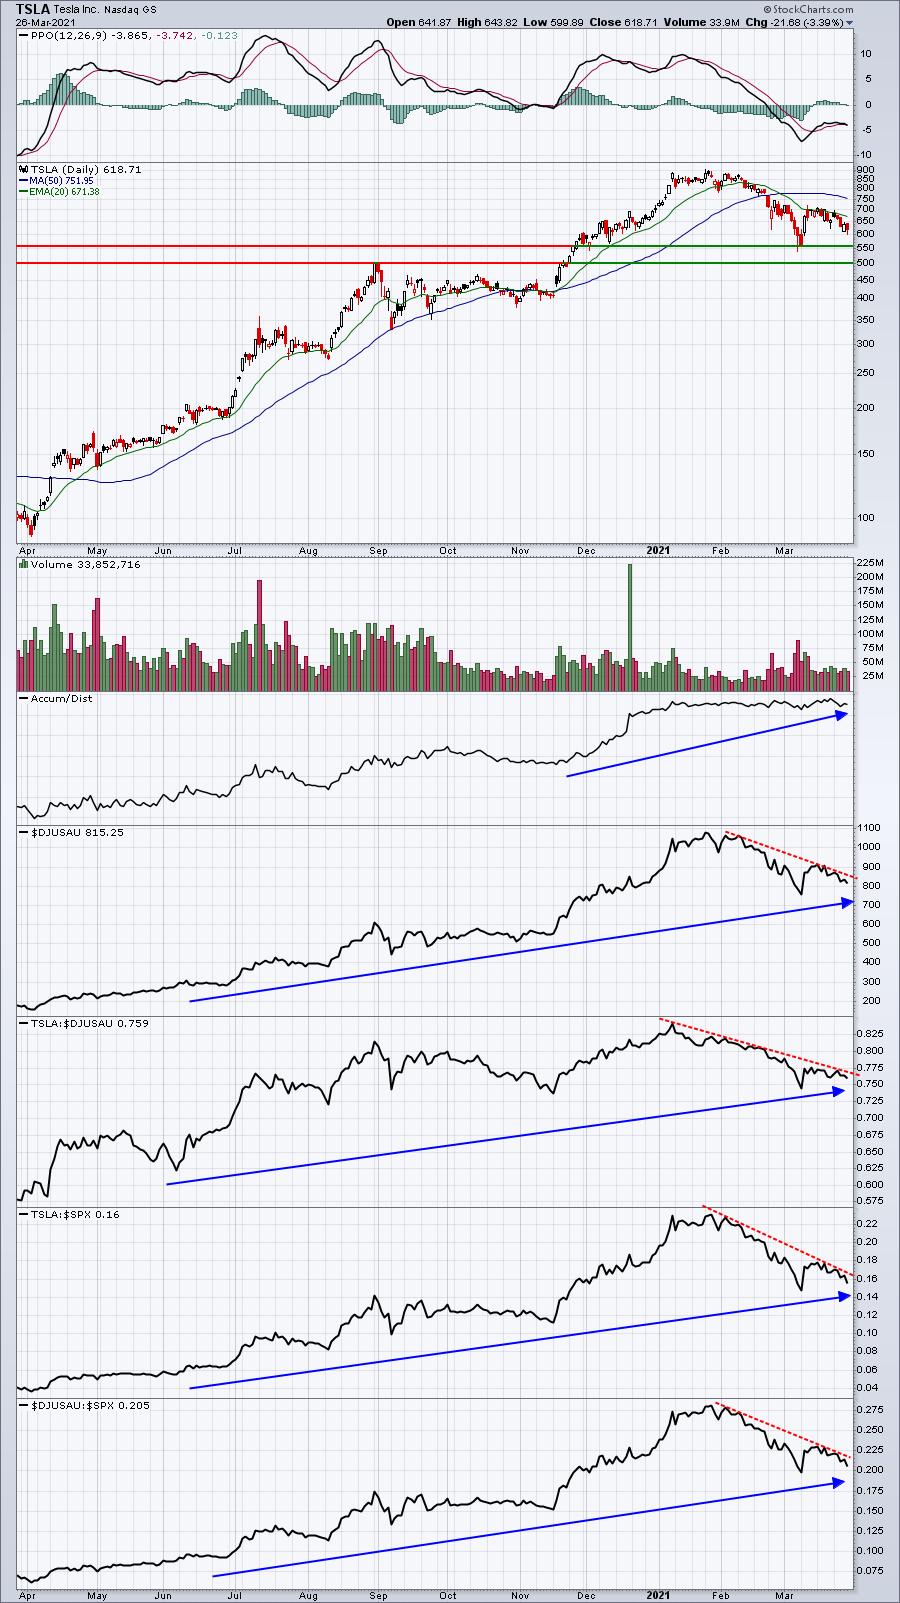
I've highlighted key price support on any further price weakness, but also be prepared for breakouts in both absolute and relative strength. Those declining red-dotted lines highlight key areas of resistance to watch.
Summary
The last 4-6 weeks have been undeniably weak for growth stocks. No argument here. But the next 4-6 weeks could very well see a return to growth stocks. It will be important to watch to see if any big earnings warnings come out among these major growth players. If they don't and upcoming earnings generally surpass estimates, I believe Wall Street will again value growth companies much more aggressively.
I honestly don't feel the current quarter's portfolio weakness is about our stock selection. I think it has much more to do with the "growth theme" simply being trashed during March. Perhaps it was an opportunity for Wall Street firms to load up on stocks that were beaten up recently, ahead of a strong earnings season.
Others with solid track records have struggled recently, as we have. The ARK funds, which were the darlings of Wall Street, have performed as follows since our latest portfolios were announced as of February 19th:
- ARK Innovation (ARKK): -25.32%
- ARK Fintech Innovation (ARKF): -20.24%
- ARK Web x.0 (ARKW): -23.03%
- ARK Genomic Revolution (ARKG): -21.29%
- ARK Autonomous Technology & Robotics (ARKQ): -16.18%
- Innovator IBD 50 Fund (FFTY): -10.49%
These are all funds that gain an advantage when momentum/growth stocks are performing well. They're all taking a hit, just like our portfolios. Our portfolios outperformed these ETF leaders during the market's advance the past couple years and ours are holding up relatively well against them during this period of growth stock selling.
I don't take a lot of comfort in outperforming weak ETFs. I'm really just trying to point out, in a different way, that these past several weeks are more about themes and less about individual stocks. Personally, I'm looking forward to moving past March and seeing what April holds in store.
Model ETF Portfolio
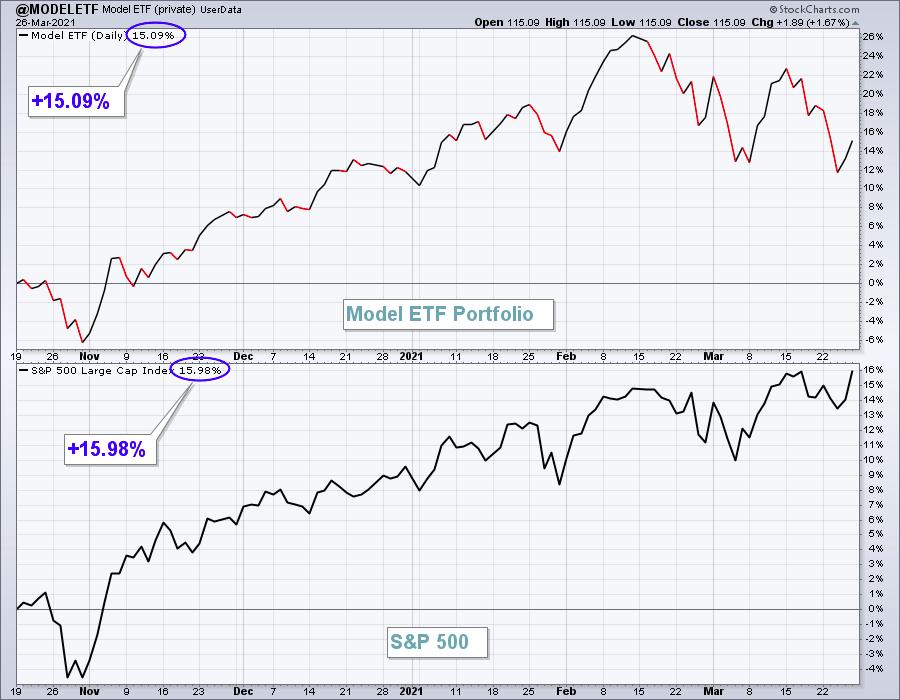
Our Model ETF Portfolio dropped 3.12% last week, significantly underperforming the S&P 500. Like our stock portfolios, much of our ETF portfolio is invested in growth areas, which have been shunned. I expect that will change as we move into earnings season.
Here's the updated inception-to-date chart of the Model ETF Portfolio:
Here are how the Model ETF Portfolio component ETFs performed last week:
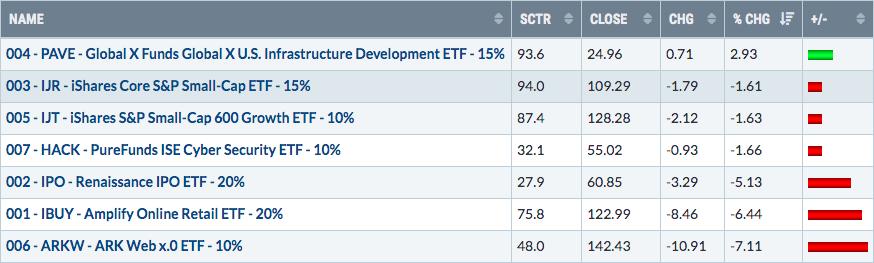
The high growth portion of our Model ETF Portfolio continue to lag badly. We've seen this throughout the past 4-6 weeks, but especially during March. The two small cap ETFs were down, though they bounced back significantly from intraweek lows.
Happy trading!
Tom Bowley, Chief Market Strategist
EarningsBeats.com
"Better timing. Better trades."