
EB Weekly Portfolio Report - Sunday, May 16, 2021
Upcoming Earnings Reports
According to Zacks.com, the following companies will be reporting earnings this week and each is a component of one of our portfolios:
Monday, May 17: None
Tuesday, May 18: None
Wednesday, May 19: None
Thursday, May 20: AMAT
Friday, May 21: DE
PLEASE NOTE: The above companies were provided after scanning the Zacks Earnings Calendar. My research is limited to what Zacks provides and I also can make a mistake from time to time, so please check for earnings dates for all companies that you own. We do hold our portfolio stocks through one earnings report, but every EarningsBeats.com member must make his/her own investing/trading decisions about holding stocks into earnings reports as it's the most volatile (risky) time to own a stock.
Portfolio Rules and Objectives
Here are the common traits and objectives of our portfolios:
- There are 10 leading stocks from up to 10 leading industries in each portfolio (at the time of selection). Generally, there will only be one stock per industry group, but there could be exceptions.
- They are held for an entire 90 day period, with no stops in place. We strive for consistency, transparency, and simplicity in our portfolios. EB.com members may hold these stocks for the entire 90 days, trade them, use stops, etc., but for purposes of our calculation, we will make no exceptions to our "buy and hold for three months" strategy.
- Every stock will generally be held through ONE earnings report
- The expectation is that relative winners will carry the portfolio to outperformance
- They were all entered into as of the close on Friday, February 19th; members may choose to try to time better entries, but EB.com "purchased" as of February 19th's closing price
- Primary objective is to outperform the benchmark S&P 500
Here are several considerations for EB members:
- I would expect the Strong AD and Aggressive portfolios to be the riskiest, followed by the Model portfolio, and then the Income portfolio
- The Strong AD portfolio will be selected from a combination of rising accumulation/distribution lines and SCTRs above 80 at the time of selection. It is the only portfolio that does NOT require a revenue and EPS beat in its most recent quarterly earnings report
- The Income portfolio stocks will all pay dividends, with the expected average dividend yield to be at least 1.0%
- Drawdowns (losses) should be much milder on the Income portfolio, with more volatility expected on the other three; please review inception-to-date charts below to gain an idea of the volatility associated with each
- I believe the larger drawdown on the Income portfolio at the beginning of the pandemic was an anomaly, occurring as many defensive, higher-yielding companies uncharacteristically underperformed during a market decline.
- You should own or trade these stocks in whatever manner is most comfortable for you; while we will buy all 10 stocks in the manner identified above, feel free to trade certain stocks or wait for pullbacks if the stocks are overbought
- We have no idea what risk each member is willing or able to take. We are not registered investment advisors so be sure you understand the risk you take. Please consult your financial advisor.
- EarningsBeats.com shareholders/employees may own all or some of the portfolio stocks from time to time.
Weekly Snapshot
Here's a weekly recap:
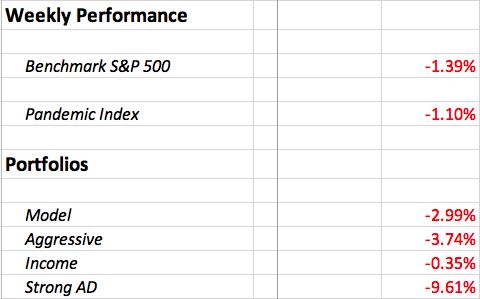
Volatility surged last week as inflation data was released that showed both consumer and producer prices rising much faster than expected. The year-over-year headline data soared and chased many folks out of stocks, in general, and out of growth stocks more specifically. That was a poor environment for 3 of our 4 portfolios and it showed in last week's performance.
Weekly Summary
Benchmark S&P 500:
Any time that you see the Volatility Index ($VIX) jump above 20, you should at least be on alert for the possibility of more violent selling. The good news is that during a secular bull market, any trip on the VIX to 30-35 is normally an area where the selling will exhaust itself. More rarely, we might see the 40-45 range tested, but that truly forms a MAJOR support level in an uptrending S&P 500.
We've now moved into a more historically neutral period. As I've posted and discussed many times recently, earnings season tends to drive equity prices higher - from the 2-3 weeks prior to the start of earnings season through about the midpoint of the second calendar month in a quarter as earnings season winds down. It's now May 16th and we're at that midpoint. That does NOT mean that we can't go higher on the S&P 500. It simply means that the odds diminish based on history. As a result, set your expectations bar lower as we proceed through the next six weeks or so. There are times historically when we see market advances, but they tend to occur later in May and in the early and late parts of June.
Model Portfolio:
The Model Portfolio fell 2.99% last week, giving up ground vs. the S&P 500. Here's the updated inception-to-date chart of the portfolio:
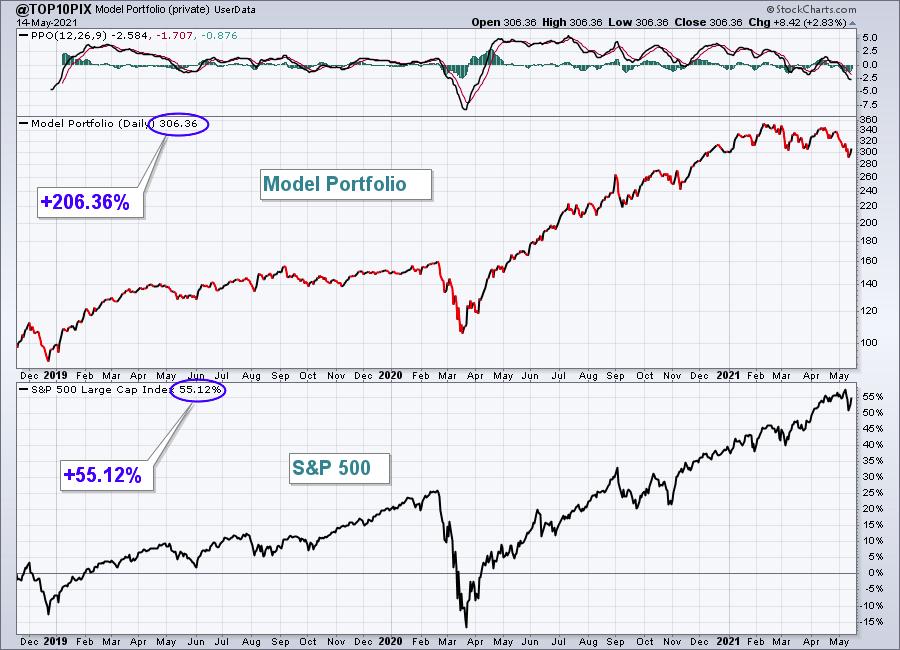
Here are how the Model portfolio component stocks performed last week:
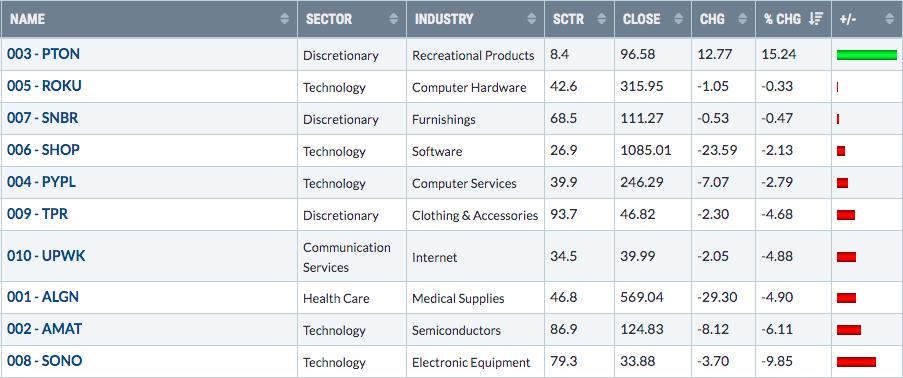
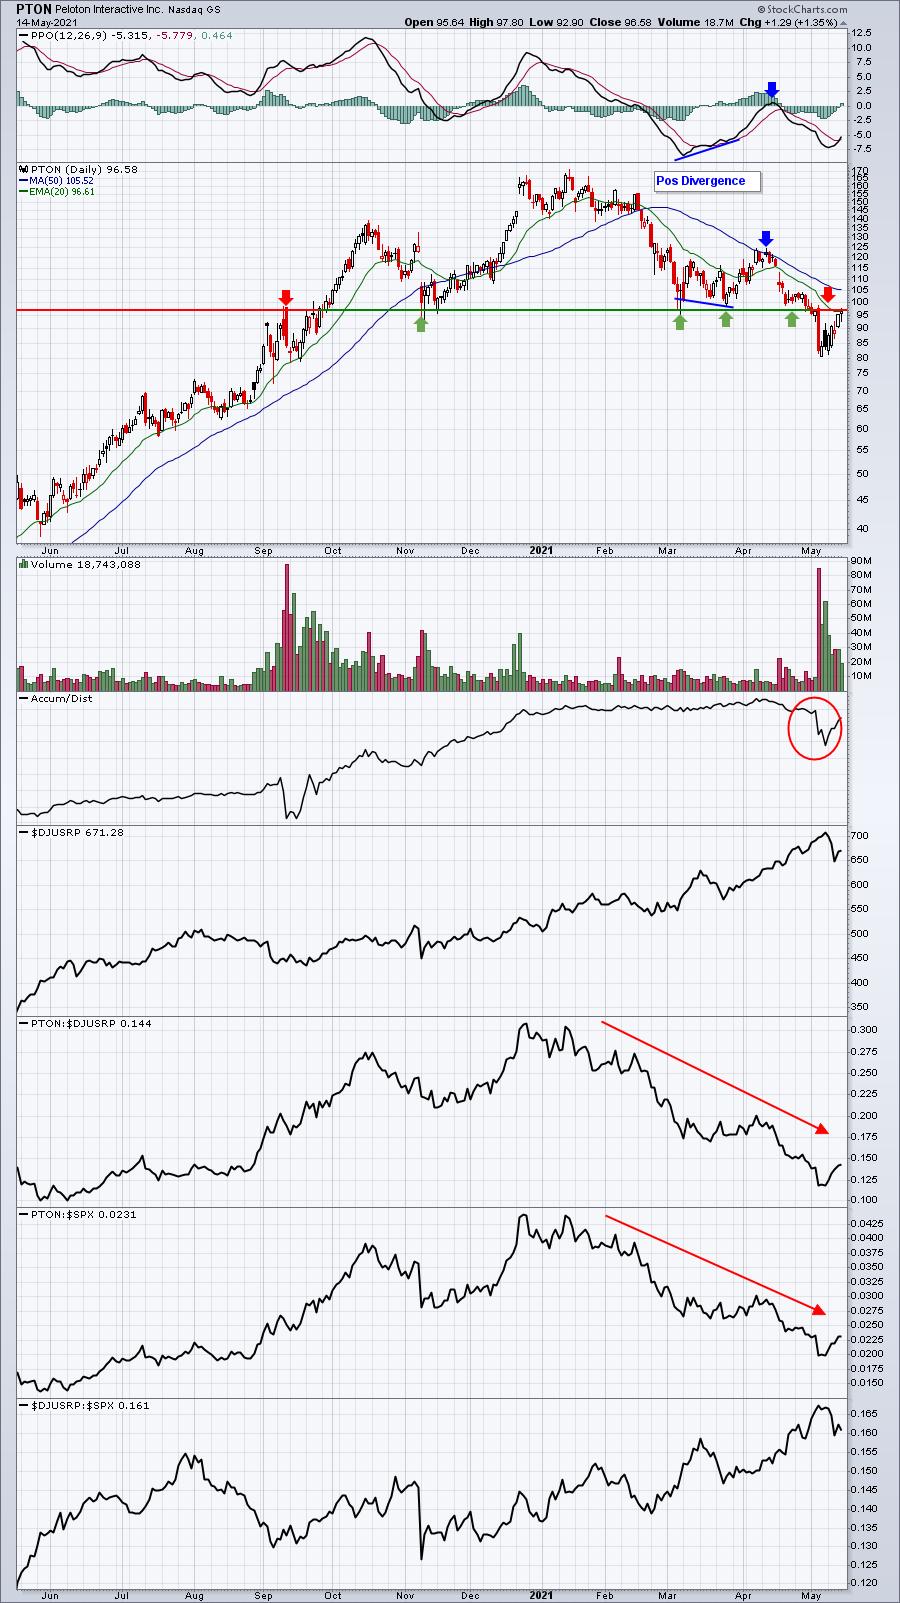
Last week, I highlighted the PTON chart, suggesting key resistance was now at 96-97. The huge advance last week carried the stock right to this resistance:
Aggressive Portfolio:
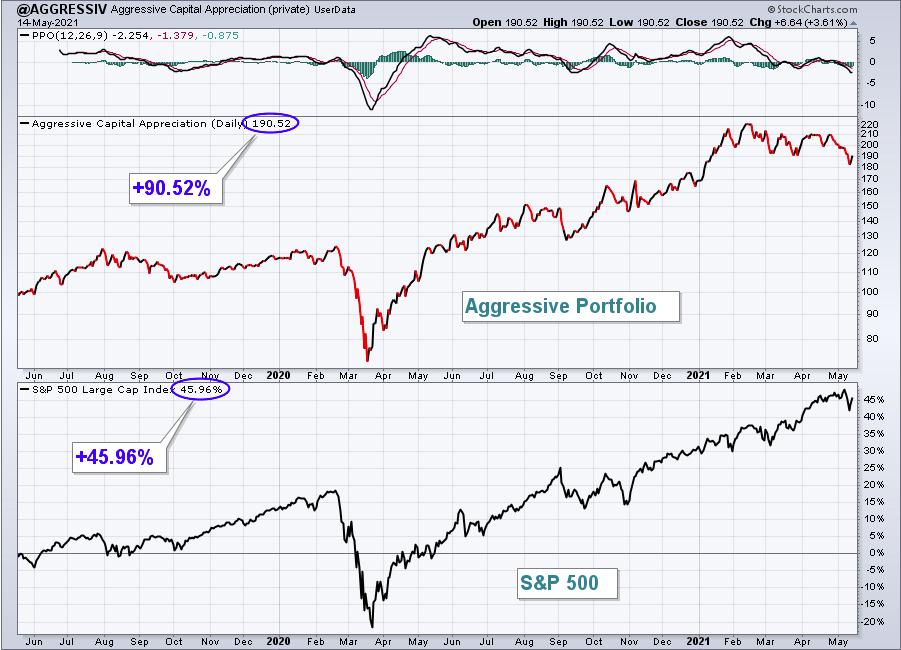
The Aggressive Portfolio stumbled 3.74%, falling further behind the benchmark this quarter . Here's the updated inception-to-date chart of the portfolio:
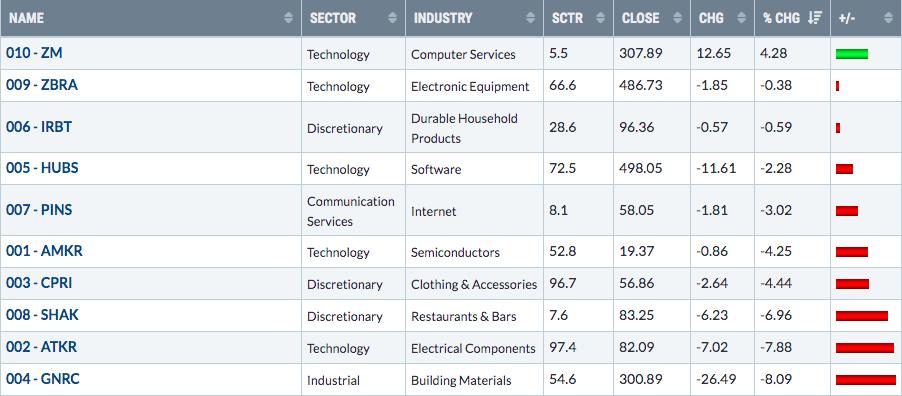
Here are how the Aggressive portfolio component stocks performed last week:
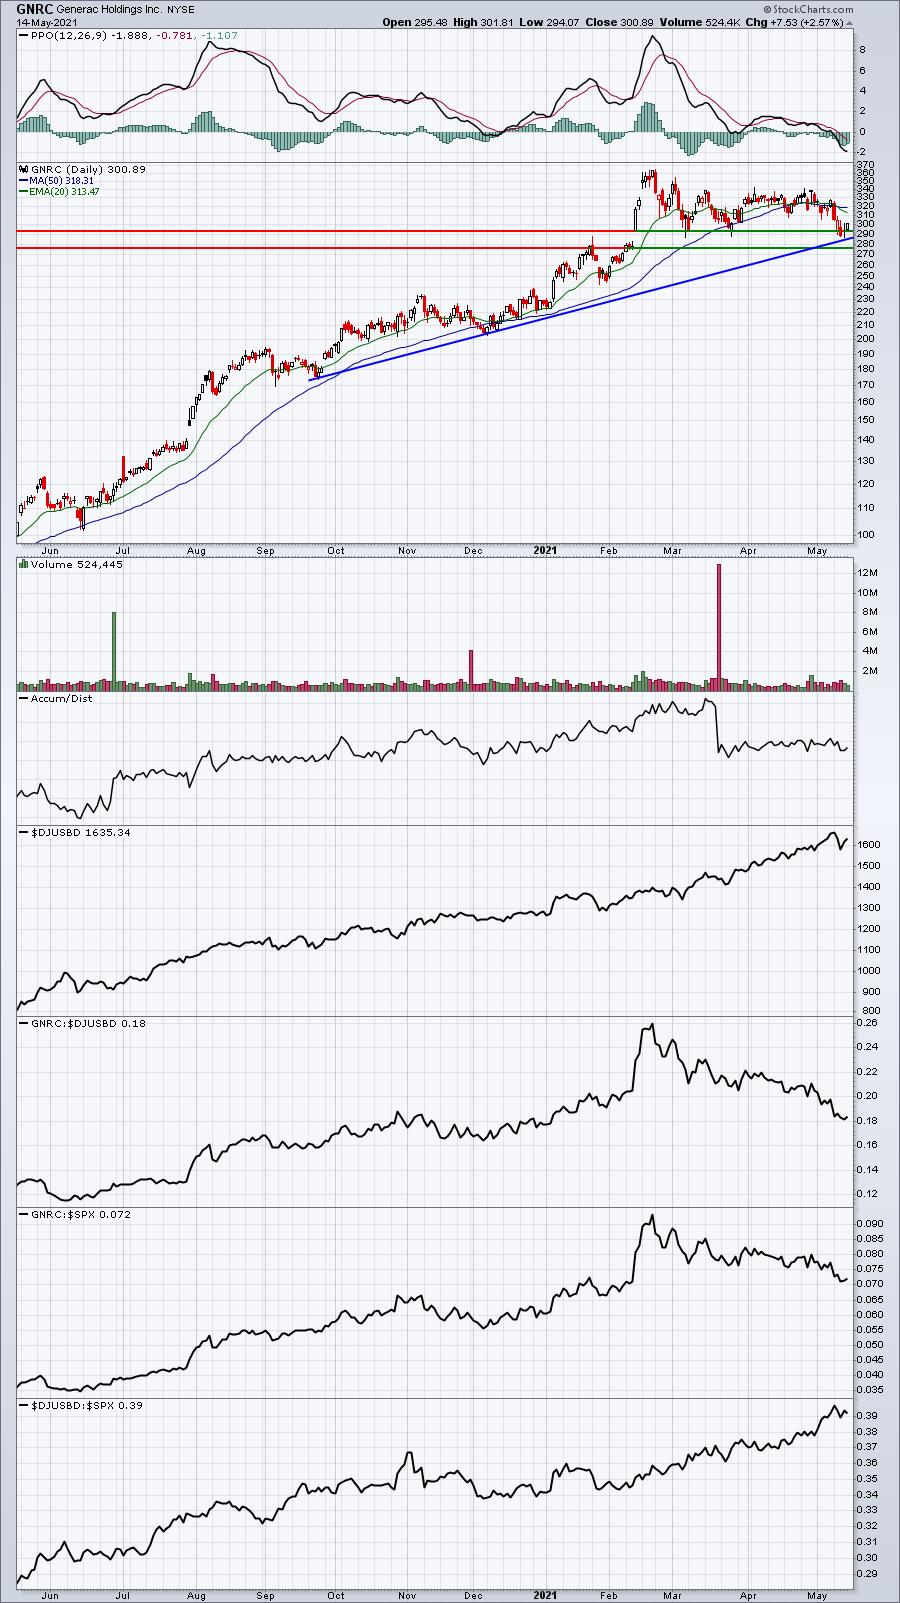
GNRC was last week's worst performer in our Aggressive Portfolio, but it looks like this is an area where it should bounce - and it started to:
Income Portfolio:
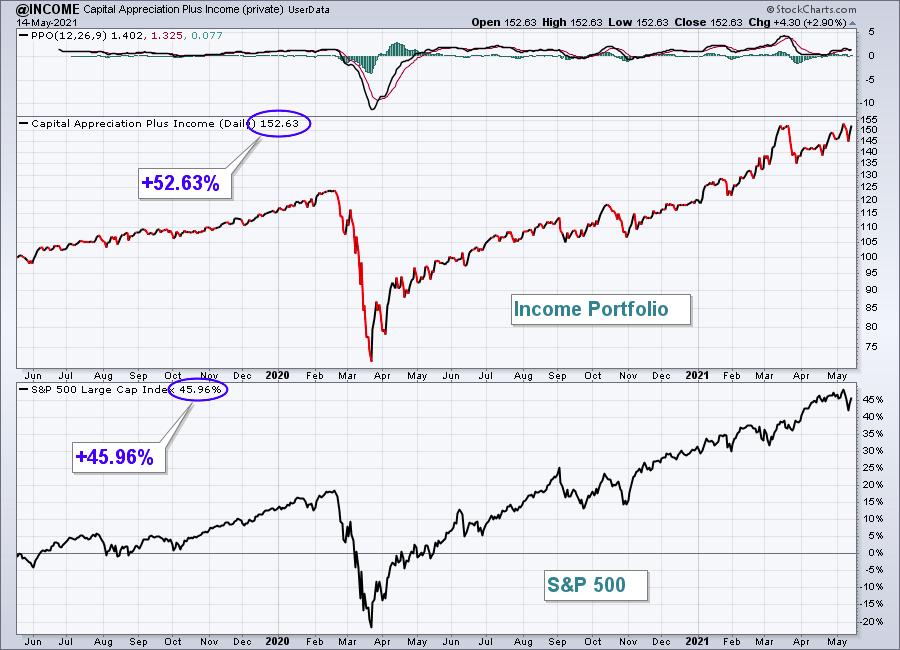
The Income Portfolio closed down 0.35% for the week, outperforming the S&P 500. Here's the updated inception-to-date chart of the portfolio:
Here are how the Income portfolio component stocks performed last week:
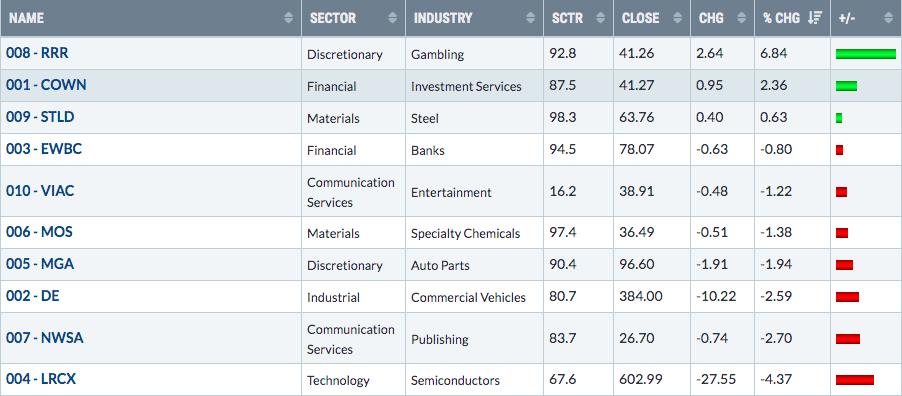
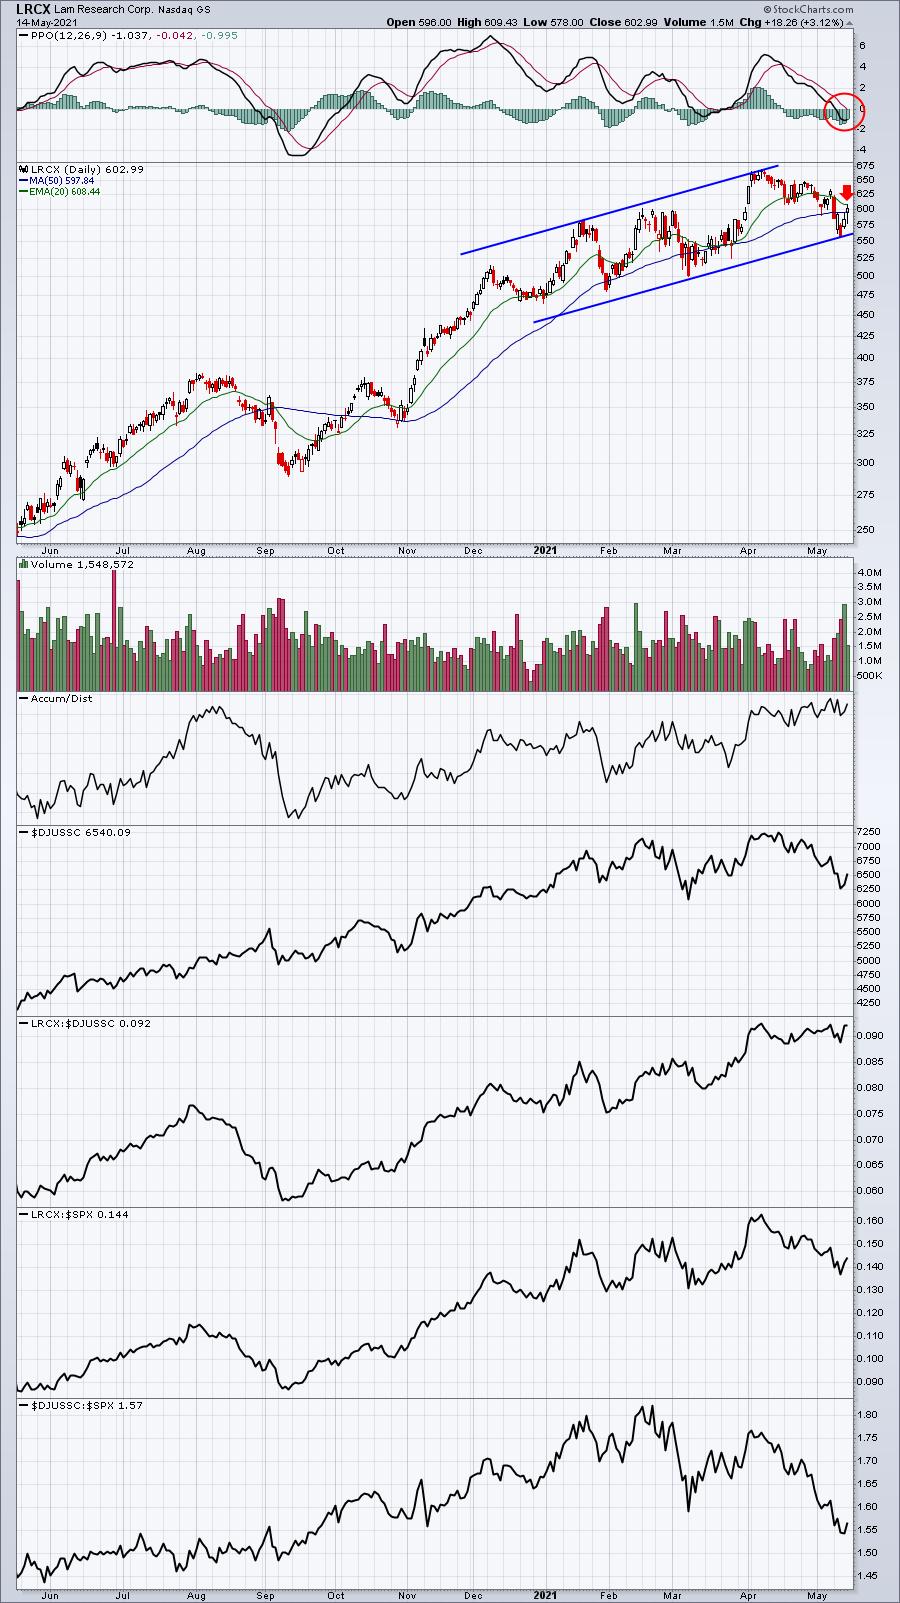
Semiconductor stocks ($DJUSSC) have turned much more negative and have lost a considerable amount of relative strength. LRCX remains a leader in the space, but isn't immune to selling if the group continues to struggle. That's what happened last week:
Strong AD Portfolio:
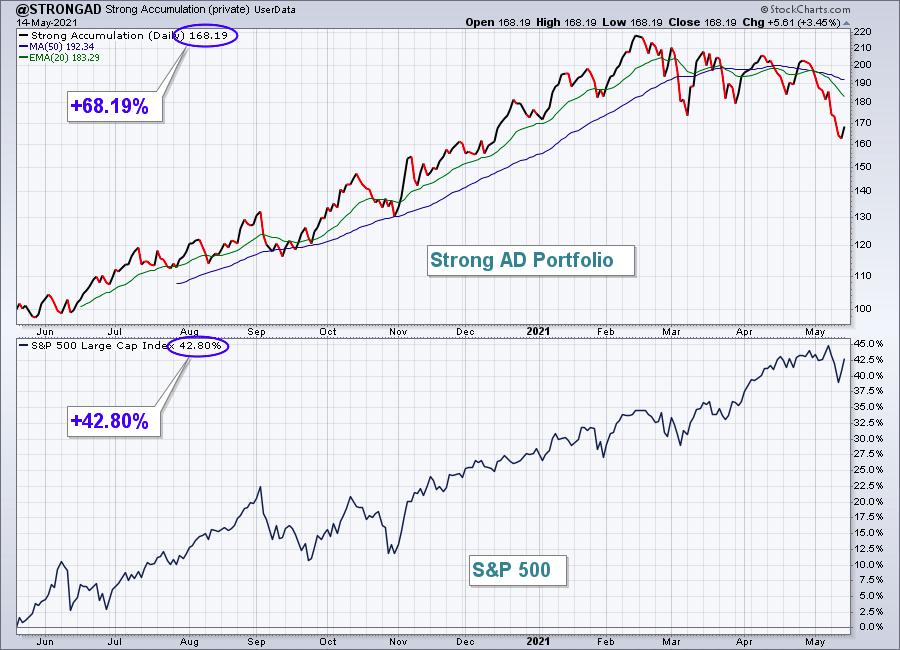
The Strong AD Portfolio was crushed 9.61%, really struggling from the rotation out of growth stocks. Here's the updated inception-to-date chart of the portfolio:
Here are how the Strong AD portfolio component stocks performed last week:
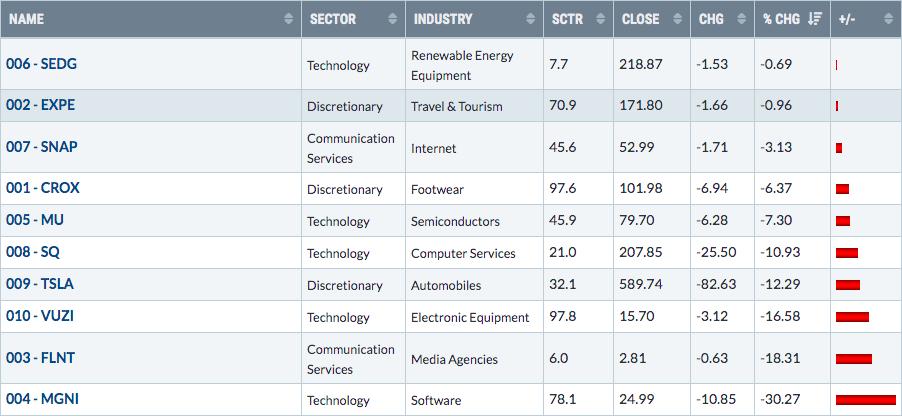
This entire portfolio was under tremendous selling pressure last week and many of these stocks are technically-broken. The SCTR scores on six of the ten component stocks have fallen below 50, and only two remain above 90. The rotation from growth to value this quarter has taken a considerable toll on this group. The worst performer was MGNI. It's been unable to find a support level to stick, but there's one upcoming that should be watched closely:
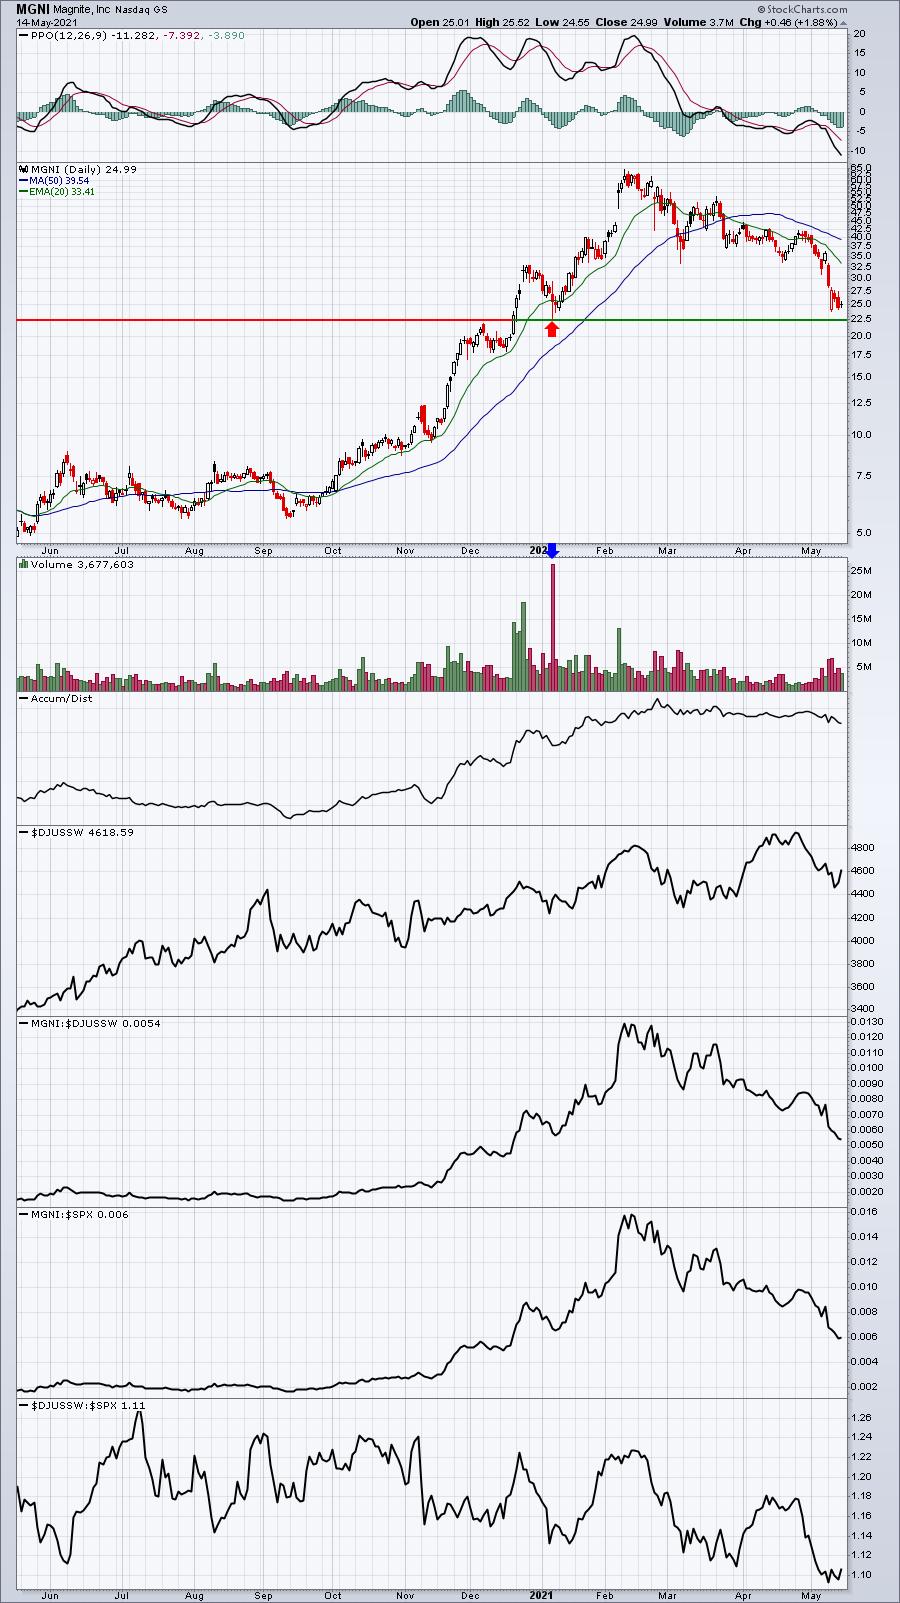
In January, MGNI sold off significantly, but a major reversal occurred near 22.50 on MASSIVE volume. I'd expect many technical buyers to surface should MGNI reach that level.
Summary
It's difficult to say when we see rotation back to growth stocks. Inflation will be in the news for the next few months, in my opinion. I don't expect it to ever materialize into anything that trips up the stock market longer-term, but the S&P 500 has run considerably higher without much of a pause since its pre-earnings season run began in late March. Inflation data may have sparked the beginning of period characterized by much more indecision and consolidation. That would also align with historical performance. Don't be surprised to see the 10-year treasury yield ($TNX) break out above 1.75% soon. If I'm correct with that assessment, the combination of both higher interest rates and additional inflationary fears will likely make it difficult for growth stocks for the next couple months, at a minimum. Technically, I'd continue to watch the IWF:IWD ratio. A breakdown below 1.55, and especially 1.50, would be bearish for growth stocks, while a breakout above 1.70 would suggest growth stocks could very well be back in favor.
Model ETF Portfolio
Our Model ETF Portfolio dropped 1.37% last week, slightly outperforming the S&P 500.
Here's the updated inception-to-date chart of the Model ETF Portfolio:
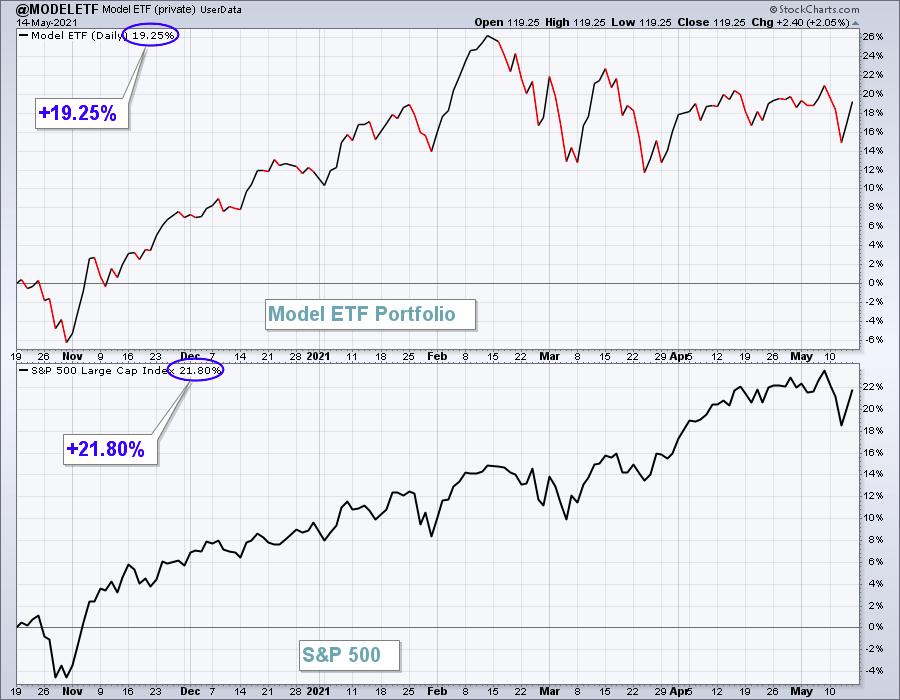
Here are how the Model ETF Portfolio component ETFs performed last week:
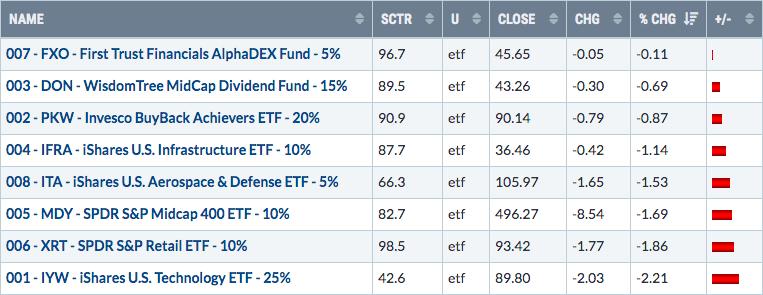
The technology ETF once again lagged, but there was enough relative strength among the other 7 ETFs to beat the S&P 500.
Happy trading!
Tom Bowley, Chief Market Strategist
EarningsBeats.com
"Better timing. Better trades."