
EB Weekly Portfolio Report - Sunday, June 20, 2021
Upcoming Earnings Reports
According to Zacks.com, the following companies will be reporting earnings this week and each is a component of one of our portfolios:
Monday, June 21: None
Tuesday, June 22: None
Wednesday, June 23: None
Thursday, June 24: FDX
Friday, June 25: None
PLEASE NOTE: The above companies were provided after scanning the Zacks Earnings Calendar. My research is limited to what Zacks provides and I also can make a mistake from time to time, so please check for earnings dates for all companies that you own. We do hold our portfolio stocks through one earnings report, but every EarningsBeats.com member must make his/her own investing/trading decisions about holding stocks into earnings reports as it's the most volatile (risky) time to own a stock.
Portfolio Rules and Objectives
Here are the common traits and objectives of our portfolios:
- There are 10 leading stocks from up to 10 leading industries in each portfolio (at the time of selection). Generally, there will only be one stock per industry group, but there could be exceptions.
- They are held for an entire 90-day period, with no stops in place. We strive for consistency, transparency, and simplicity in our portfolios. EB.com members may hold these stocks for the entire 90 days, trade them, use stops, etc., but for purposes of our calculation, we will make no exceptions to our "buy and hold for three months" strategy.
- Every stock will generally be held through ONE earnings report
- The expectation is that relative winners will carry the portfolio to outperformance
- They were all entered into as of the close on Friday, May 19th; members may choose to try to time better entries, but EB.com "purchased" as of May 19th's closing price
- Primary objective is to outperform the benchmark S&P 500
Here are several considerations for EB members:
- I would expect the Strong AD and Aggressive portfolios to be the riskiest, followed by the Model portfolio, and then the Income portfolio
- The Strong AD portfolio will be selected from a combination of rising accumulation/distribution lines and SCTRs above 70 at the time of selection. It is the only portfolio that does NOT require a revenue and EPS beat in its most recent quarterly earnings report
- The Income portfolio stocks will all pay dividends, with the expected average dividend yield to be at least 1.0%
- Drawdowns (losses) should be much milder on the Income portfolio, with more volatility expected on the other three; please review inception-to-date charts below to gain an idea of the volatility associated with each
- I believe the larger drawdown on the Income portfolio at the beginning of the pandemic was an anomaly, occurring as many defensive, higher-yielding companies uncharacteristically underperformed during a market decline.
- Large drawdowns last quarter were due to the rapid rotation from growth stocks to value stocks; each quarter, our portfolios are based on themes and there is never a guarantee that our analysis and beliefs will be proven correct
- You should own or trade these stocks in whatever manner is most comfortable for you; while we will buy all 10 stocks in the manner identified above, feel free to trade certain stocks or wait for pullbacks if the stocks are overbought
- We have no idea what risk each member is willing or able to take. We are not registered investment advisors so be sure you understand the risk you take. Please consult your financial advisor.
- EarningsBeats.com shareholders/employees may own all or some of the portfolio stocks from time to time.
Weekly Snapshot
Here's a weekly recap:
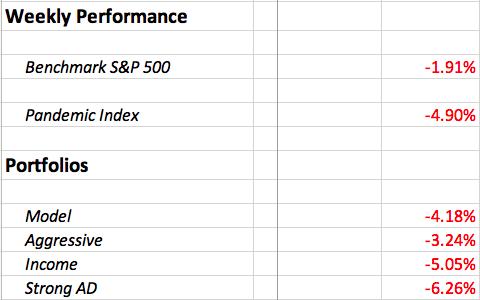
It was not a good week for our portfolios as the combination of Friday options expiry and significant rotation took a toll.
Weekly Summary
Benchmark S&P 500:
The S&P 500 struggled a bit last week, falling nearly 2%, as it dealt with more hot inflation data, the latest FOMC policy statement, an eroding yield spread that crushed many financial stocks, and a very weak retail sales report that hit a number of discretionary names hard. Oh yeah, throw in options expiration and it was quite a wild ride. I remain a bit nervous over the next week or so, but then we should begin to see the start of a pre-earnings run higher.
Model Portfolio:
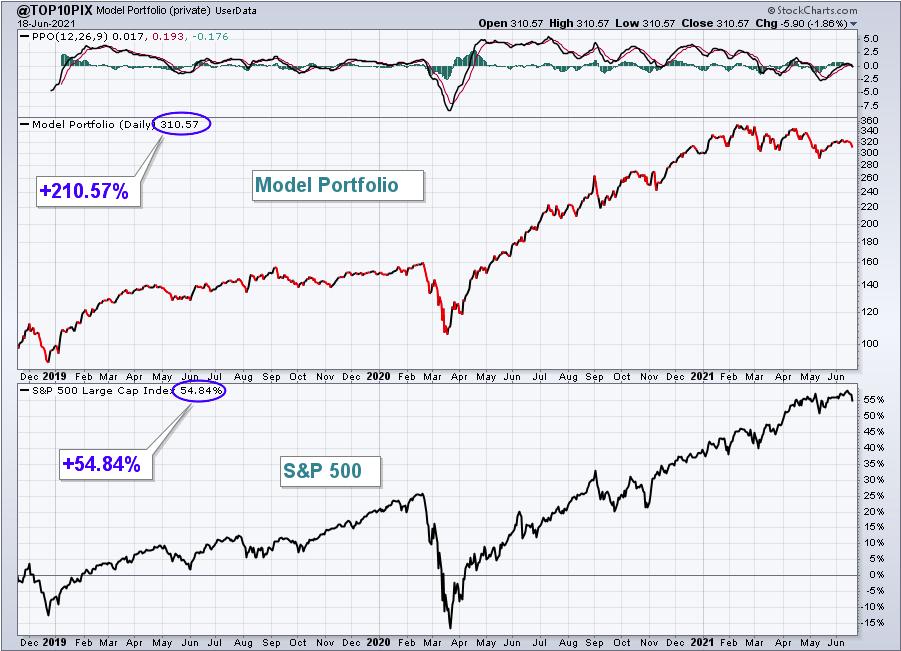
The Model Portfolio dropped 4.18%, . Here's the updated inception-to-date chart of the portfolio:
Here are how the Model portfolio component stocks performed last week:
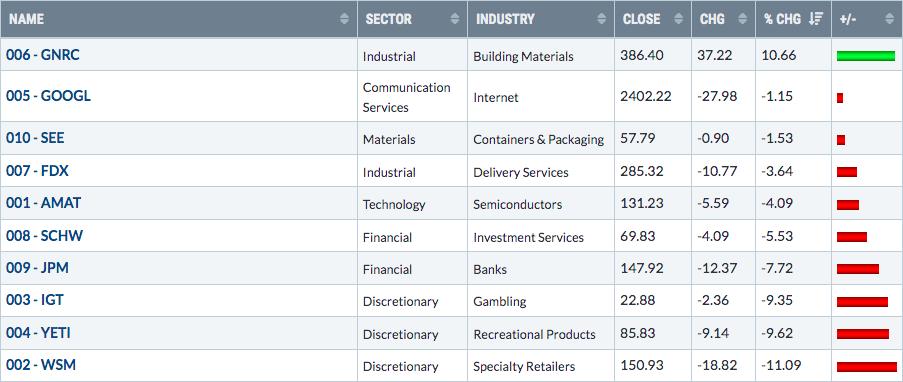
Weak discretionary stocks were the primary culprits of our significant underperformance last week in our Model Portfolio. I was very surprised to see YETI and WSM reach the levels they did. I expect a rebound in both as the new support levels are as follows:
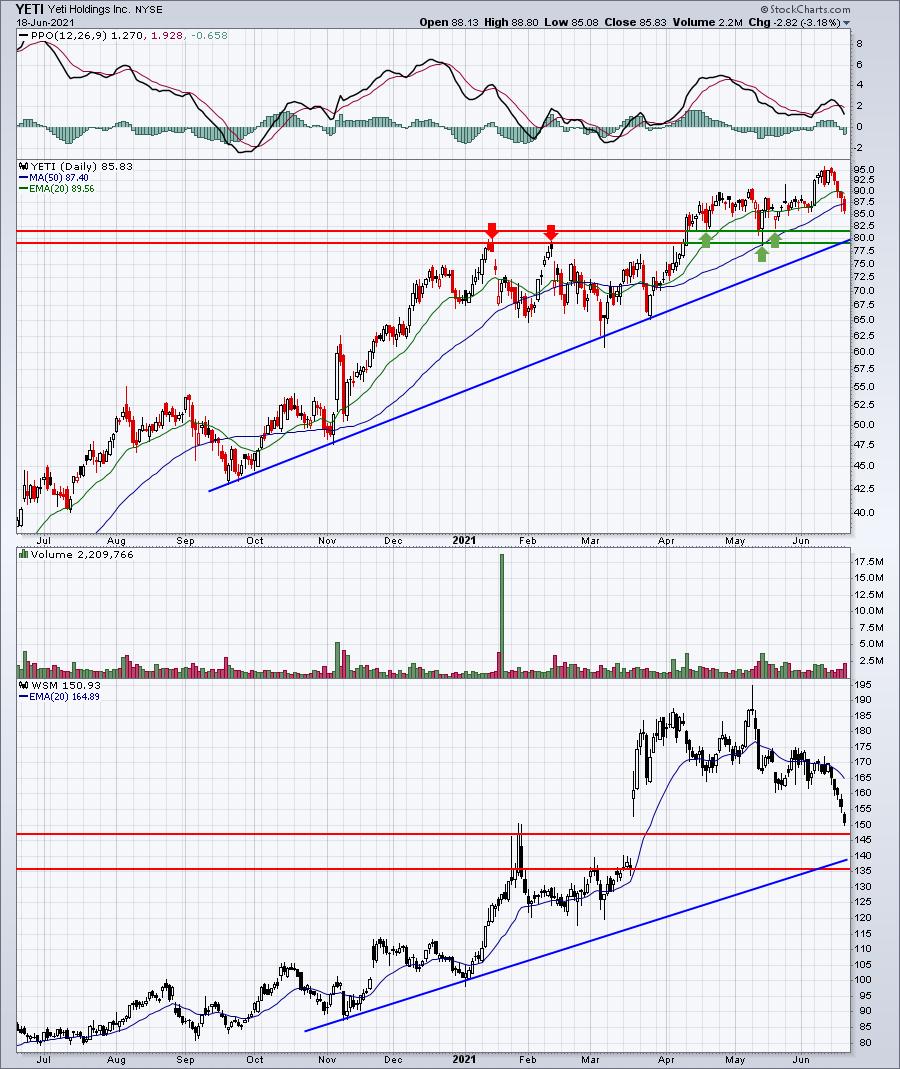
I still like both stocks, but if the overall market remains weak, especially discretionary stocks, then the price and trendline support levels reflected could be tested.
Aggressive Portfolio:
The Aggressive Portfolio lost 3.24%, also trailing the S&P 500. Here's the updated inception-to-date chart of the portfolio:
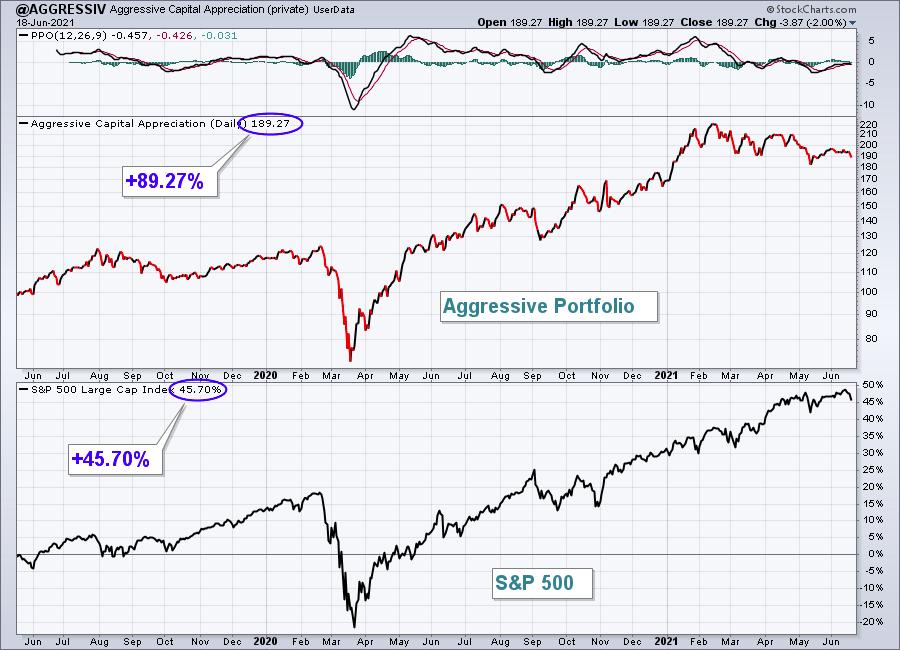
Here are how the Aggressive portfolio component stocks performed last week:
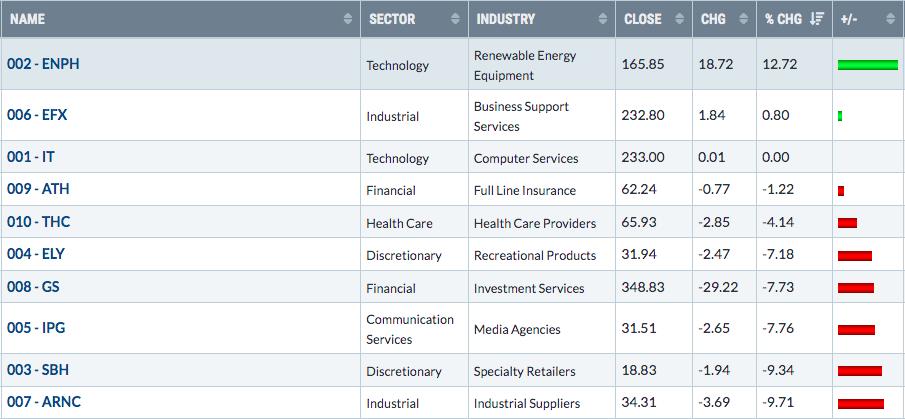
ENPH helped to offset what otherwise was a pretty rough week for this portfolio as 5 component stocks fell 7% or more last week. The worst performer last week, ARNC, is being hurt more by its industry group than anything else as it remains a leader in its group:
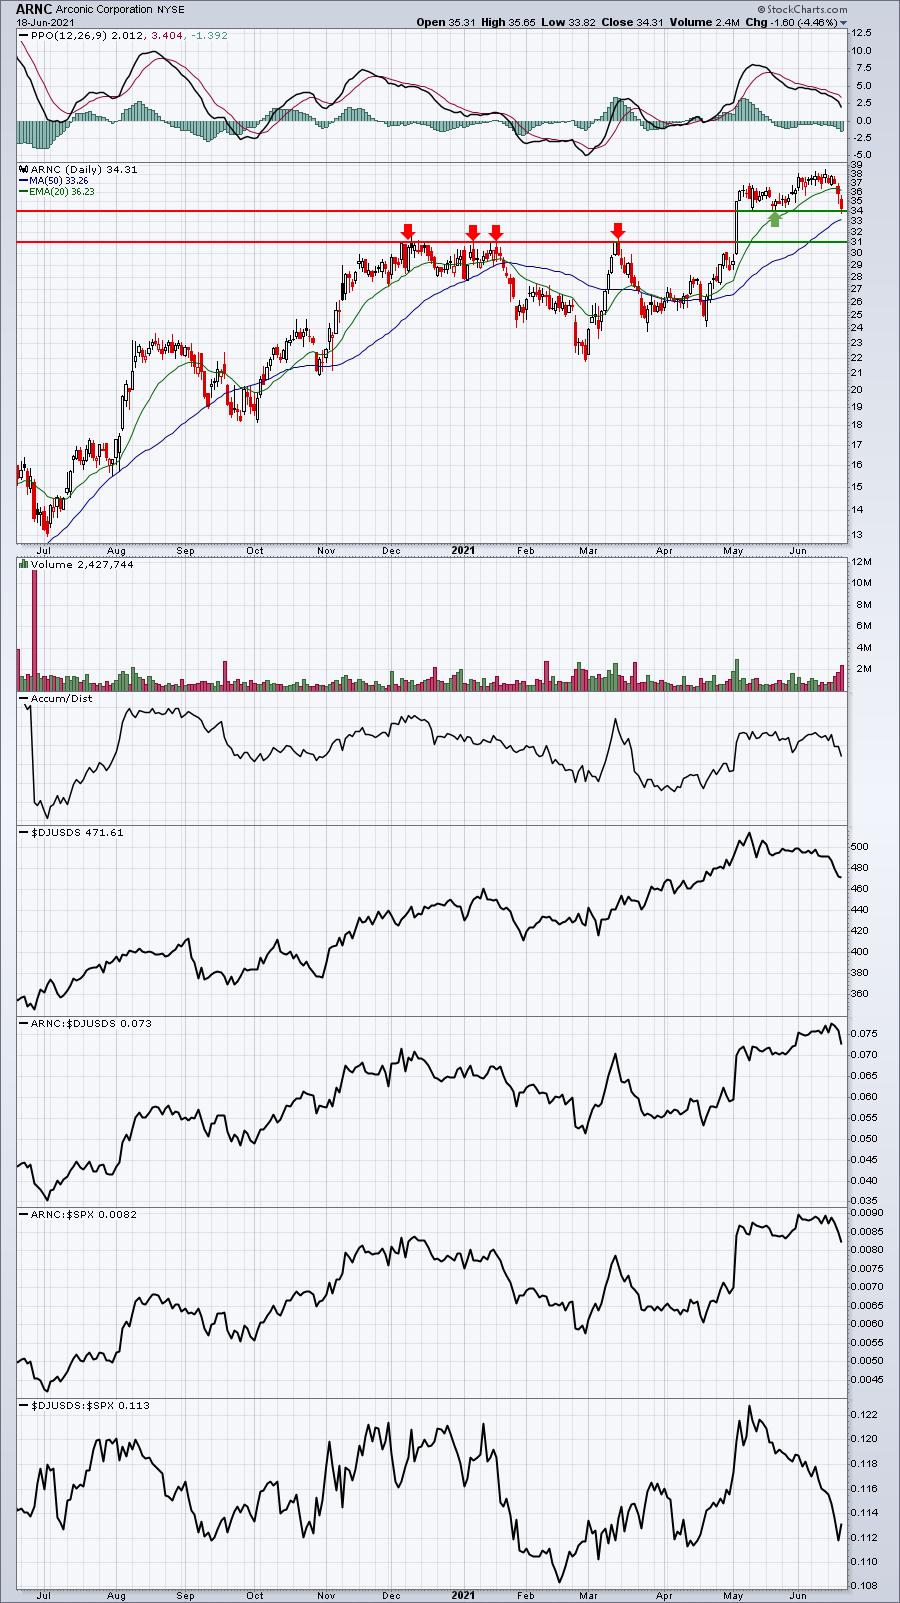
The 34 price support is important, because if it fails to hold, I don't see a whole lot aiding ARNC until more critical price support near 31 is reached.
Income Portfolio:
The Income Portfolio fell 5.05% and is now trailing the benchmark S&P 500 by 5 percentage points this quarter. Here's the updated inception-to-date chart of the portfolio:
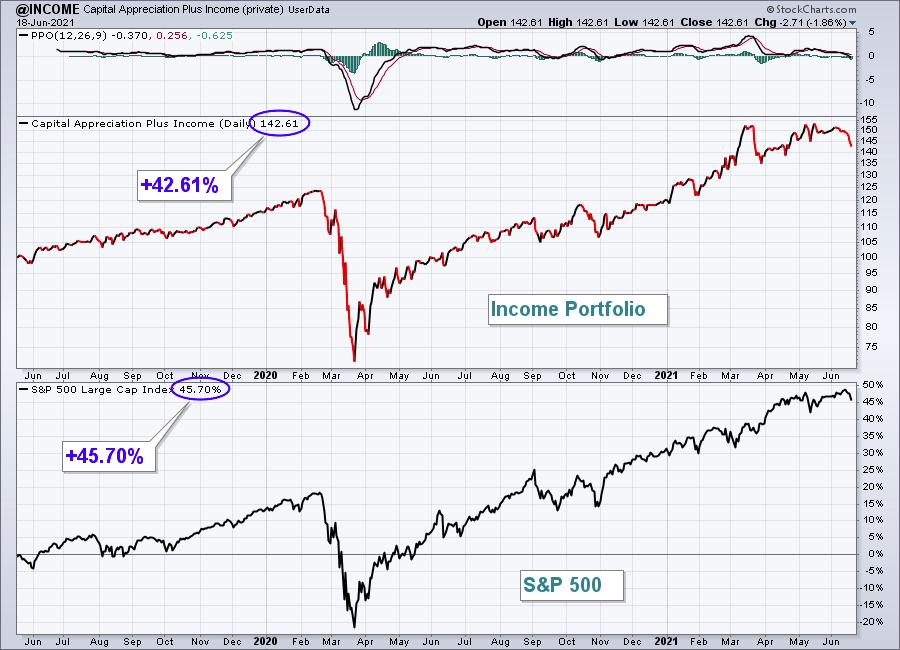
Here are how the Income portfolio component stocks performed last week:
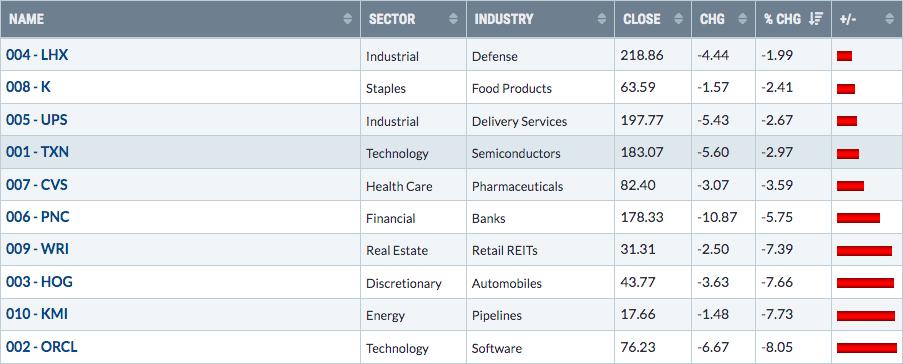
There wasn't a bright spot in the Income Portfolio last week as all 10 stocks fell. The worst performer was ORCL, which posted better-than-expected earnings and saw a "sell on the news" reaction:
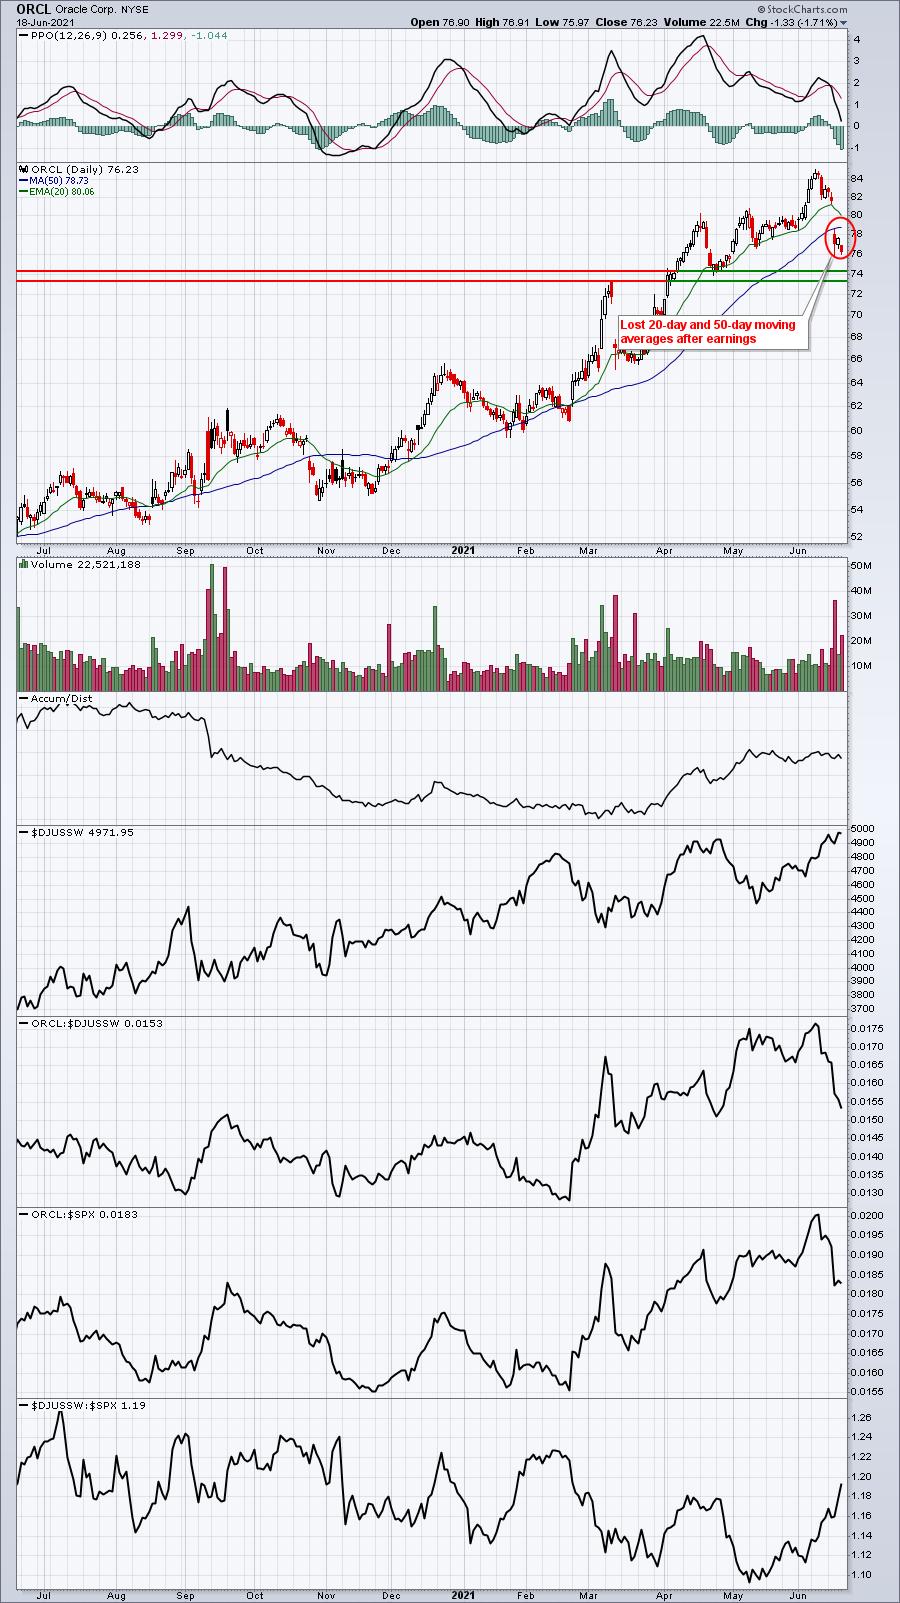
Key support should be found in the 73-74 area.
Strong AD Portfolio:
The Strong AD Portfolio tumbled 6.26%, relinquishing much of its quarter-to-date advantage over the S&P 500 . Here's the updated inception-to-date chart of the portfolio:
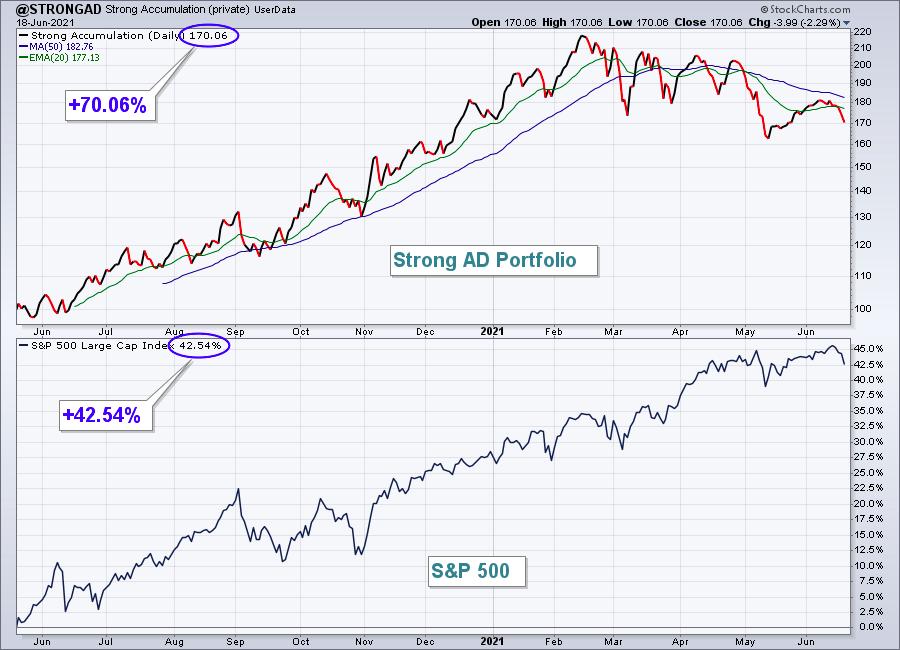
Here are how the Strong AD portfolio component stocks performed last week:
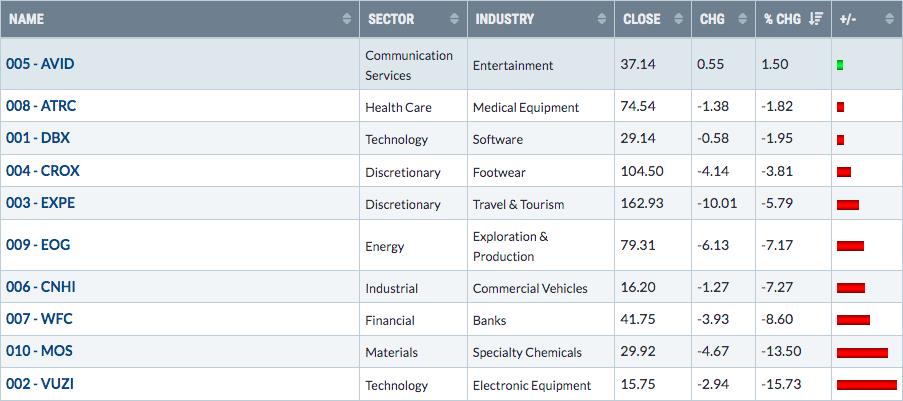
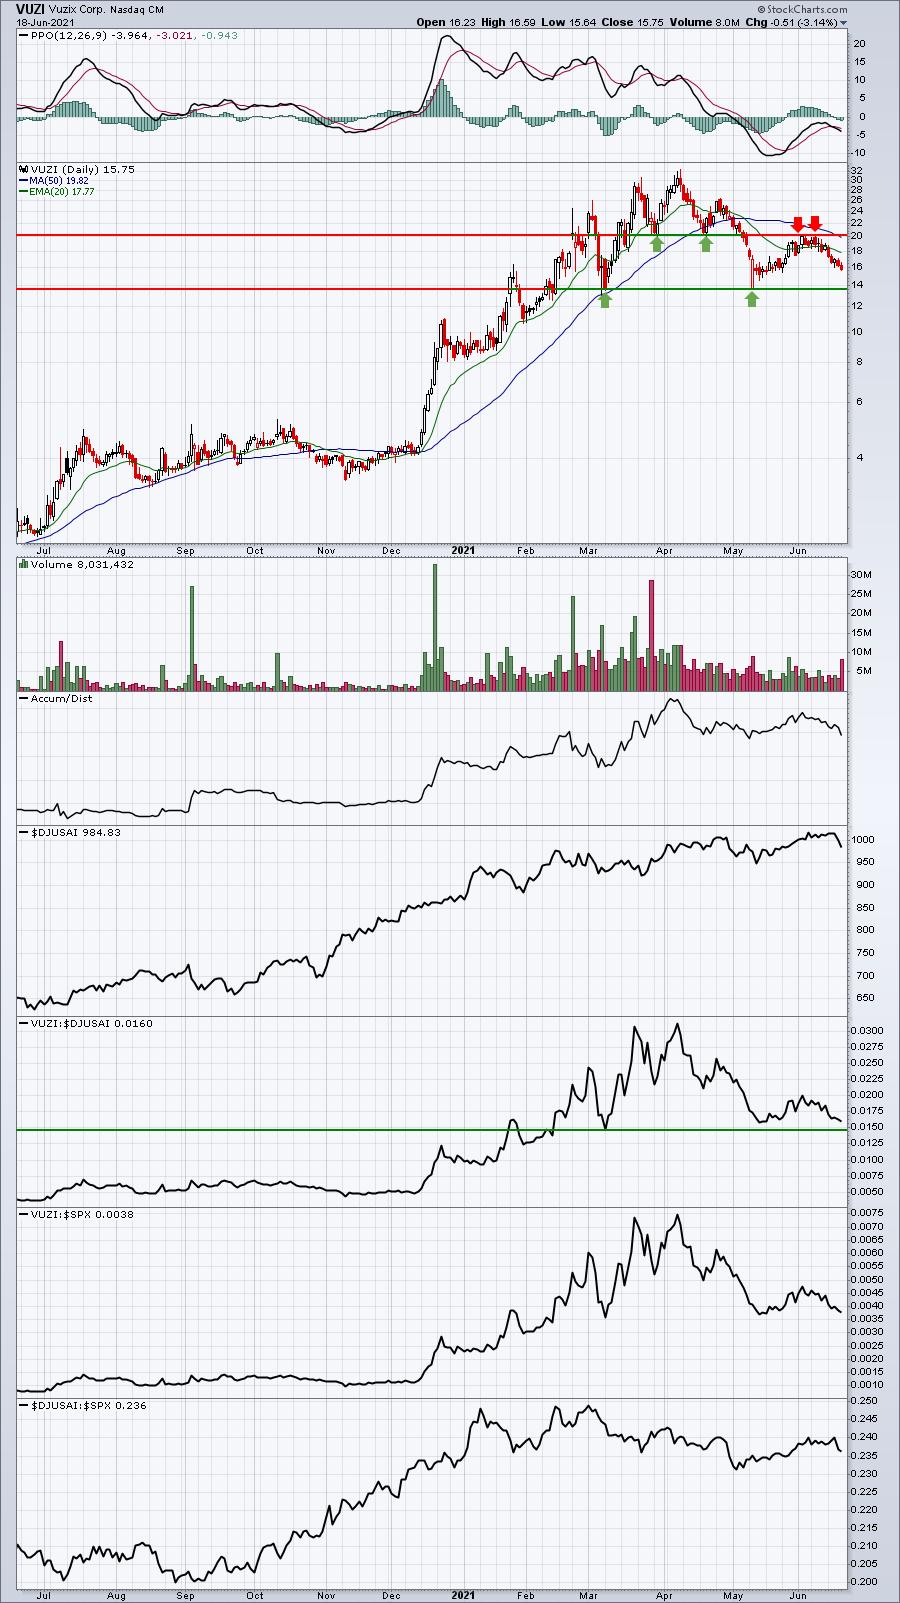
VUZI fell 15.7% last week, but it's simply a volatile stock. If you own it, you'll need to be prepared for a lot of back and forth. Currently, the price range is 14 to 20, as reflected below:
Summary
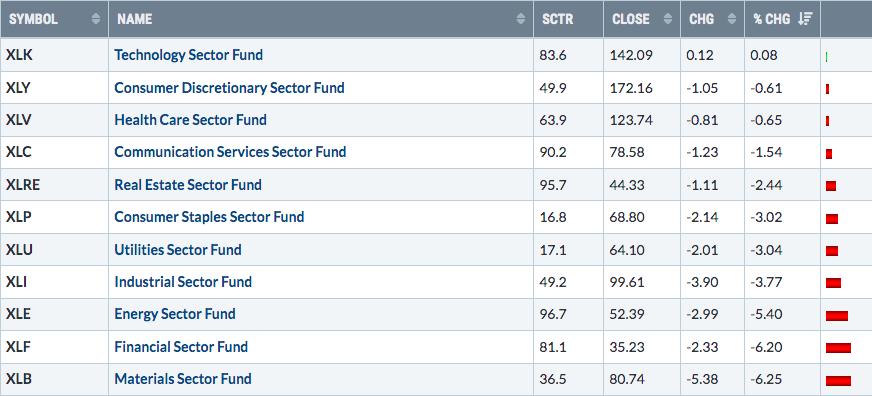
The stock market had to digest a lot last week and trying to decipher what really mattered and what didn't was difficult because it was options expiration week. Fundamentally, the wild ride in treasuries (and yields) last week ended with yields falling. That put tremendous pressure on financials, which have been leading the market higher in 2021. They didn't lead last week, however, as they, along with materials (XLB), dragged the overall market lower:
I see 3 major themes shaping up that bear watching:
The Spread
The chart that really mattered to financials was the spread, or the difference between the 10-year and 2-year treasury yields ($UST10Y-$UST2Y). Here's a chart that shows the correlation between this spread and the relative strength of financials:
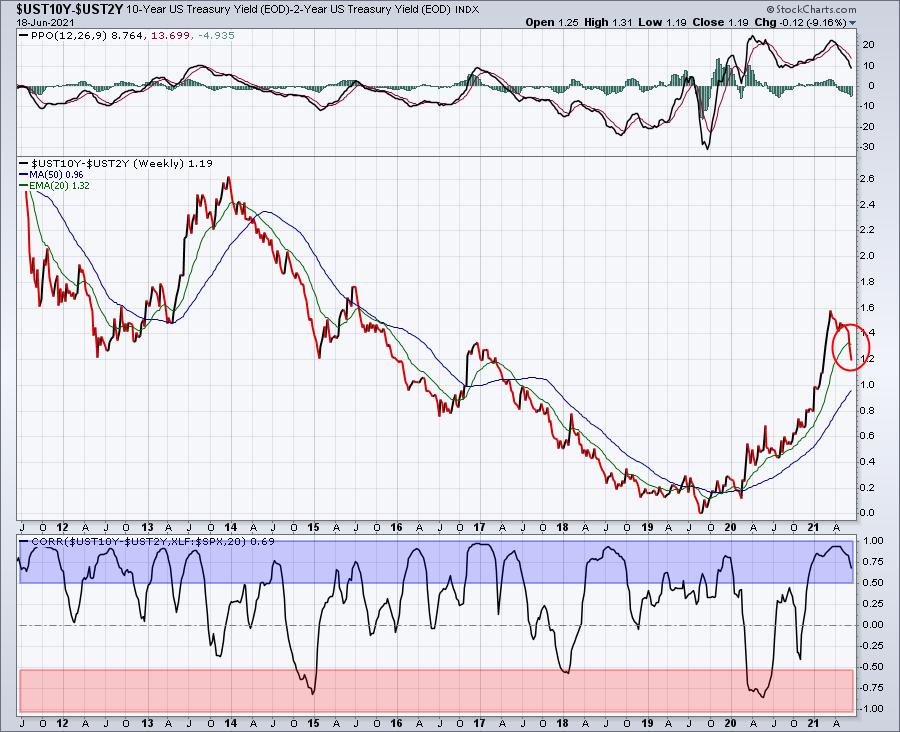
You can see that when this spread is climbing, it benefits financials. When the opposite is true, financials struggle. The blue-shaded area highlights the mostly positive correlation here. Rarely do we see the correlation move to a negative 0.5 reading - only 3 times in the past 10 years. So, if you're holding financial stocks and you're wondering what makes them tick, the above chart is it.
The Move Back to Growth
A second major development that's taking place is the significant rotation back to growth stocks from their value counterparts (IWF:IWD). That is a statement by Wall Street to disregard all the inflationary "noise". This ratio rose back and closed just above key relative resistance in the 1.69-1.70 area:
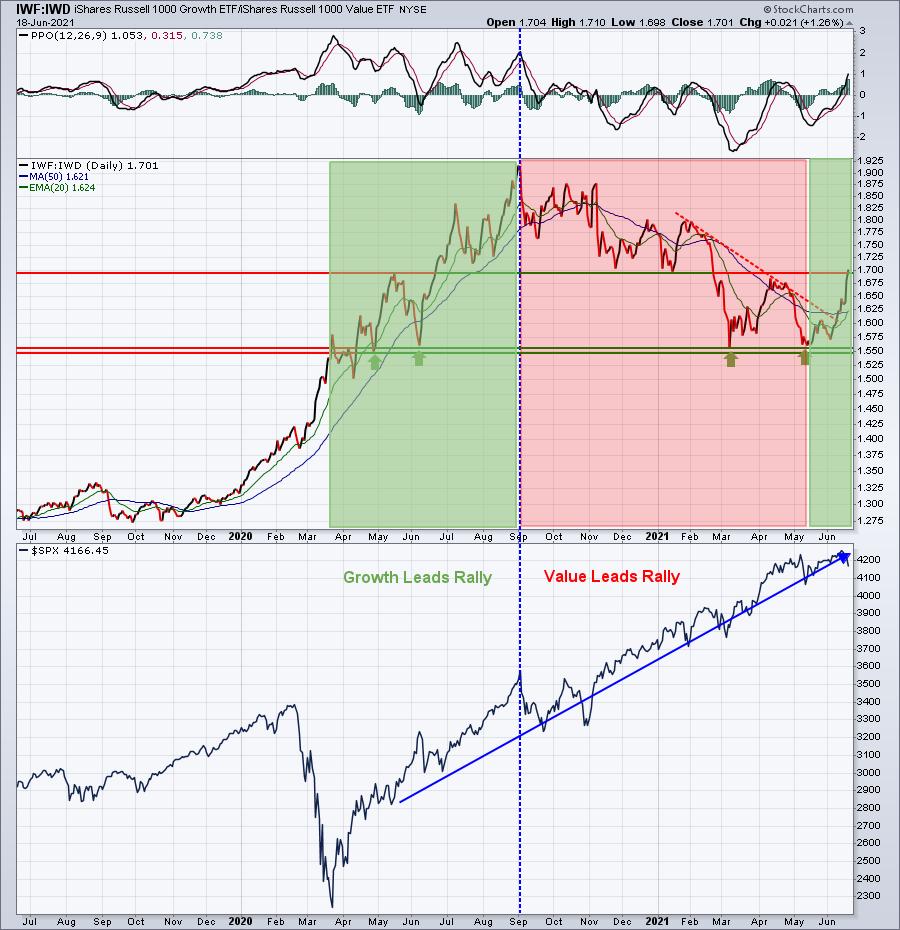
For me, the safest bet is that the stock market wants higher prices. Repositioning into growth vs. value is a much more difficult task, although growth tends to perform better than value during most periods of a secular bull market.
The Dollar Surges
If you've been following me for awhile, you know I've been sticking to my guns that the dollar will move higher in 2021. That call wasn't looking very good, but key support on the U.S. Dollar Index ($USD) was never lost. Last week, as the dollar soared following the Fed meeting, materials (XLB) cratered on a relative basis:
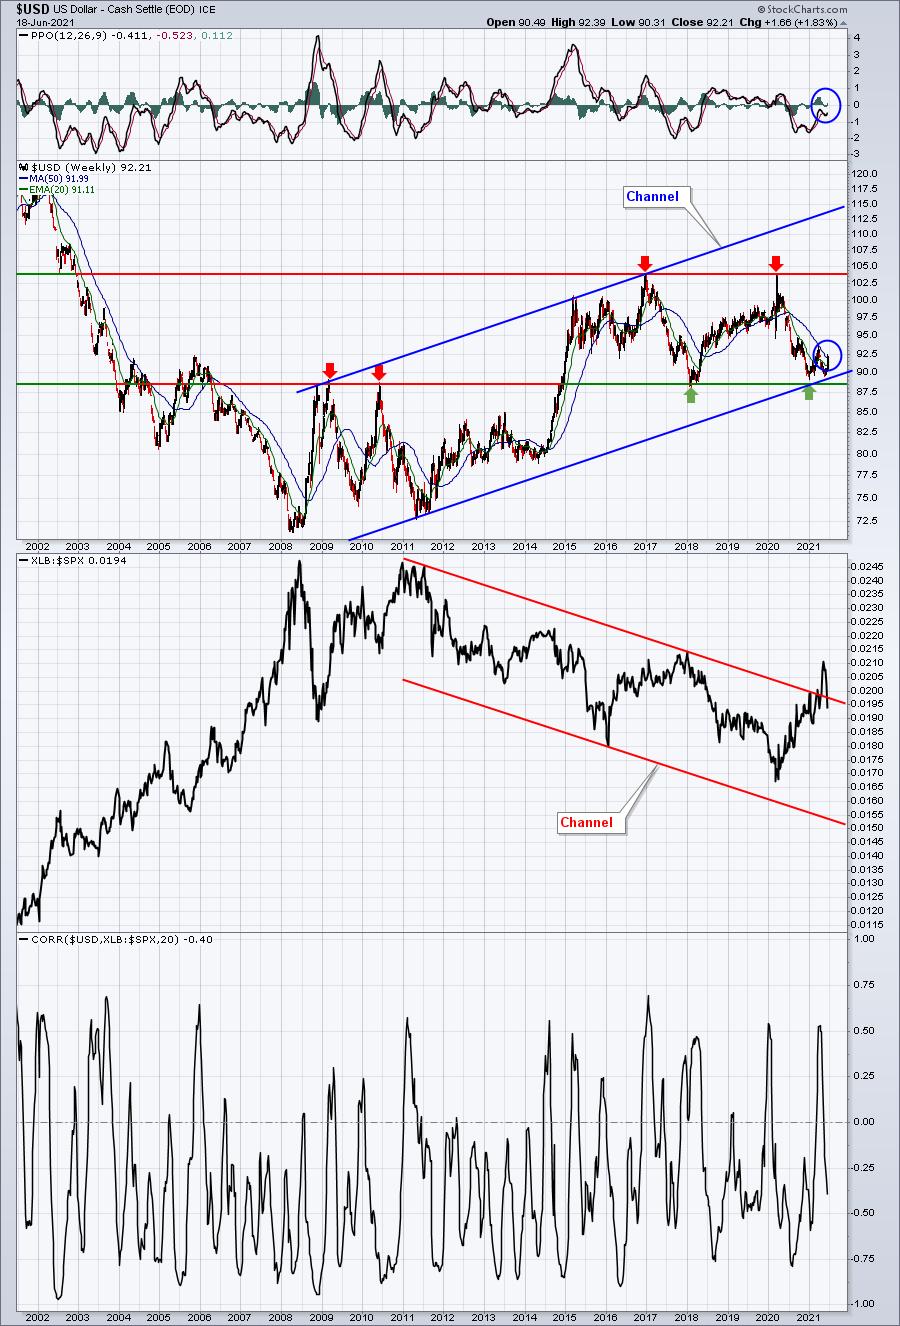
The bottom panel shows that there's mostly an inverse correlation between the direction of the dollar and the relative strength of materials. The dollar ($USD) closed above its 20-week EMA and 50-week SMA for the first time in a year. This development, while bullish for the dollar, is quite bearish for materials and commodity prices in general. A rising dollar will help take care of inflationary concerns.
Model ETF Portfolio
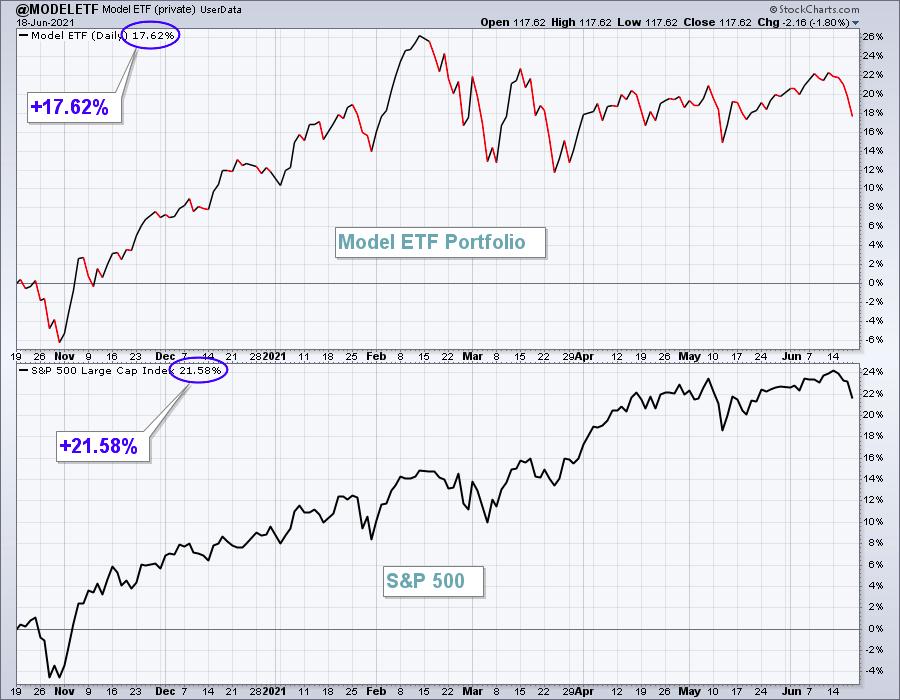
Our Model ETF Portfolio fell 3.84%, and it's now nearly even with the S&P 500 this quarter, which also lost ground last week.
Here's the updated inception-to-date chart of the Model ETF Portfolio:
Here are how the Model ETF Portfolio component ETFs performed last week:
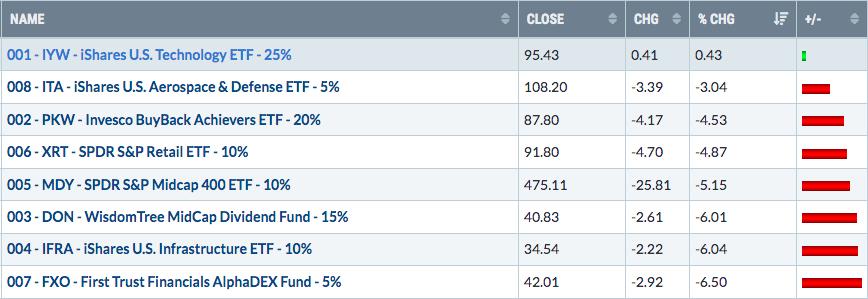
The sudden shift in the market could be seen in our Model ETF performance last week. 7 of our 8 ETFs had very rough weeks, with only technology - our largest holding - performing well.
Happy trading!
Tom Bowley, Chief Market Strategist
EarningsBeats.com
"Better timing. Better trades."