
EB Weekly Portfolio Report - Sunday, August 22, 2021
Upcoming Earnings Reports
According to Zacks.com, the following companies will be reporting earnings this week and each is a component of one of our portfolios:
Monday, August 23: None
Tuesday, August 24: None
Wednesday, August 25: ULTA
Thursday, August 26: None
Friday, August 27: None
PLEASE NOTE: The above companies were provided after scanning the Zacks Earnings Calendar. My research is limited to what Zacks provides and I also can make a mistake from time to time, so please check for earnings dates for all companies that you own. We do hold our portfolio stocks through one earnings report, but every EarningsBeats.com member must make his/her own investing/trading decisions about holding stocks into earnings reports as it's the most volatile (risky) time to own a stock.
Portfolio Rules and Objectives
Here are the common traits and objectives of our portfolios:
- There are 10 leading stocks from up to 10 leading industries in each portfolio (at the time of selection). Generally, there will only be one stock per industry group, but there could be exceptions.
- They are held for an entire 90-day period, with no stops in place. We strive for consistency, transparency, and simplicity in our portfolios. EB.com members may hold these stocks for the entire 90 days, trade them, use stops, etc., but for purposes of our calculation, we will make no exceptions to our "buy and hold for three months" strategy.
- Every stock will generally be held through ONE earnings report
- The expectation is that relative winners will carry the portfolio to outperformance
- They were all entered into as of the close on Thursday, August 19th; members may choose to try to time better entries, but EB.com "purchased" as of August 19th's closing price
- Primary objective is to outperform the benchmark S&P 500
Here are several considerations for EB members:
- I would expect the Strong AD and Aggressive portfolios to be the riskiest, followed by the Model portfolio, and then the Income portfolio
- The Strong AD portfolio will be selected from a combination of rising accumulation/distribution lines and SCTRs above 70 at the time of selection. It is the only portfolio that does NOT require a revenue and EPS beat in its most recent quarterly earnings report
- The Income portfolio stocks will all pay dividends, with the expected average dividend yield to be at least 1.0%
- Drawdowns (losses) should be much milder on the Income portfolio, with more volatility expected on the other three; please review inception-to-date charts below to gain an idea of the volatility associated with each
- I believe the larger drawdown on the Income portfolio at the beginning of the pandemic was an anomaly, occurring as many defensive, higher-yielding companies uncharacteristically underperformed during a market decline.
- Large drawdowns in the February through May period were due to the rapid rotation from growth stocks to value stocks; each quarter, our portfolios are based on themes and there is never a guarantee that our analysis and beliefs will be proven correct
- You should consider owning or trading these stocks in whatever manner is most comfortable for you; while we will buy all 10 stocks in the manner identified above, feel free to trade certain stocks or wait for pullbacks if the stocks are overbought
- We have no idea what risk each member is willing or able to take. We are not registered investment advisors so be sure you understand the risk you take. Please consult your financial advisor.
- EarningsBeats.com shareholders/employees may own all or some of the portfolio stocks from time to time.
Weekly Snapshot
Here's a weekly recap:
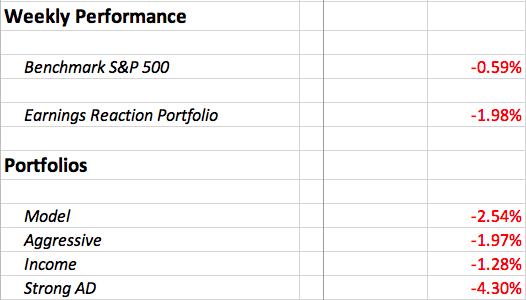
It was a rough end to our latest quarter as our previous portfolios had difficult finishes through Thursday. We did bounce back nicely on Friday with our new portfolios, but it was too little too late to save the week on an overall basis.
Weekly Summary
Benchmark S&P 500:
Technology (XLK) rebounded a bit last week, but most of the strength was centered in defensive areas. The easiest way to visualize this is to look at the Sector Summary on StockCharts for last week:
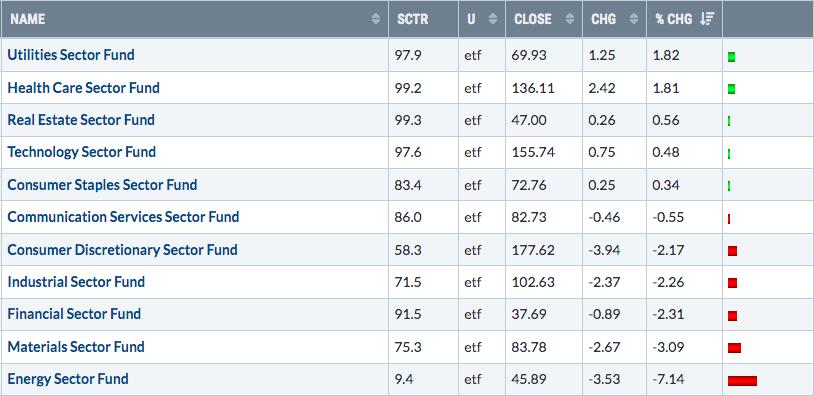
Energy (XLE) and materials (XLB) badly lagged for a few reasons. First, crude oil prices ($WTIC) fell more than $6 per barrel to $62.14, the lowest weekly close since April. Second, there's an ugly negative divergence on the weekly WTIC chart that suggests the selling in crude oil isn't quite over. Third, the U.S. Dollar Index ($USD) hit 93.75 last week, its highest reading since early November 2020. A rising dollar is synonymous with relative weakness in energy and materials. Finally, two key areas of the materials sector that have been relentless to the upside - aluminum ($DJUSAL) and steel ($DJUSST) - both have HORRENDOUS negative divergences on their weekly charts. Upcoming drops are likely to be swift and severe.
Model Portfolio:
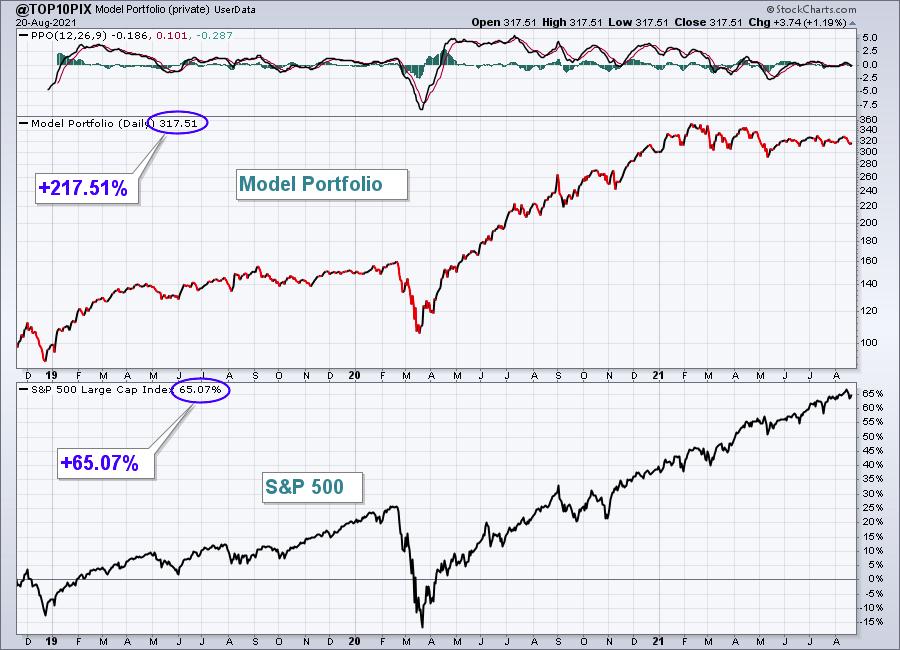
The Model Portfolio fell 2.54%, lagging the S&P 500. Here's the updated inception-to-date chart of the portfolio:
Here are how the Model portfolio component stocks performed on Friday:
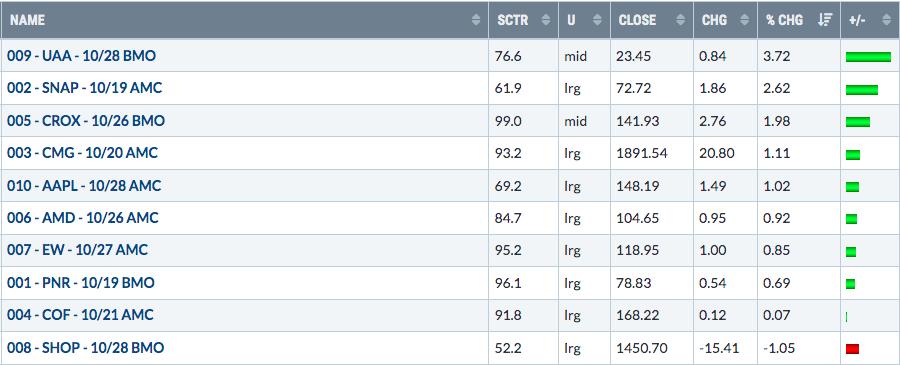
9 of our 10 "new" Model Portfolio component stocks finished higher on Friday. The one loser, SHOP, remains in an uptrend:
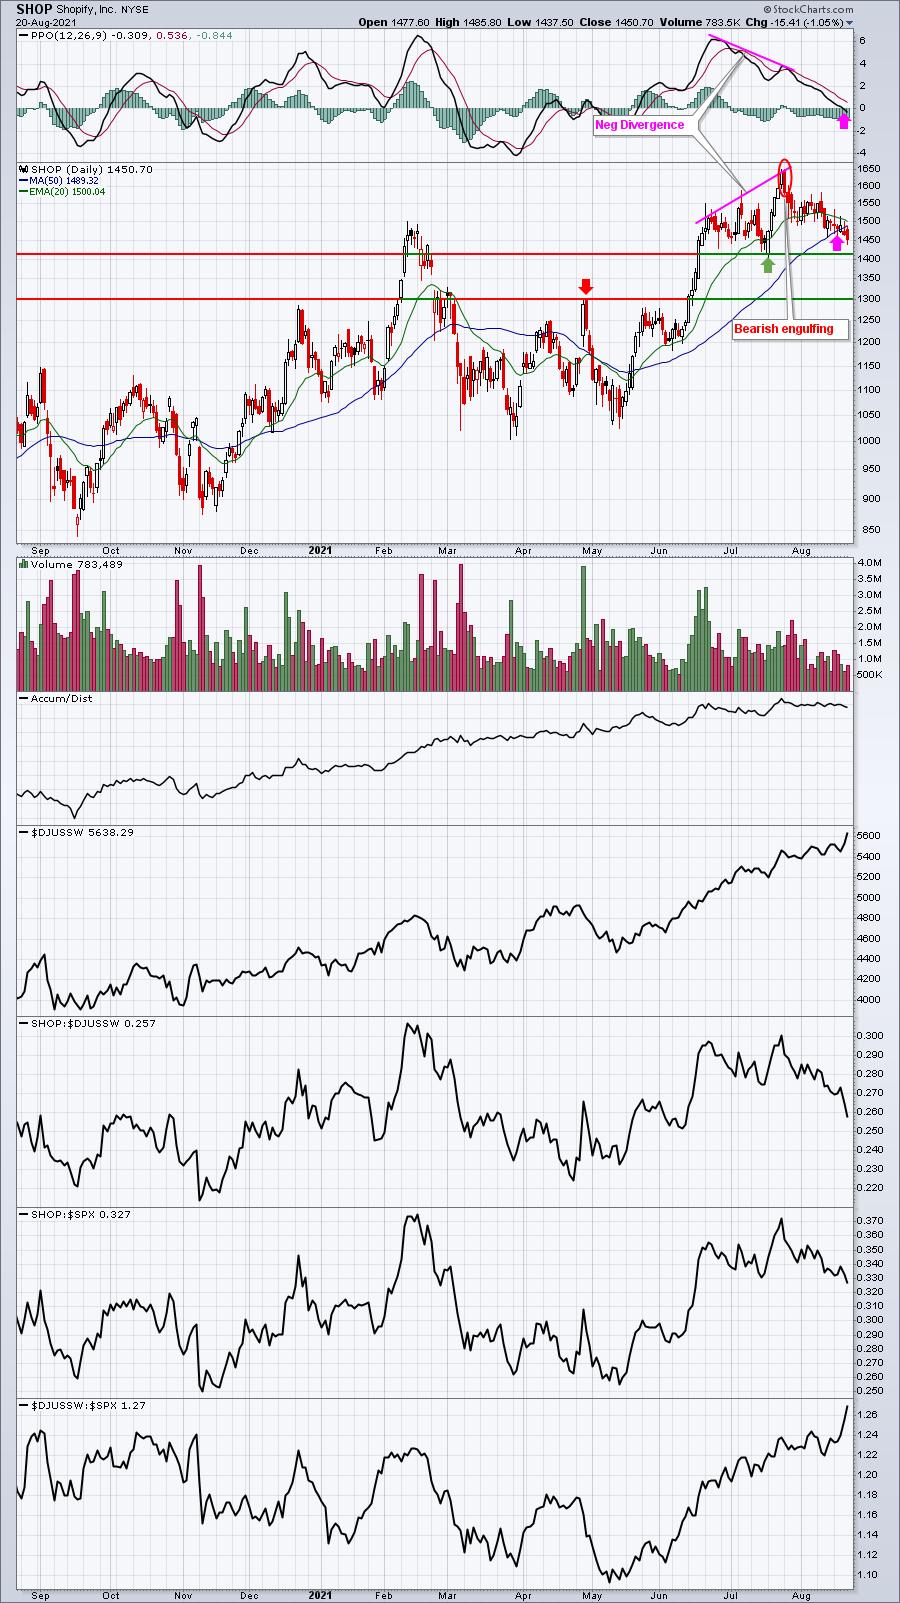
I believe we've entered at a relatively solid point on SHOP's chart. Software ($DJUSSW) remains strong and, until recently, SHOP was near its 52-week relative high. But at that most recent high, a reversing candle (bearish engulfing) printed with a negative divergence in play. That typically suggests a 50-day SMA/PPO centerline reset (pink arrows), which we've seen. I look for additional strength ahead for SHOP, but have annotated two key price support levels in the event that SHOP drifts lower near-term.
Aggressive Portfolio:
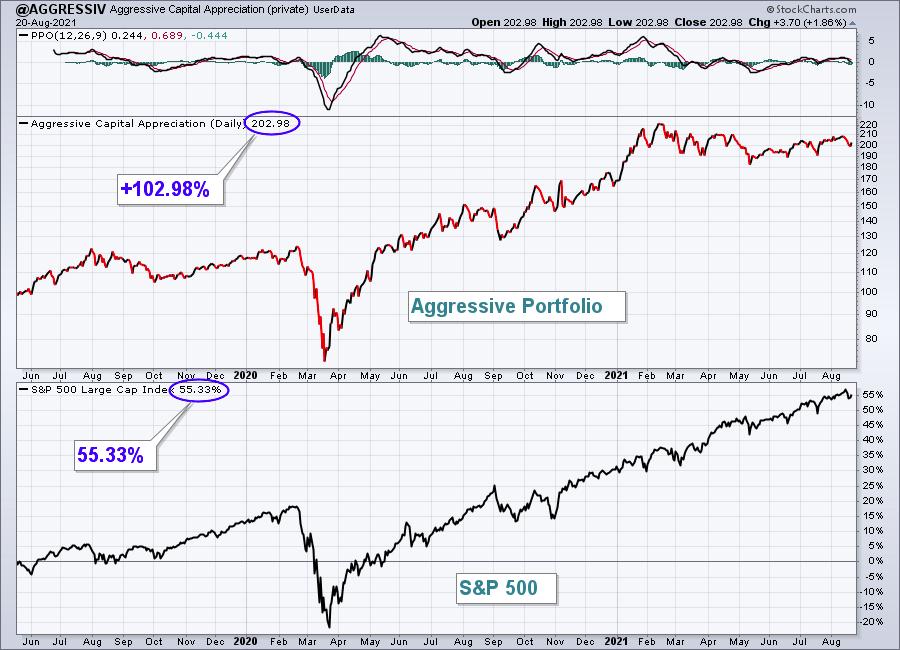
The Aggressive Portfolio dropped 1.97%, barely failing to keep pace with the S&P 500 for last quarter. Here's the updated inception-to-date chart of the portfolio:
Here are how the Aggressive portfolio component stocks performed on Friday:
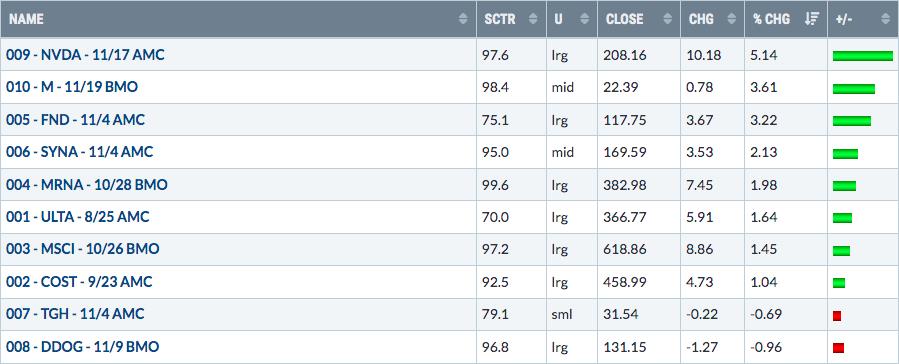
M had a huge response to its earnings report from Thursday morning. After pulling back a bit on Friday, it regained strength into the close. The volume has been massive:
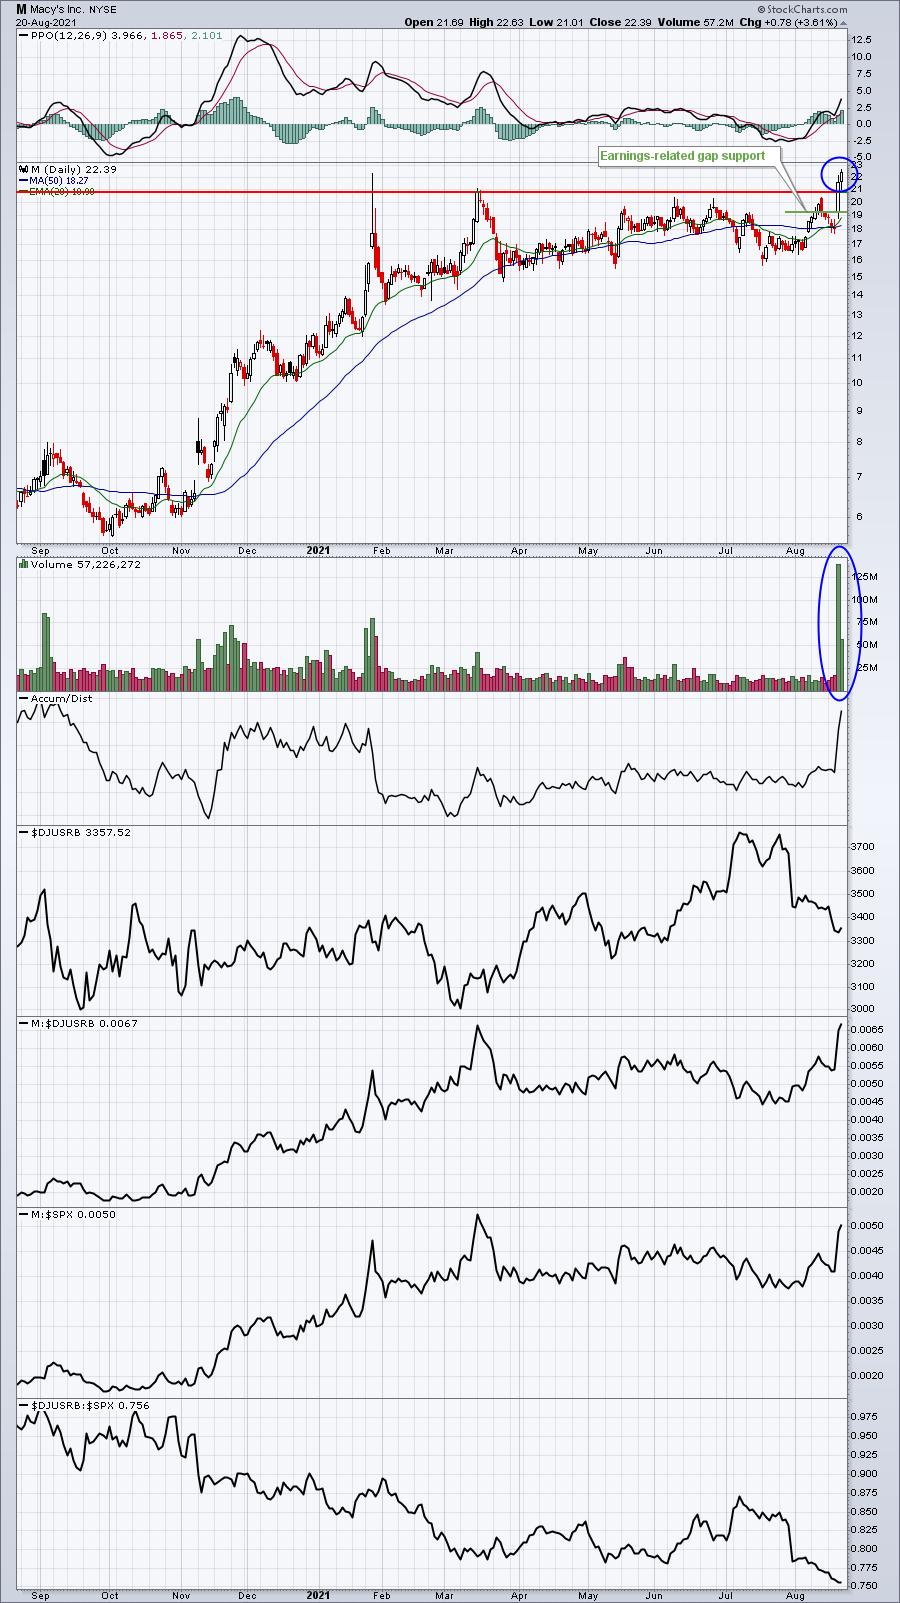
The only real negative here is that M is part of the very weak broadline retail group ($DJUSRB). The DJUSRB is declining and at a 52-week relative low vs. the S&P 500.
NVDA jumped again after reporting excellent results last quarter. It closed at an all-time high on Friday and its AD line and its relative strength line vs. its semiconductor peers ($DJUSSC) did the same:
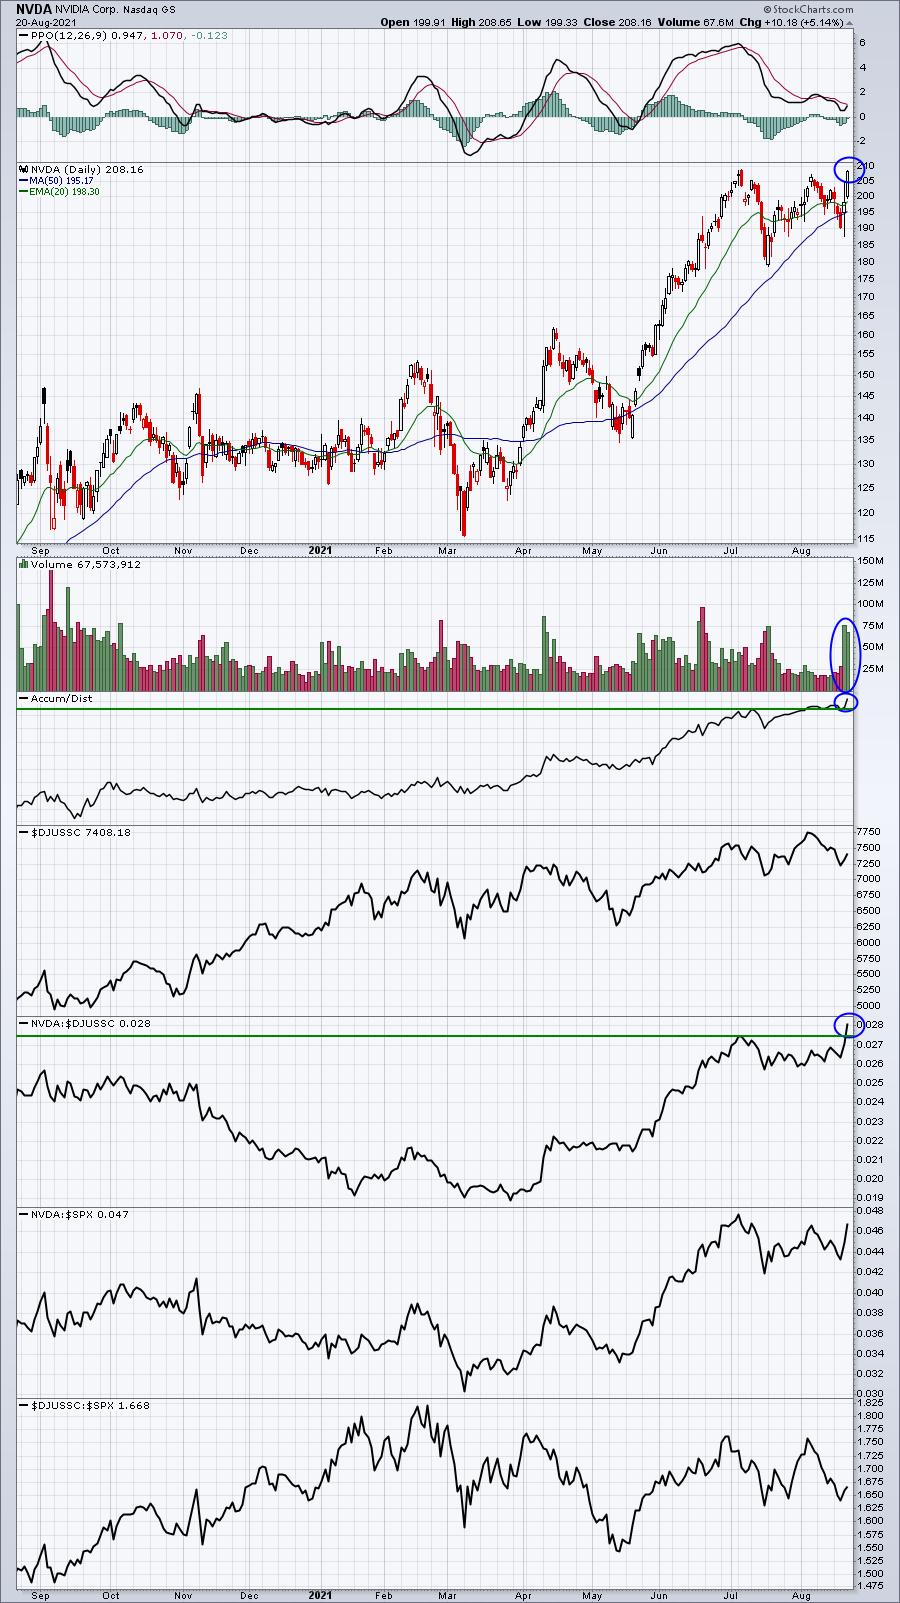
NVDA seems poised to head higher after this consolidation period breaks. That may have occurred on Friday, but if so, we'll need to see follow through next week.
Income Portfolio:
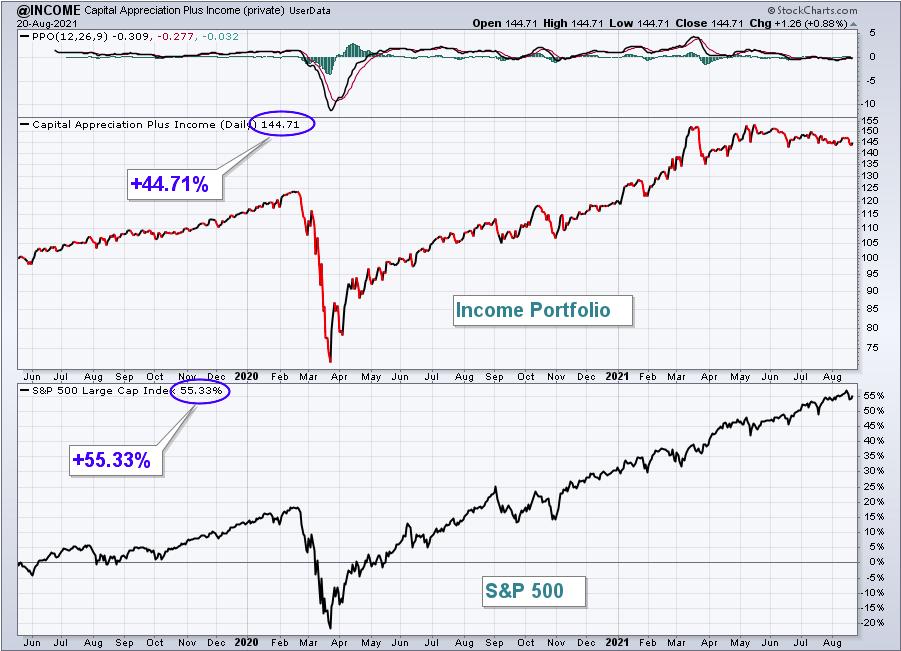
The Income Portfolio dropped 1.28%, trailing the S&P 500 for the week and badly for the quarter. Here's the updated inception-to-date chart of the portfolio:
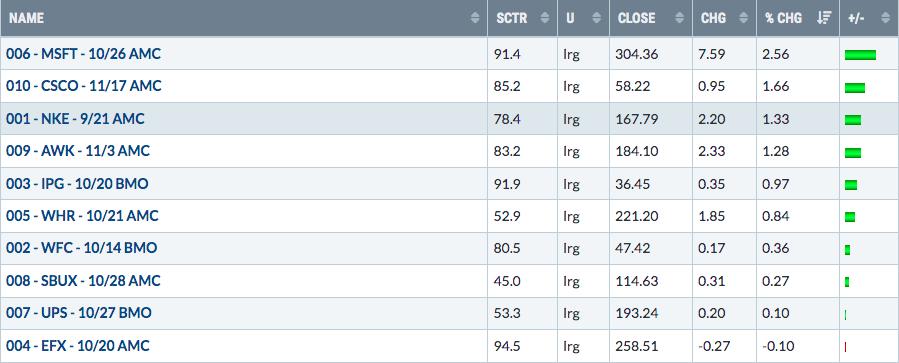
Here are how the Income portfolio component stocks performed on Friday:
UPS is one of the more interesting portfolio selections this quarter. After reporting quarterly results in July, we saw UPS gap lower and move down to test key gap support from April - after its previous quarterly report:
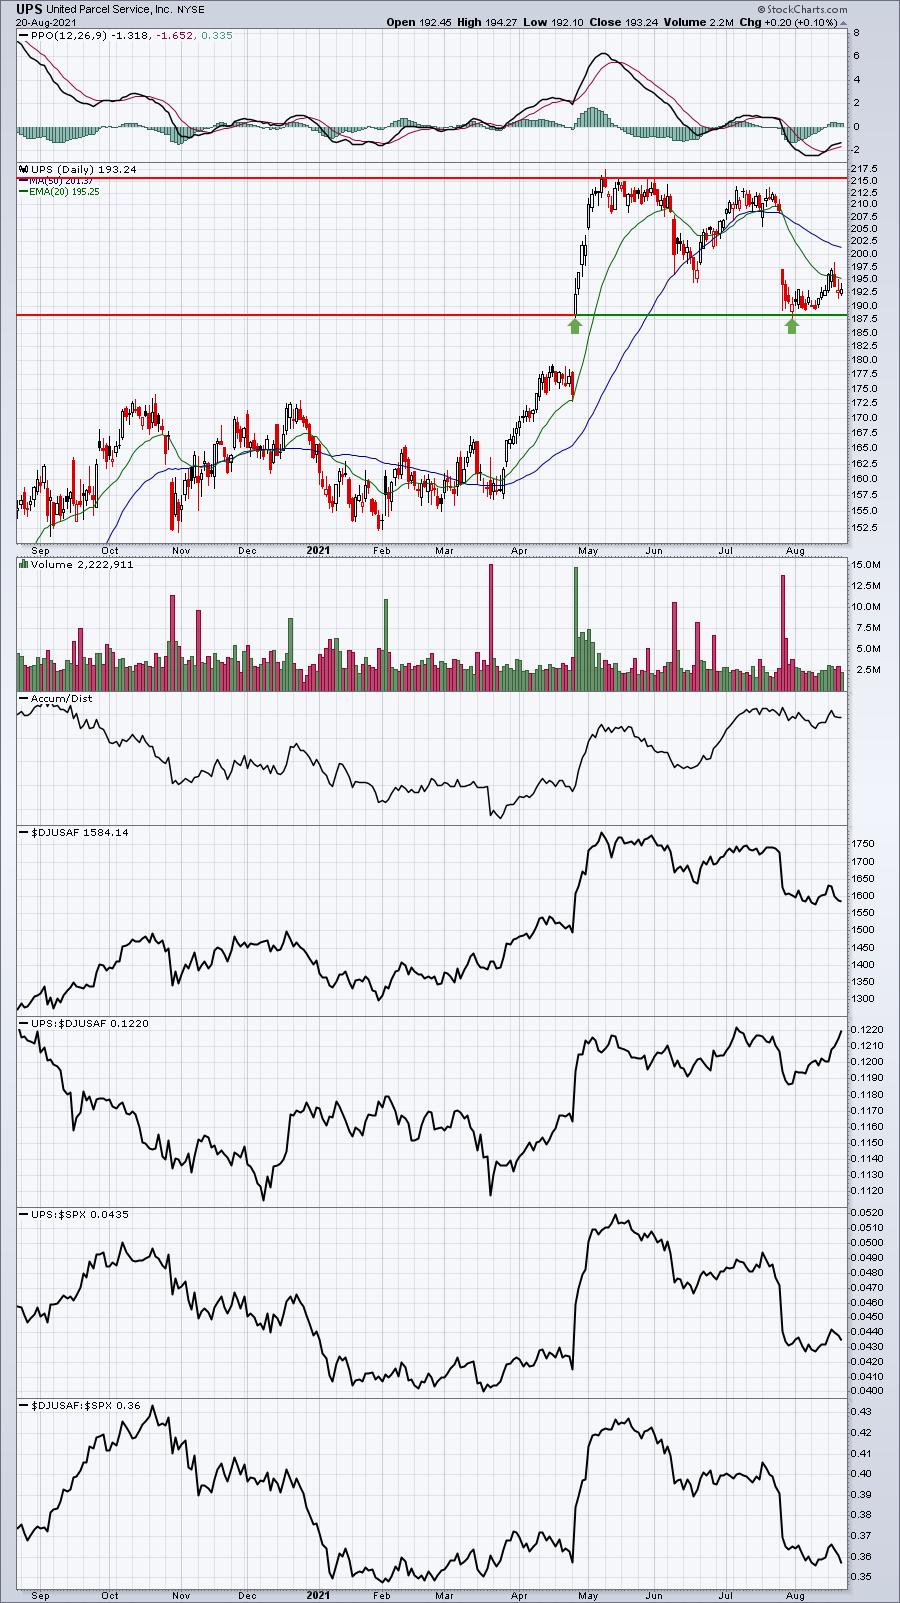
I want to make two key points about this chart. First, UPS is near a 52- week high vs. its delivery services peers ($DJUSAF). It's the primary leader in the group. Second, despite the earnings-related gap lower, check out the AD line on UPS. I believe UPS is being accumulated on the recent selling. My guess is that we're going to see UPS back to challenge highs around the 215 level over the next 3 months. We'll see.
Strong AD Portfolio:
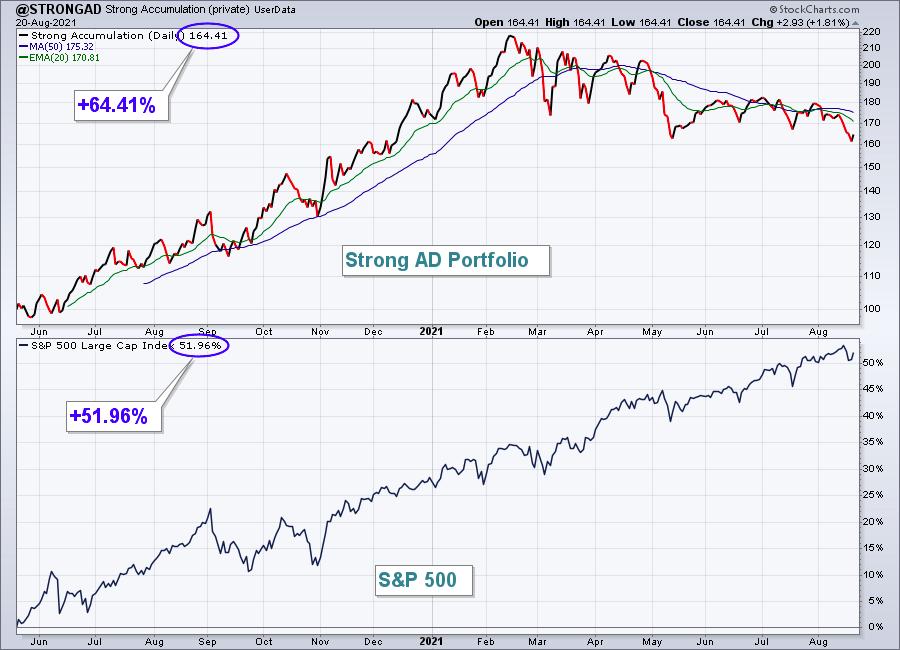
The Strong AD Portfolio tumbled 4.30%, falling further behind the S&P 500. Here's the updated inception-to-date chart of the portfolio:
Here are how the Strong AD portfolio component stocks performed on Friday:
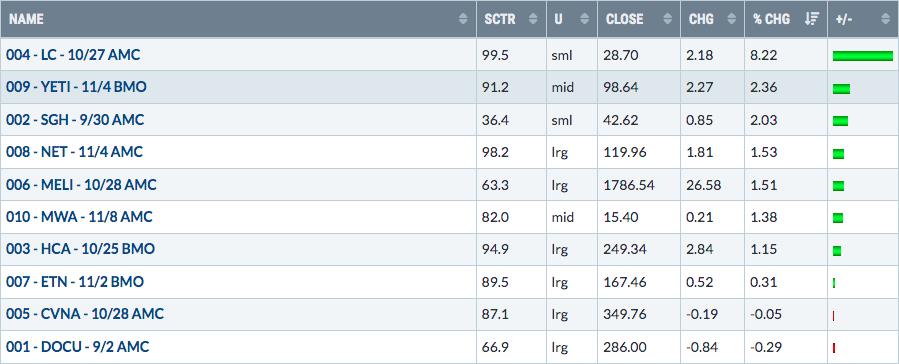
DOCU recently was setting all-time highs and it all started with a solid earnings report on very heavy volume back in June. The problem, however, was the negative divergence that emerged in June:
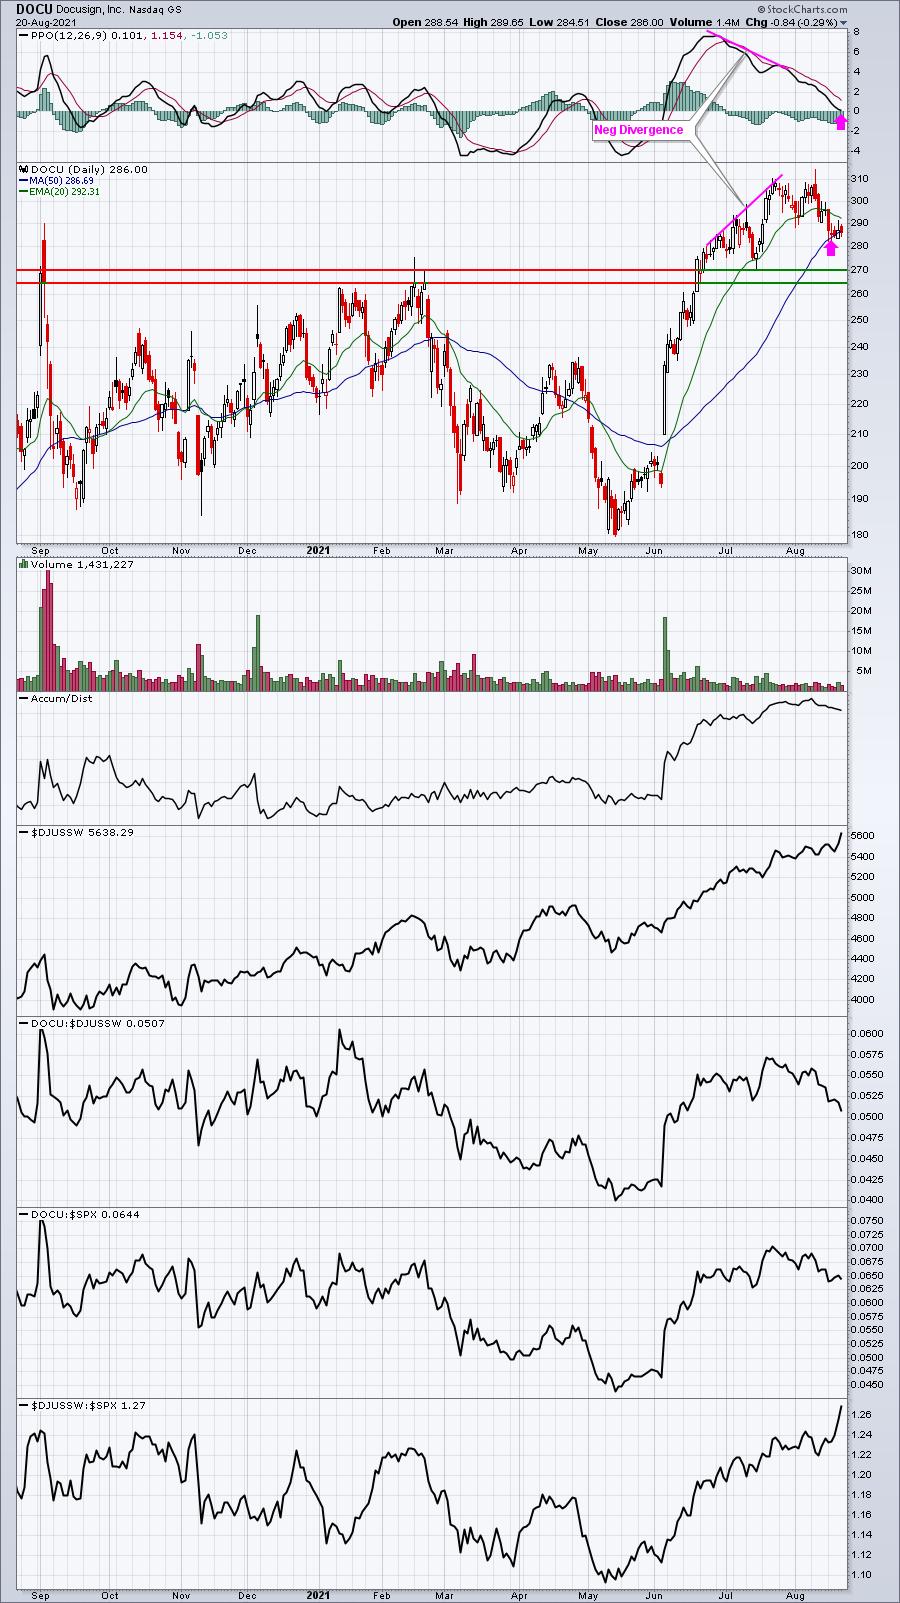
I love that AD line hanging around near its high, while prices pull back to unwind the momentum issues. The pink arrows highlight the 50-day SMA and PPO centerline tests that are typically found after a negative divergence prints. It doesn't guarantee us the selling is over and I've annotated a couple price support levels to watch if we see further short-term weakness. Also worth pointing out is the failed breakout attempt on August 10th. Anyone who trades stocks frequently should watch for a false breakout, especially one that's paired with a negative divergence.
Earnings Reaction Portfolio:
The Earnings Reaction Portfolio declined 1.98% last week, lagging the S&P 500. Here are how the Earnings Reaction portfolio component stocks performed last week:
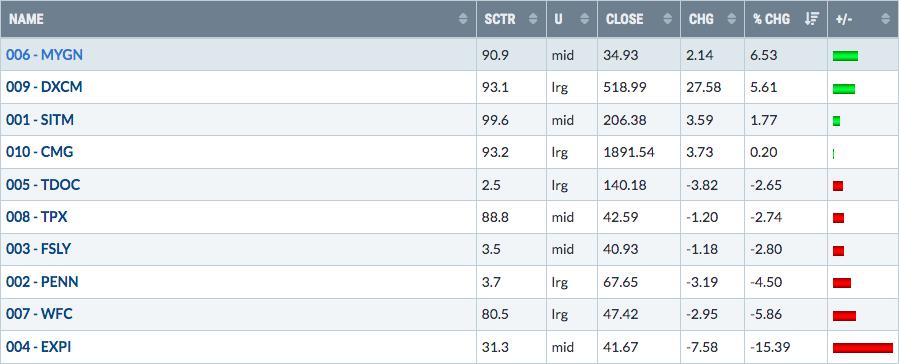
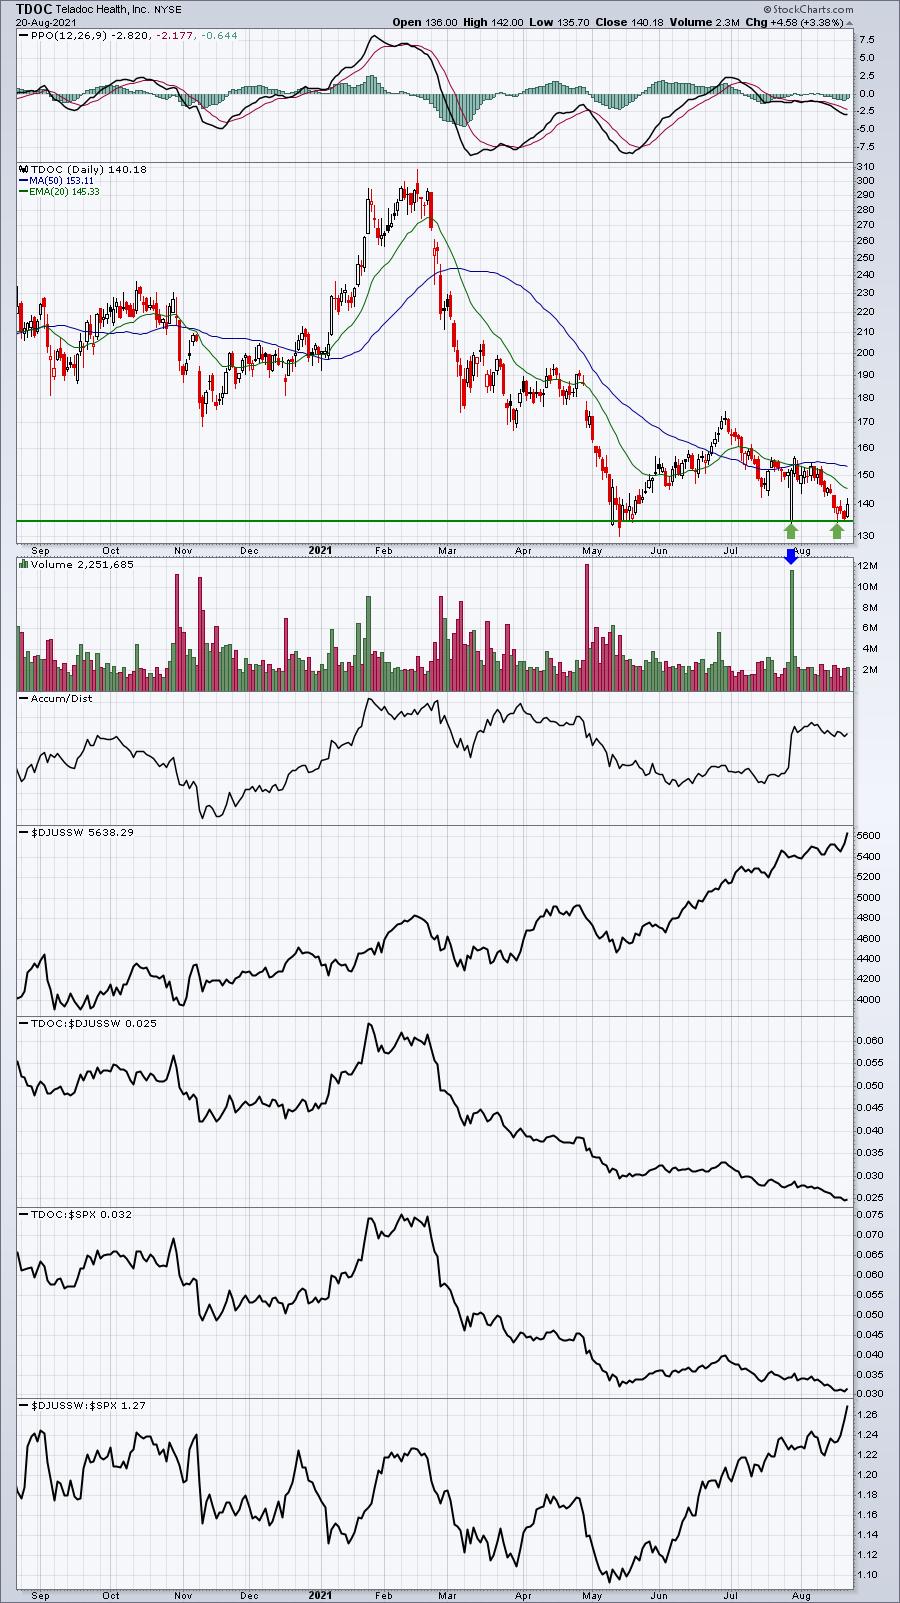
This portfolio's stocks should find key support to be the low price the day of its initial earnings reaction. These are companies that had explosive-type days on extremely heavy volume after earnings. I believe a great time to trade them would be on a retest of key gap support from that day's candle. Take a look at the next two charts, TDOC and EXPI, as examples:
TDOC:
EXPI:
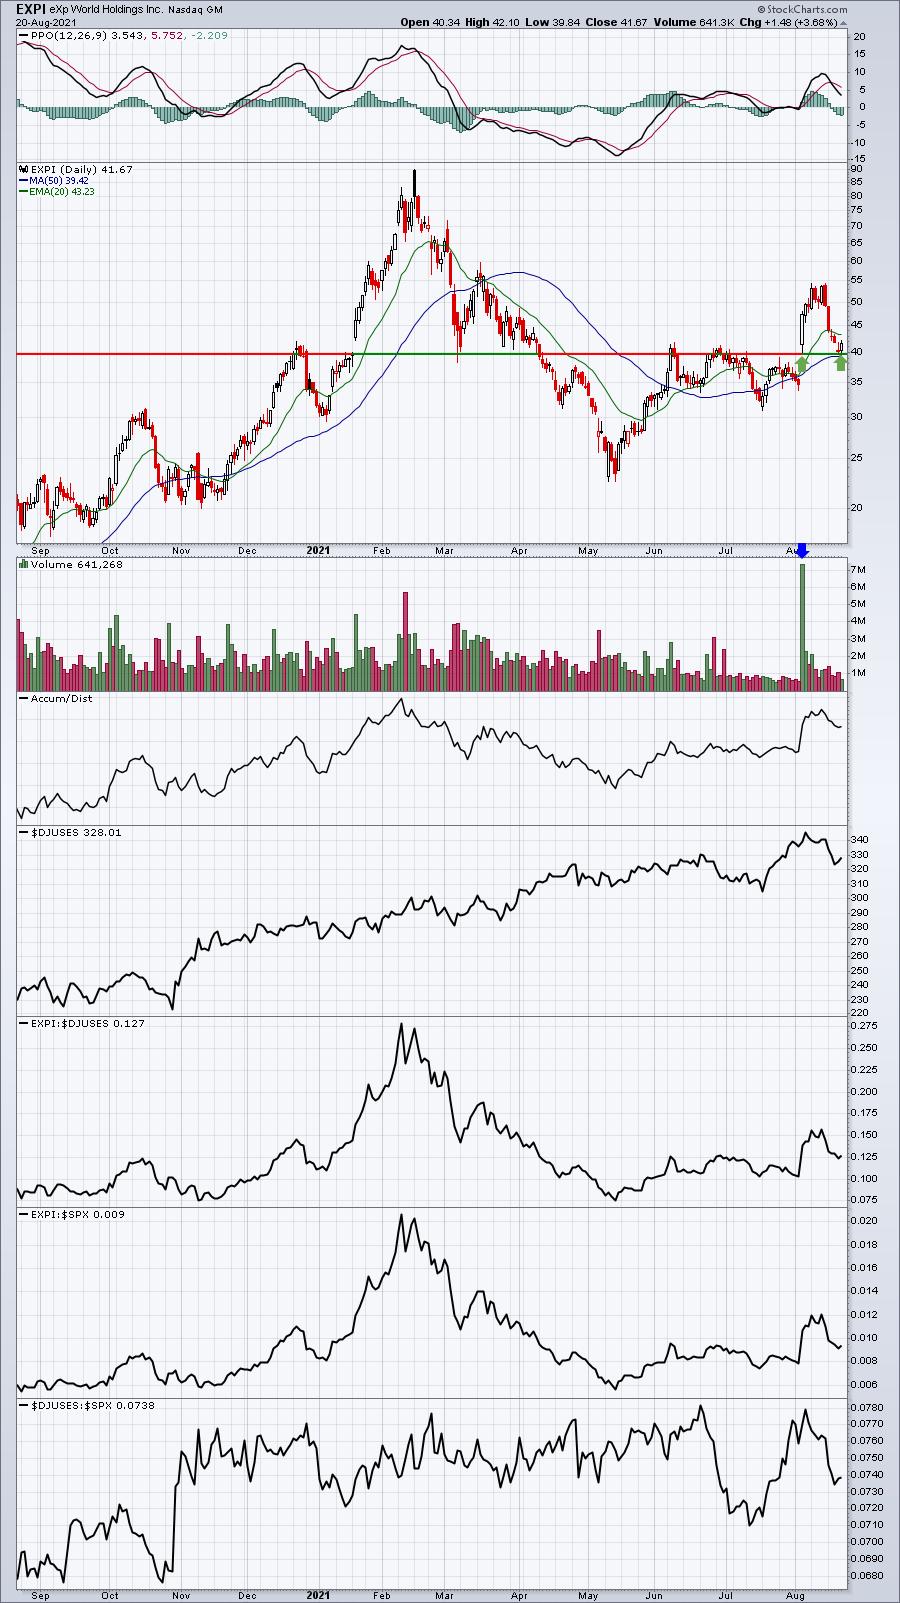
I would not consider either of these stocks to be "portfolio-quality" stocks as their overall behavior has not been great. But I do like the initial reactions to their earnings reports a lot. The support levels highlighted above represent the levels where buyers bid the shares higher. If this support doesn't hold, I'd be very careful. In other words, if you're trading these stocks, keep your stops tight. Any close below the support levels identified would trigger a sell signal, in my opinion.
Summary
As we wrapped up last quarter's portfolios, it was quite apparent that if you weren't invested in the large cap stocks that were driving the major indices higher - stocks like Apple (AAPL), Microsoft (MSFT), Alphabet (GOOGL), Facebook (FB), and Tesla (TSLA) - then you were likely to outperform. Unfortunately, we only owned GOOGL. As strength in the market deteriorated beneath those largest of large cap stocks, our portfolios struggled. Our Strong AD Portfolio was hit hardest as it lost 10% of its value in just the final 3 weeks of the quarter. It limped across the finish line.
Our Aggressive Portfolio, which was leading the S&P 500 right up until the final week, lost more than 4% in the final 5 days of the quarter (not including Friday's performance which began the next quarter). The quarter couldn't end fast enough for us.
But I like to look forward and last quarter is now in our rear view mirror. Our portfolios have a bit more of a growth flavor this quarter, which is our forte. The U.S. Dollar Index ($USD) broke to a new 2021 high on Thursday, which eliminates any thirst for energy (XLE) and materials (XLB) stocks. If the dollar fails to hold its breakout and weakens, then we'll regret not owning these two areas. But I base our decisions on the technical indicators at hand and the rising dollar tells me to leave the XLE and XLB alone as they'll likely underperform. The anticipated return to growth stocks also kept me from supporting defensive stocks. That could prove to be a poor short-term decision as September can benefit defensive plays, especially utilities (XLU). The XLU's two best consecutive calendar months during the current secular bull market have been September and October. For that reason, I did select one utility stock - American Water Works (AWK).
Model ETF Portfolio
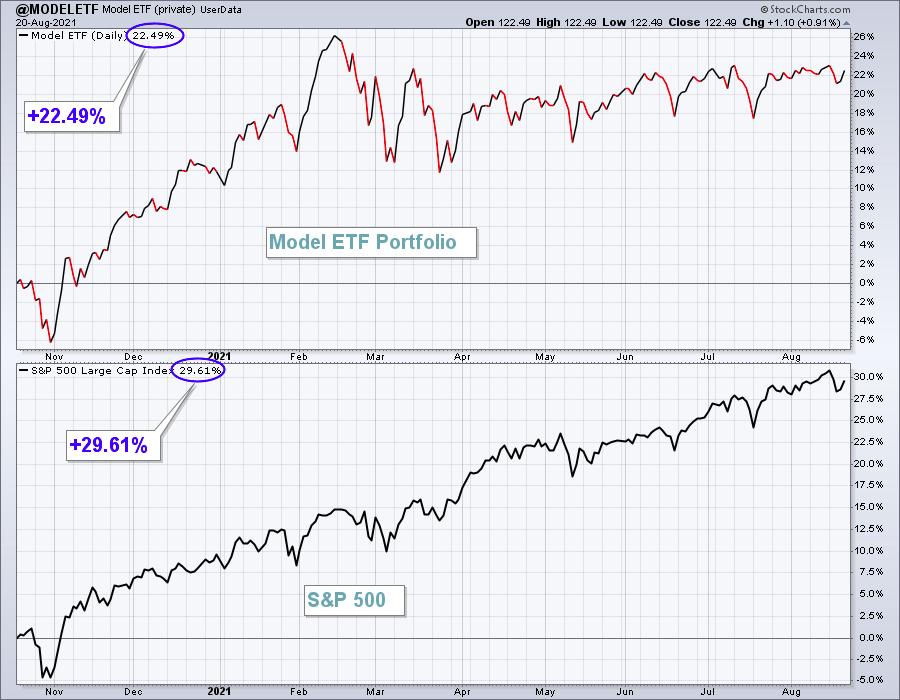
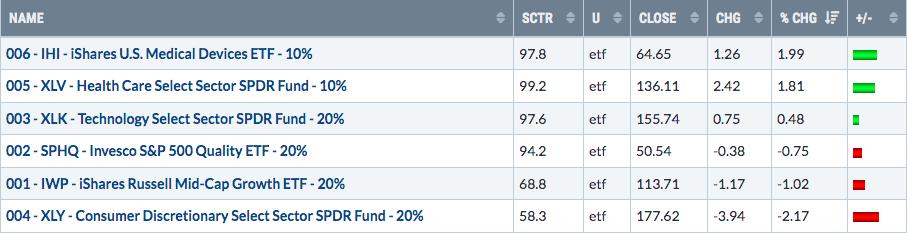
Our Model ETF Portfolio lost 0.30% last week, which was about half the S&P 500's 0.59% drop.
Here's the updated inception-to-date chart of the Model ETF Portfolio:
Here are how the Model ETF Portfolio component ETFs performed last week:
Happy trading!
Tom Bowley, Chief Market Strategist
EarningsBeats.com
"Better timing. Better trades."