
EB Weekly Portfolio Report - Saturday, September 11, 2021
Upcoming Earnings Reports
According to Zacks.com, the following companies will be reporting earnings this week and each is a component of one of our portfolios:
Monday, September 13: None
Tuesday, September 14: None
Wednesday, September 15: None
Thursday, September 16: None
Friday, September 17: None
PLEASE NOTE: The above companies were provided after scanning the Zacks Earnings Calendar. My research is limited to what Zacks provides and I also can make a mistake from time to time, so please check for earnings dates for all companies that you own. We do hold our portfolio stocks through one earnings report, but every EarningsBeats.com member must make his/her own investing/trading decisions about holding stocks into earnings reports as it's the most volatile (risky) time to own a stock.
Portfolio Rules and Objectives
Here are the common traits and objectives of our portfolios:
- There are 10 leading stocks from up to 10 leading industries in each portfolio (at the time of selection). Generally, there will only be one stock per industry group, but there could be exceptions.
- They are held for an entire 90-day period, with no stops in place. We strive for consistency, transparency, and simplicity in our portfolios. EB.com members may hold these stocks for the entire 90 days, trade them, use stops, etc., but for purposes of our calculation, we will make no exceptions to our "buy and hold for three months" strategy.
- Every stock will generally be held through ONE earnings report
- The expectation is that relative winners will carry the portfolio to outperformance
- They were all entered into as of the close on Thursday, August 19th; members may choose to try to time better entries, but EB.com "purchased" as of August 19th's closing price
- Primary objective is to outperform the benchmark S&P 500
Here are several considerations for EB members:
- I would expect the Strong AD and Aggressive portfolios to be the riskiest, followed by the Model portfolio, and then the Income portfolio
- The Strong AD portfolio will be selected from a combination of rising accumulation/distribution lines and SCTRs above 70 at the time of selection. It is the only portfolio that does NOT require a revenue and EPS beat in its most recent quarterly earnings report
- The Income portfolio stocks will all pay dividends, with the expected average dividend yield to be at least 1.0%
- Drawdowns (losses) should be much milder on the Income portfolio, with more volatility expected on the other three; please review inception-to-date charts below to gain an idea of the volatility associated with each
- I believe the larger drawdown on the Income portfolio at the beginning of the pandemic was an anomaly, occurring as many defensive, higher-yielding companies uncharacteristically underperformed during a market decline.
- Large drawdowns in the February through May period were due to the rapid rotation from growth stocks to value stocks; each quarter, our portfolios are based on themes and there is never a guarantee that our analysis and beliefs will be proven correct
- You should consider owning or trading these stocks in whatever manner is most comfortable for you; while we will buy all 10 stocks in the manner identified above, feel free to trade certain stocks or wait for pullbacks if the stocks are overbought
- We have no idea what risk each member is willing or able to take. We are not registered investment advisors so be sure you understand the risk you take. Please consult your financial advisor.
- EarningsBeats.com shareholders/employees may own all or some of the portfolio stocks from time to time.
Weekly Snapshot
Here's a weekly recap:
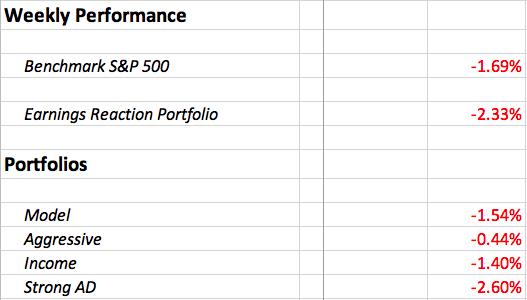
Overall, the portfolios did fairly well on a relative basis, though all of them were down for the week.
Weekly Summary
Benchmark S&P 500:
Inflation at the producer level came in a bit hotter than expected on Friday morning and that may have triggered some of the Friday selling. Interestingly, however, we saw an initial market reaction that favored growth stocks over value stocks. Unless that relationship changes in a major way, I'd continue to ignore all the media hype about inflation. Let's keep focusing on the charts, which price in everything. Here's a 2-month hourly chart of the DJUSGS:DJUSVS ratio, so you can see the recent favoritism towards growth stocks:
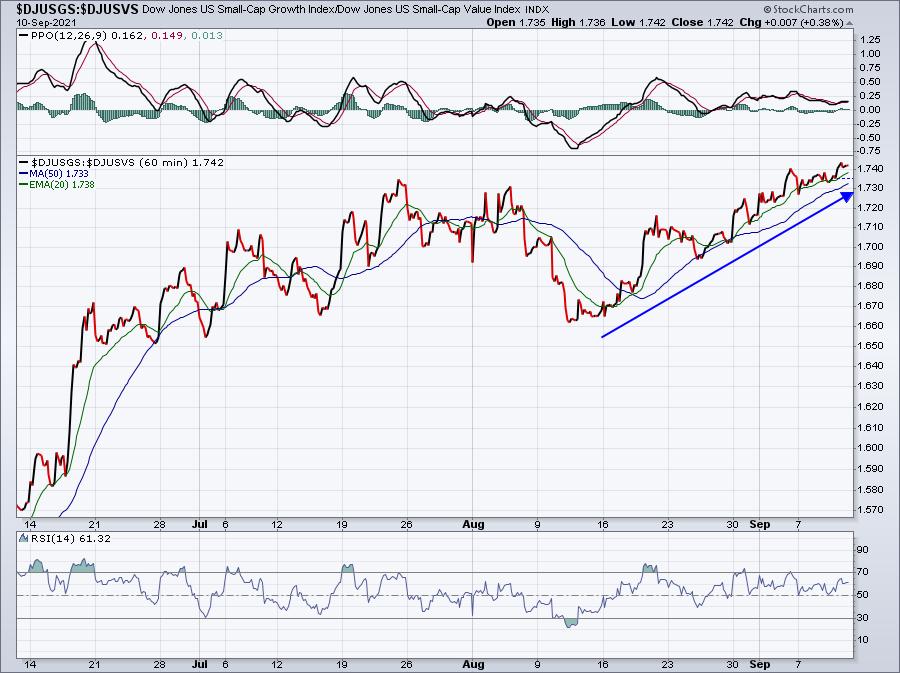
If inflation was truly a problem for Wall Street, growth stocks would be the LAST place you'd want to invest. So I let my charts do the talking, not the media. Seriously, the media knows NOTHING. I'm not being mean, it's just that they're simply looking for clicks. Their primary goal is to produce revenue, not to educate.
Model Portfolio:
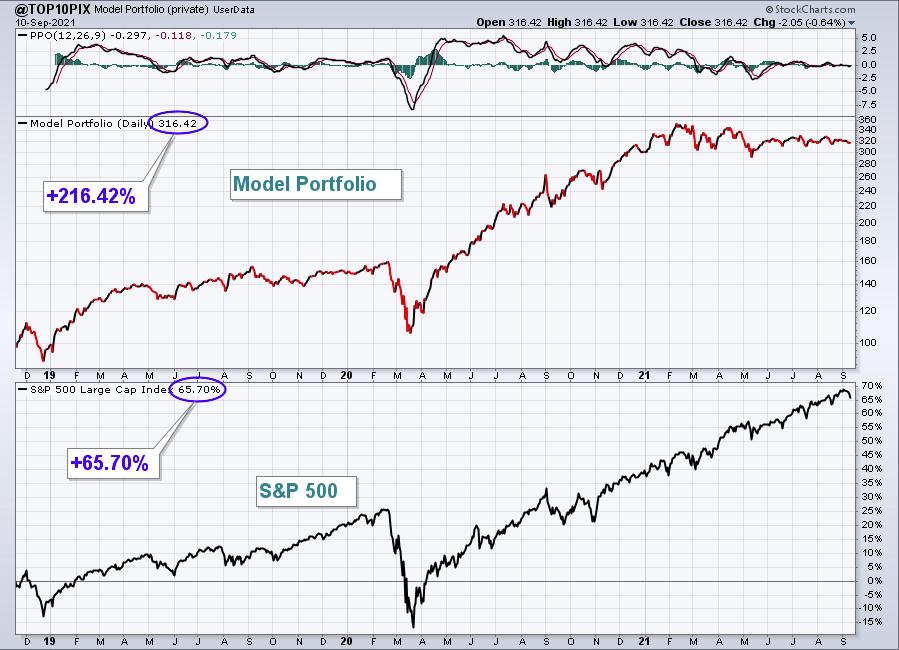
The Model Portfolio dropped 1.54%, slightly outperforming the S&P 500 last week. Here's the updated inception-to-date chart of the portfolio:
Here are how the Model portfolio component stocks performed last week:
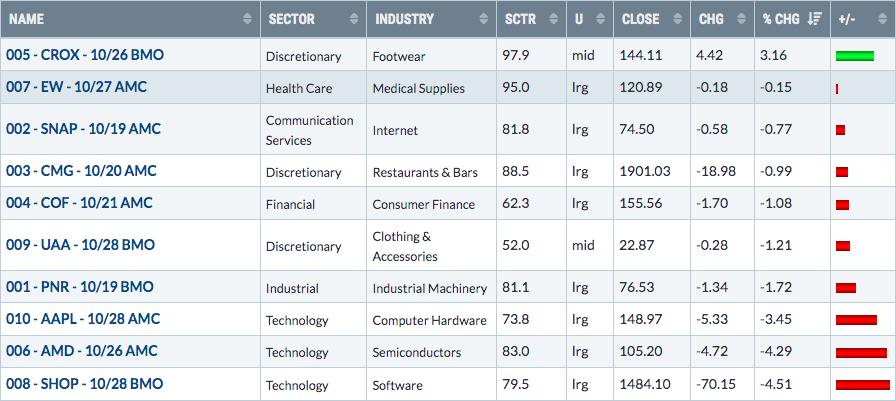
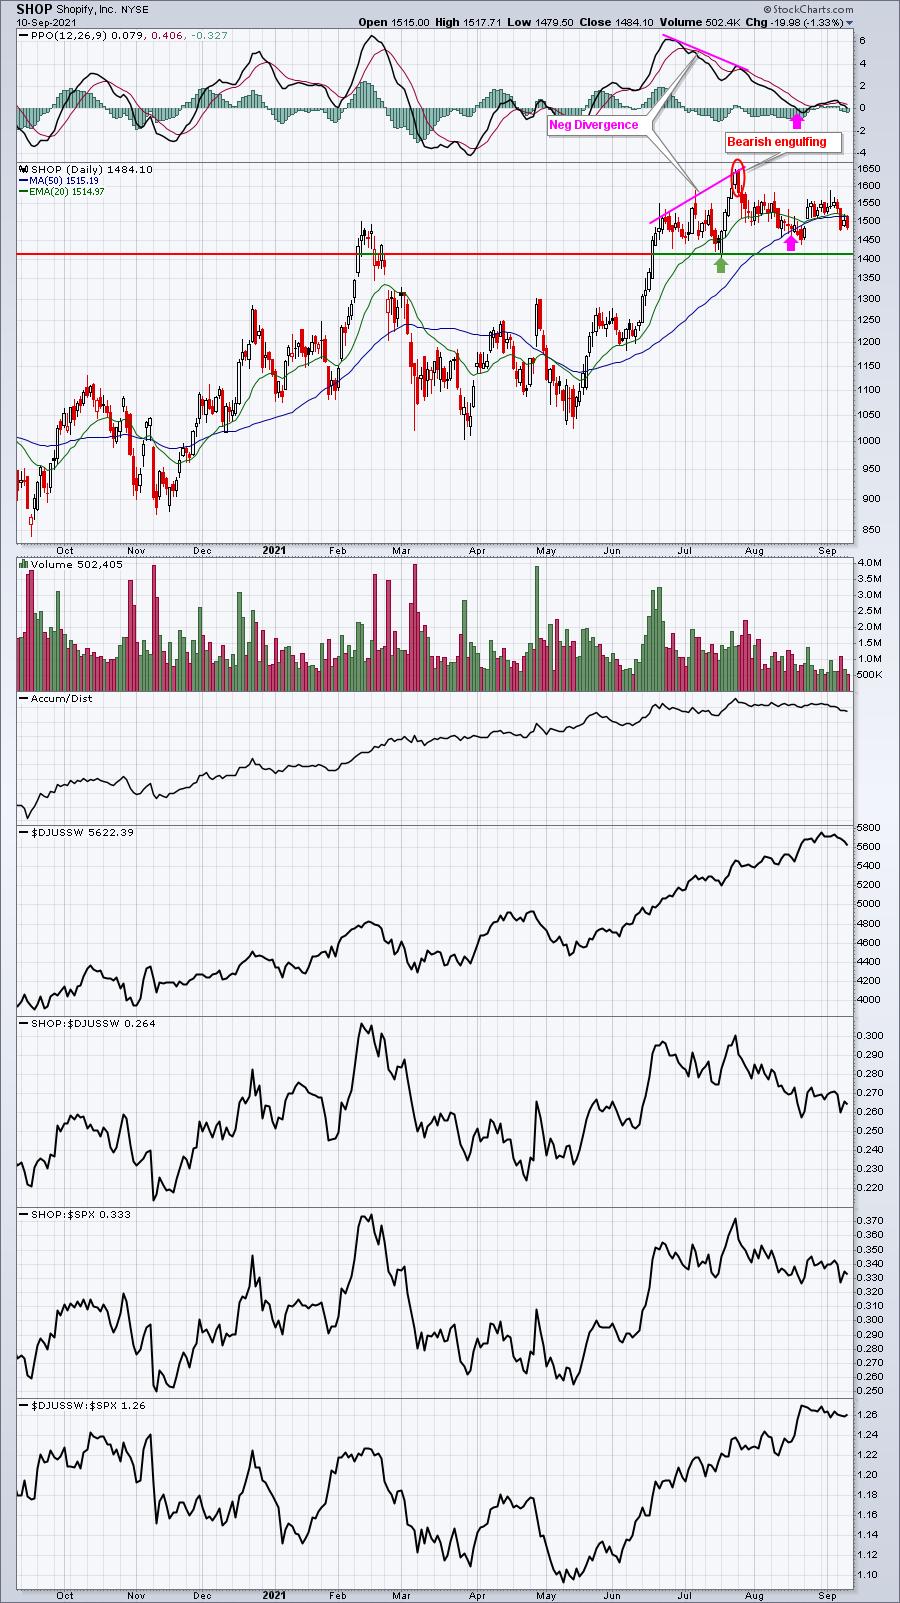
SHOP was last week's worst performer in the Model Portfolio, but it looks fine on its daily chart. We had a negative divergence in play and SHOP did what many stocks do after such a signal of slowing momentum - it tested its 50-day SMA and also returned to its PPO centerline for a "reset". The stock continues to consolidate, but I won't be at all surprised if another pre-earnings surge lifts SHOP as we move into October:
Aggressive Portfolio:
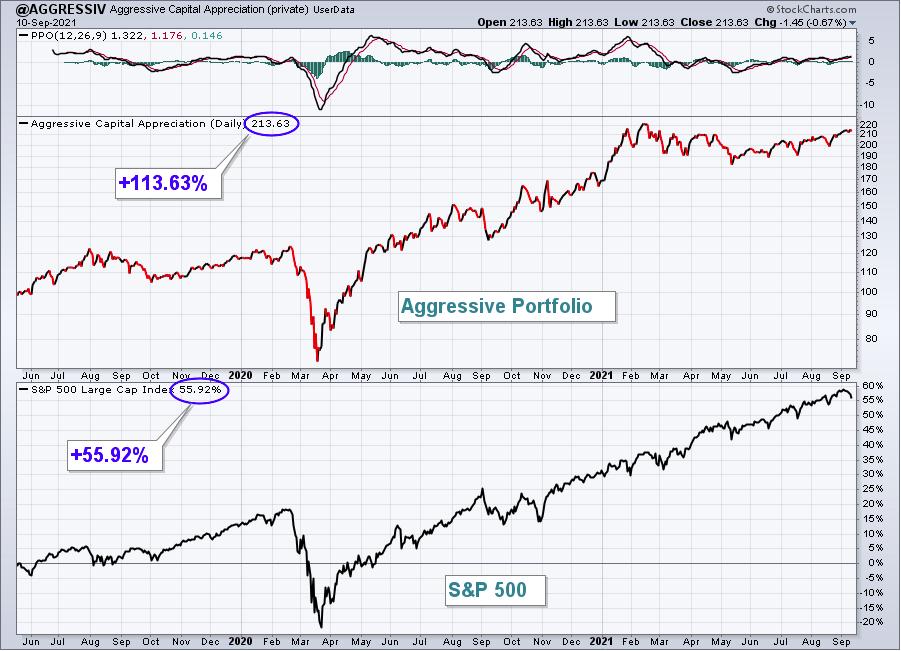
The Aggressive Portfolio fell 0.44%, beating the S&P 500 last week. Here's the updated inception-to-date chart of the portfolio:
Here are how the Aggressive portfolio component stocks performed last week:
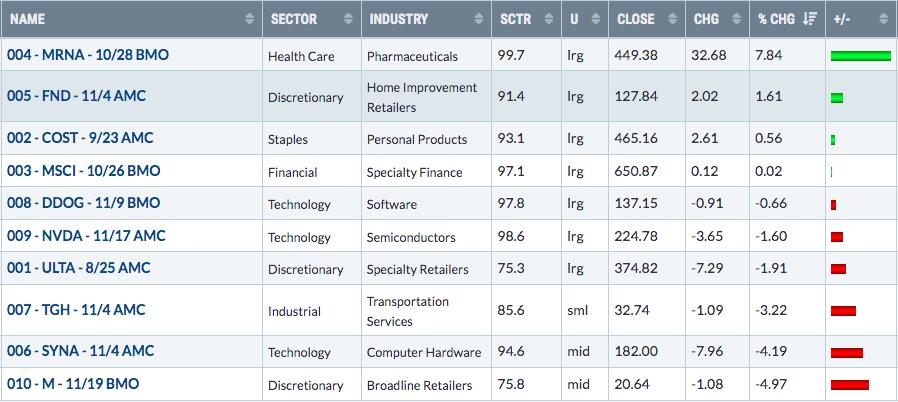
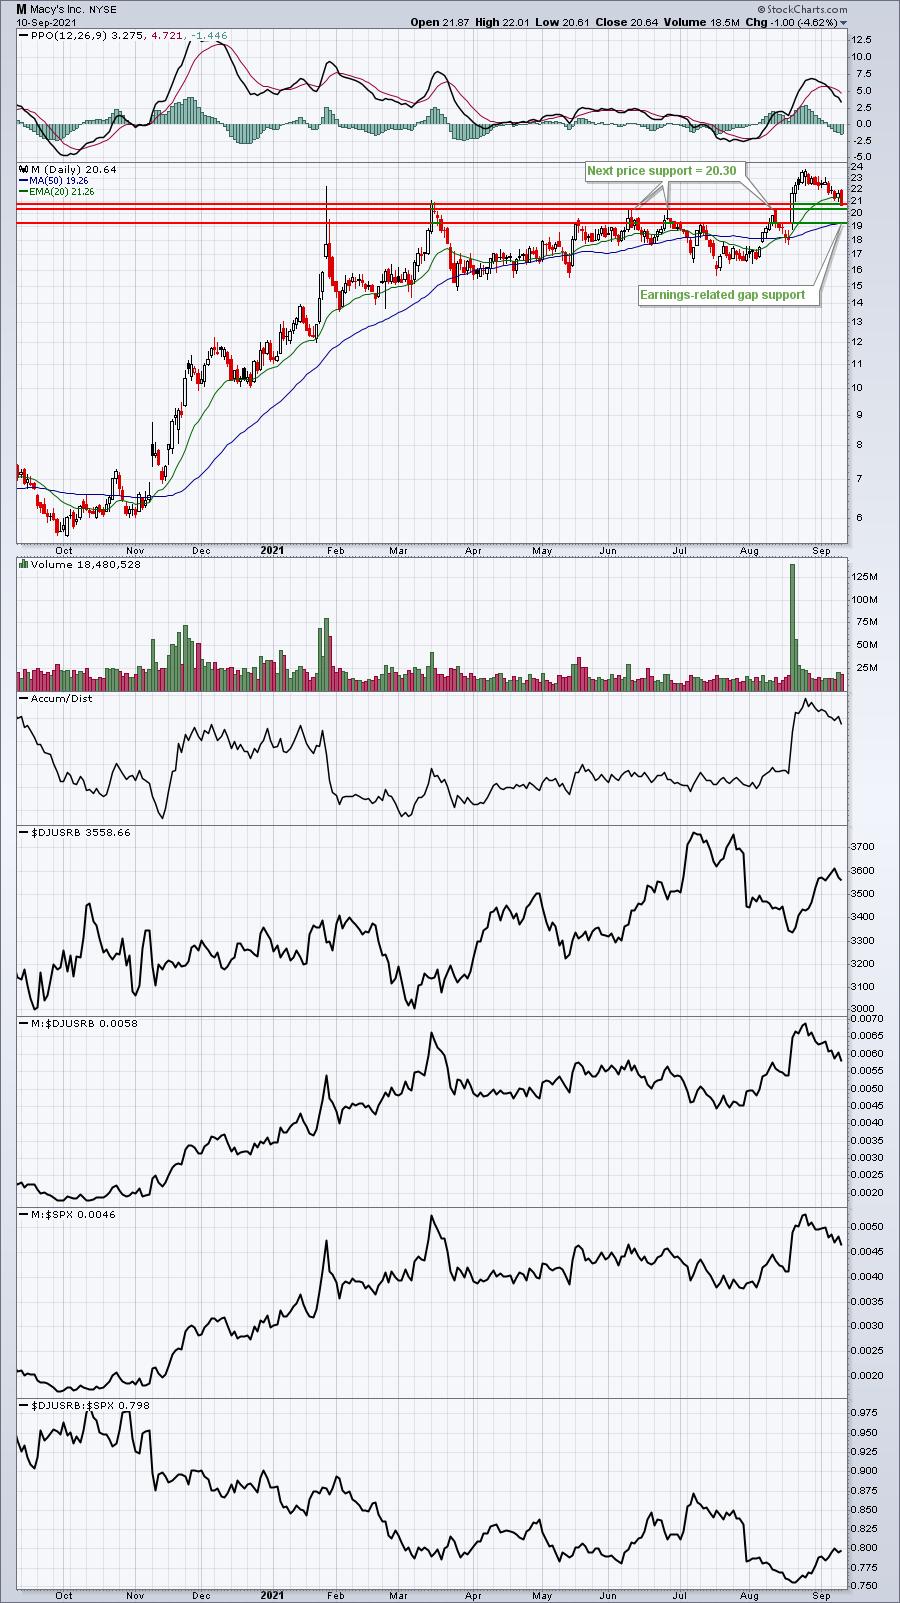
For the second straight week, M trailed all other Aggressive Portfolio stocks. Last week, I didn't see any technical issues. This week is different, however, as M's breakout above 20.76 did not hold as support on Friday as M closed at 20.64. 20.30 should provide some price support, while the biggest support on the chart, in my opinion, is gap support from earnings at 19.24:
Income Portfolio:
The Income Portfolio dropped 1.40%, but managed to outpace the S&P 500. Here's the updated inception-to-date chart of the portfolio:
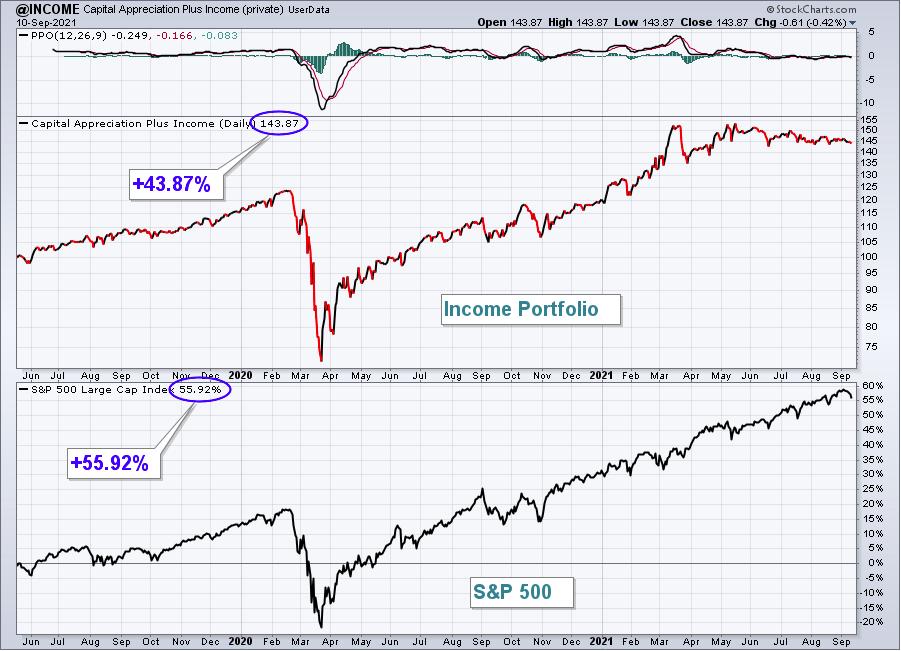
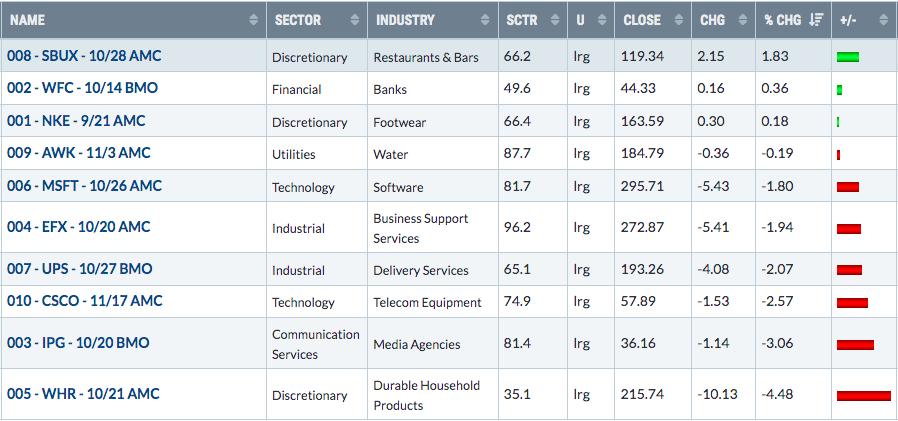
Here are how the Income portfolio component stocks performed last week:
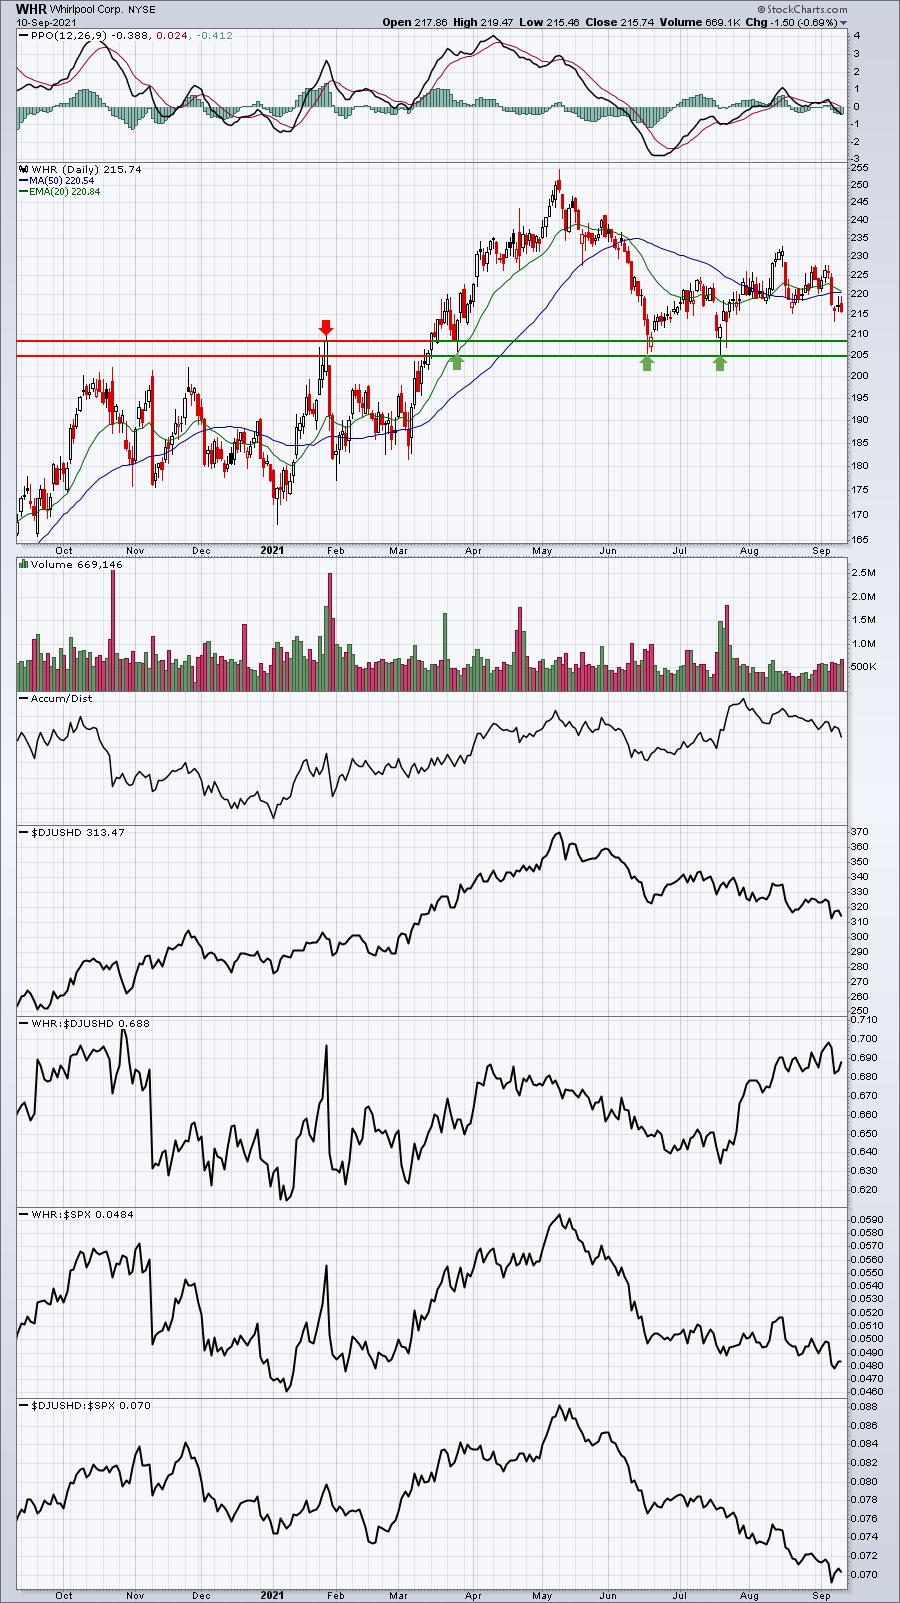
WHR had a rough week, but I'd view the primary price support level to be the 205-207 area:
Strong AD Portfolio:
The Strong AD Portfolio lost 2.60%, failing to keep up with the S&P 500 for the week. Here's the updated inception-to-date chart of the portfolio:
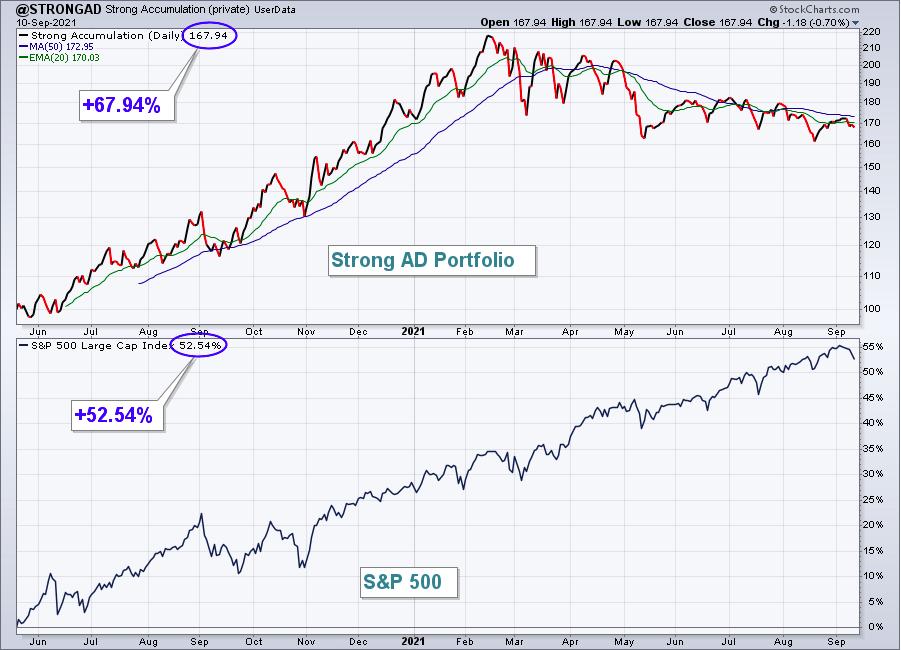
Here are how the Strong AD portfolio component stocks performed last week:
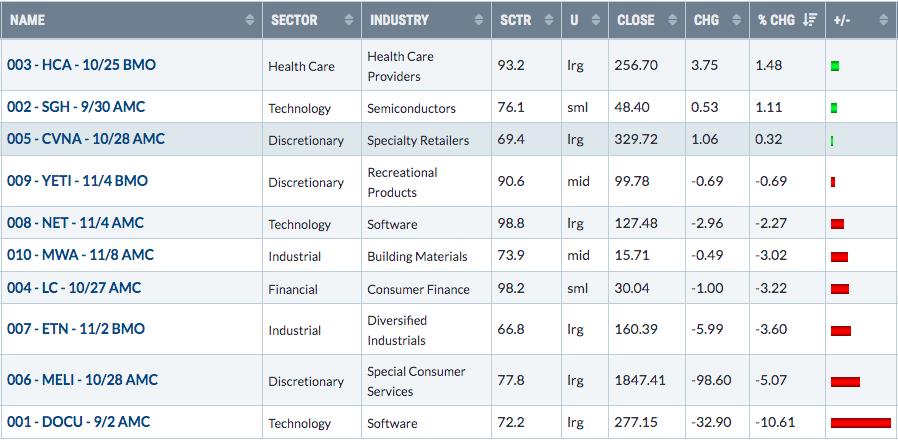
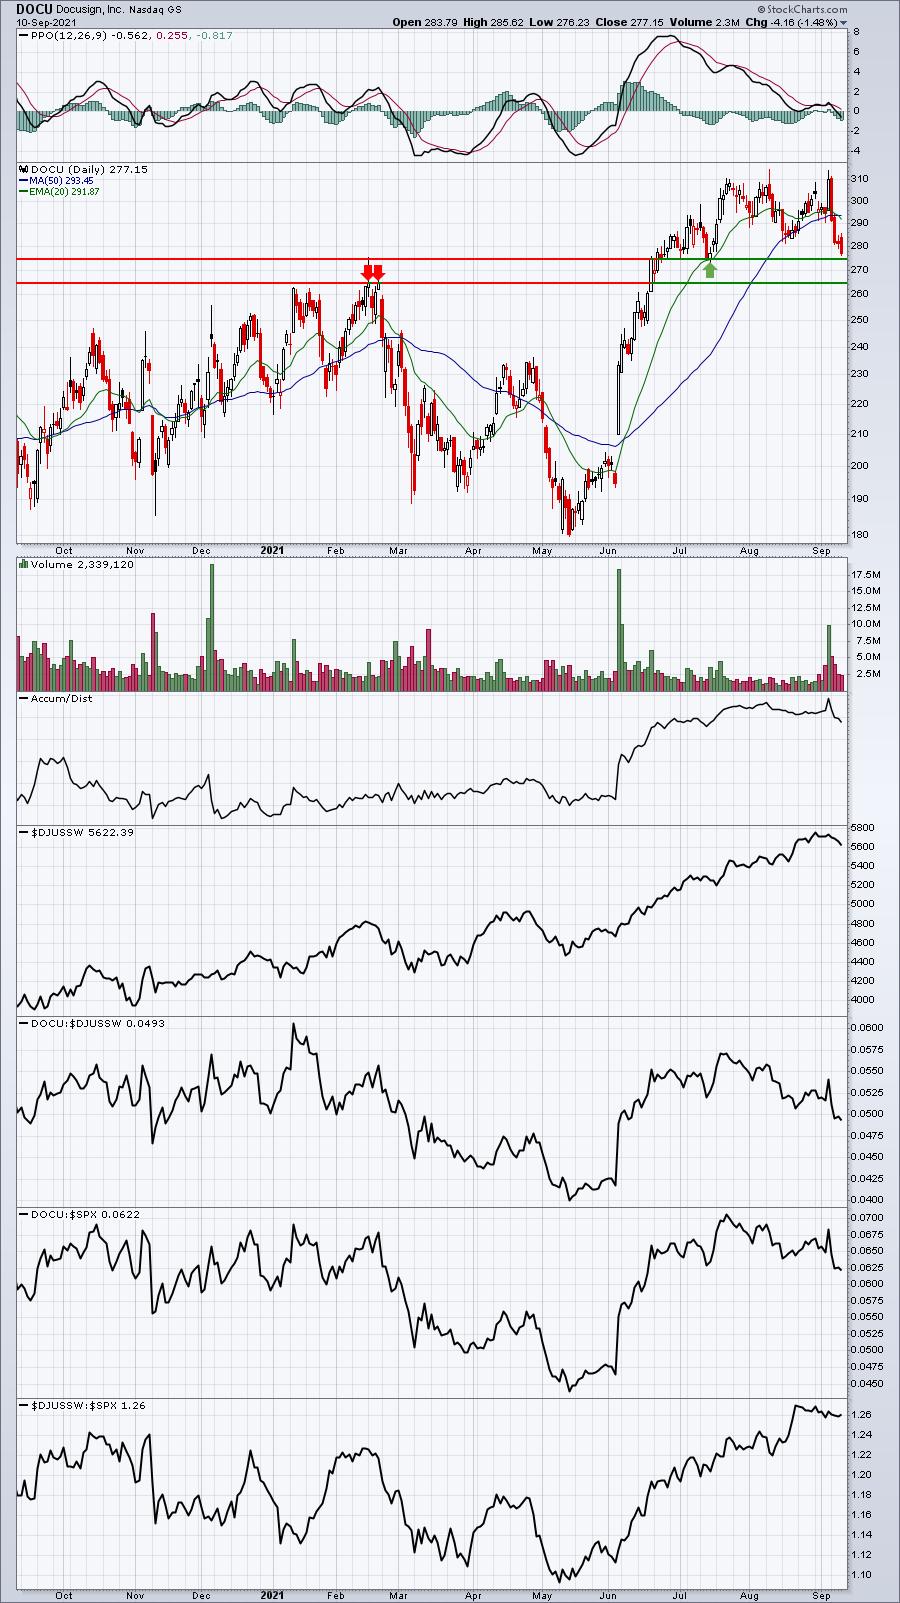
I was really surprised to see the action in DOCU this past week. I realize it barely cleared prior resistance the prior week, but I looked for further strength last week and we saw exactly the opposite - a ton of selling. I remain bullish the stock, but I want to see a bottom established. Look for a reversal somewhere in the 265-275 range:
Earnings Reaction Portfolio:
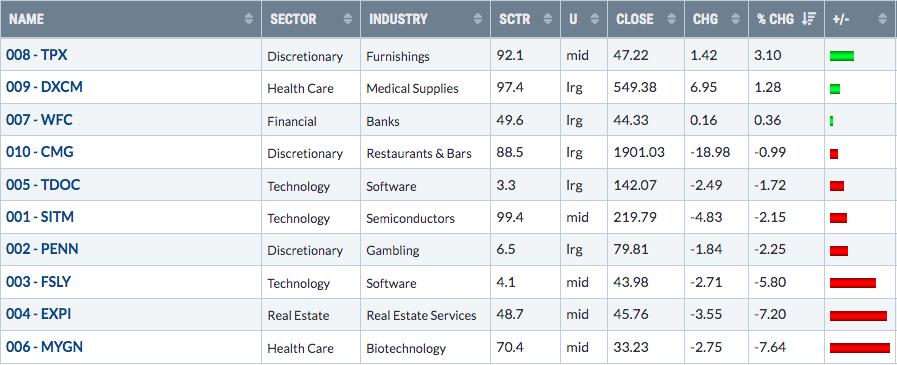
The Earnings Reaction Portfolio tumbled 2.33% last week, losing ground to the S&P 500. Here are how the Earnings Reaction portfolio component stocks performed last week:
Summary
The next two weeks will be interesting no doubt. The combination of options expiration next week and the historically-weak second half of September could certainly lead to a further selloff, or perhaps a lengthier consolidation period. Rather than to get into more specifics again here, I'd simply encourage you to read my ChartWatchers article that I published yesterday, "What You Need To Know About September Weakness".
Model ETF Portfolio
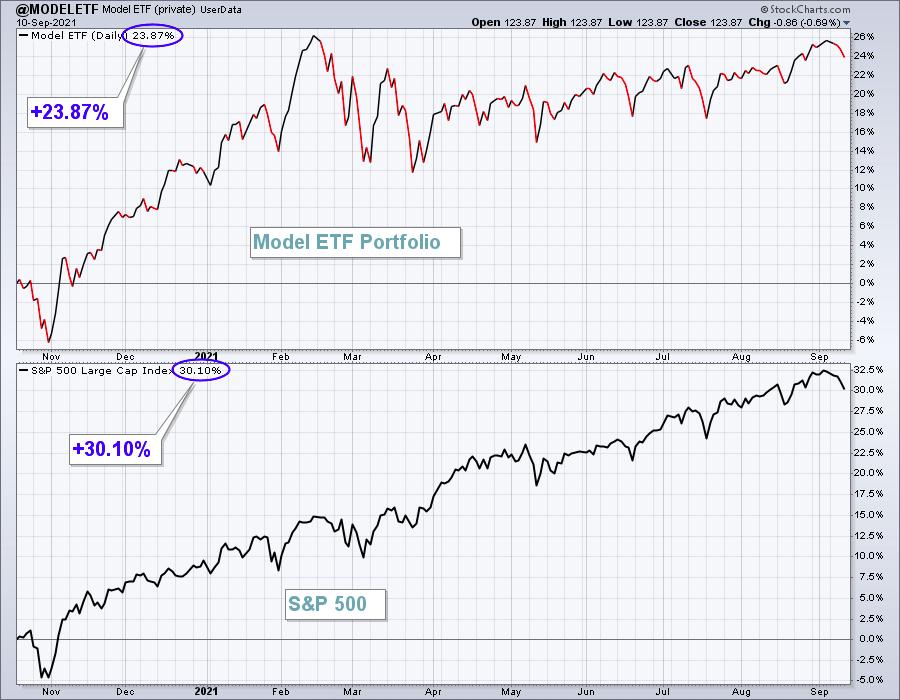
Our Model ETF Portfolio dropped 1.46% last week, but did outperform the S&P 500.
Here's the updated inception-to-date chart of the Model ETF Portfolio:
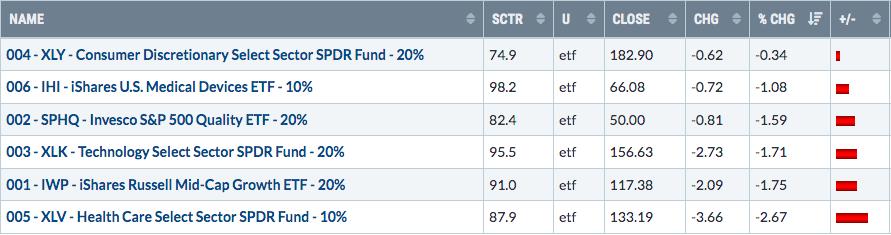
Here are how the Model ETF Portfolio component ETFs performed last week:
Happy trading!
Tom Bowley, Chief Market Strategist
EarningsBeats.com
"Better timing. Better trades."