
EB Weekly Portfolio Report - Sunday, September 26, 2021
Upcoming Earnings Reports
According to Zacks.com, the following companies will be reporting earnings this week and each is a component of one of our portfolios:
Monday, September 27: None
Tuesday, September 28: None
Wednesday, September 29: None
Thursday, September 30: None
Friday, October 1: None
PLEASE NOTE: The above companies were provided after scanning the Zacks Earnings Calendar. My research is limited to what Zacks provides and I also can make a mistake from time to time, so please check for earnings dates for all companies that you own. We do hold our portfolio stocks through one earnings report, but every EarningsBeats.com member must make his/her own investing/trading decisions about holding stocks into earnings reports as it's the most volatile (risky) time to own a stock.
Portfolio Rules and Objectives
Here are the common traits and objectives of our portfolios:
- There are 10 leading stocks from up to 10 leading industries in each portfolio (at the time of selection). Generally, there will only be one stock per industry group, but there could be exceptions.
- They are held for an entire 90-day period, with no stops in place. We strive for consistency, transparency, and simplicity in our portfolios. EB.com members may hold these stocks for the entire 90 days, trade them, use stops, etc., but for purposes of our calculation, we will make no exceptions to our "buy and hold for three months" strategy.
- Every stock will generally be held through ONE earnings report
- The expectation is that relative winners will carry the portfolio to outperformance
- They were all entered into as of the close on Thursday, August 19th; members may choose to try to time better entries, but EB.com "purchased" as of August 19th's closing price
- Primary objective is to outperform the benchmark S&P 500
Here are several considerations for EB members:
- I would expect the Strong AD and Aggressive portfolios to be the riskiest, followed by the Model portfolio, and then the Income portfolio
- The Strong AD portfolio will be selected from a combination of rising accumulation/distribution lines and SCTRs above 70 at the time of selection. It is the only portfolio that does NOT require a revenue and EPS beat in its most recent quarterly earnings report
- The Income portfolio stocks will all pay dividends, with the expected average dividend yield to be at least 1.0%
- Drawdowns (losses) should be much milder on the Income portfolio, with more volatility expected on the other three; please review inception-to-date charts below to gain an idea of the volatility associated with each
- I believe the larger drawdown on the Income portfolio at the beginning of the pandemic was an anomaly, occurring as many defensive, higher-yielding companies uncharacteristically underperformed during a market decline.
- Large drawdowns in the February through May period were due to the rapid rotation from growth stocks to value stocks; each quarter, our portfolios are based on themes and there is never a guarantee that our analysis and beliefs will be proven correct
- You should consider owning or trading these stocks in whatever manner is most comfortable for you; while we will buy all 10 stocks in the manner identified above, feel free to trade certain stocks or wait for pullbacks if the stocks are overbought
- We have no idea what risk each member is willing or able to take. We are not registered investment advisors so be sure you understand the risk you take. Please consult your financial advisor.
- EarningsBeats.com shareholders/employees may own all or some of the portfolio stocks from time to time.
Weekly Snapshot
Here's a weekly recap:
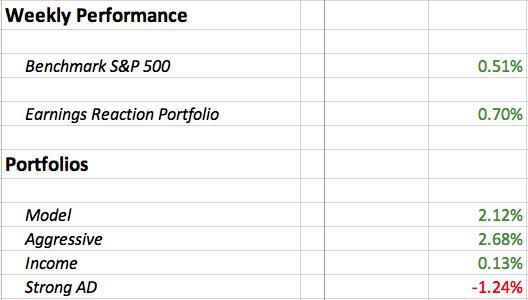
It was a solid week for our portfolios and for the market in general, especially given the historical bearish tendencies that accompany the September 20th through September 26th period. I'd say the market withstood the early selling on Monday quite well, rallying to end the week with a gain.
Weekly Summary
Benchmark S&P 500:
Well, we escaped the wrath of the latest historically-bearish period. We had to withstand the huge Monday morning drop, but after that it was another solid advance. For the week, the S&P 500 actually gained 0.51%, which didn't seem very likely given the way we started the week. Here's the current hourly outlook on the S&P 500:
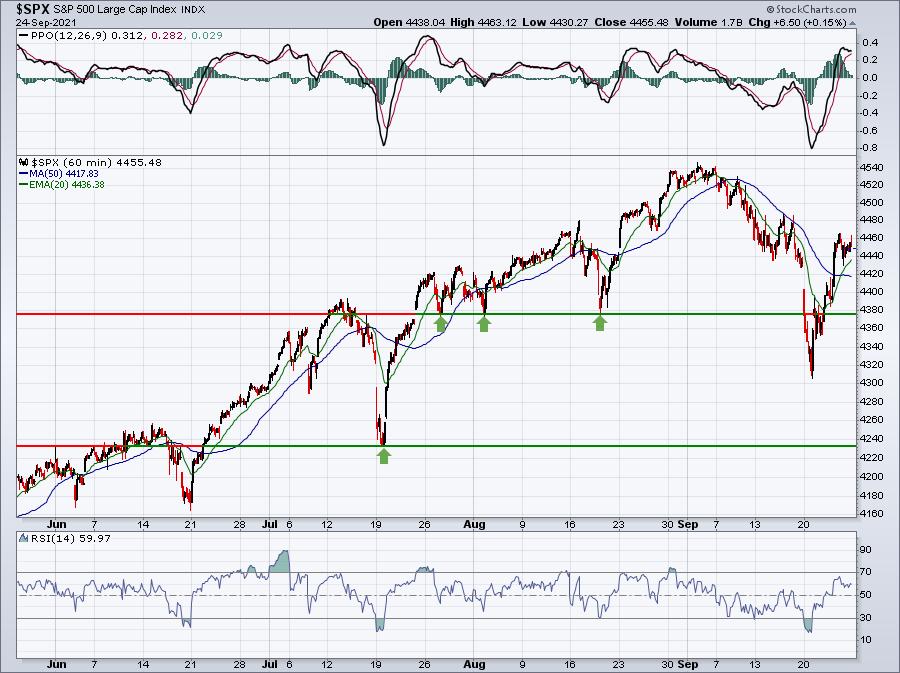
The odd part of Monday's selloff is that buyers emerged at a level that wasn't any sort of prior support - at least not on the hourly chart. The reversal occurred right in the middle of key prior lows in mid July and mid August. Short-term, look for initial support at the now-rising 20 hour EMA.
Model Portfolio:
The Model Portfolio advanced 2.12%, beating the S&P 500. Here's the updated inception-to-date chart of the portfolio:
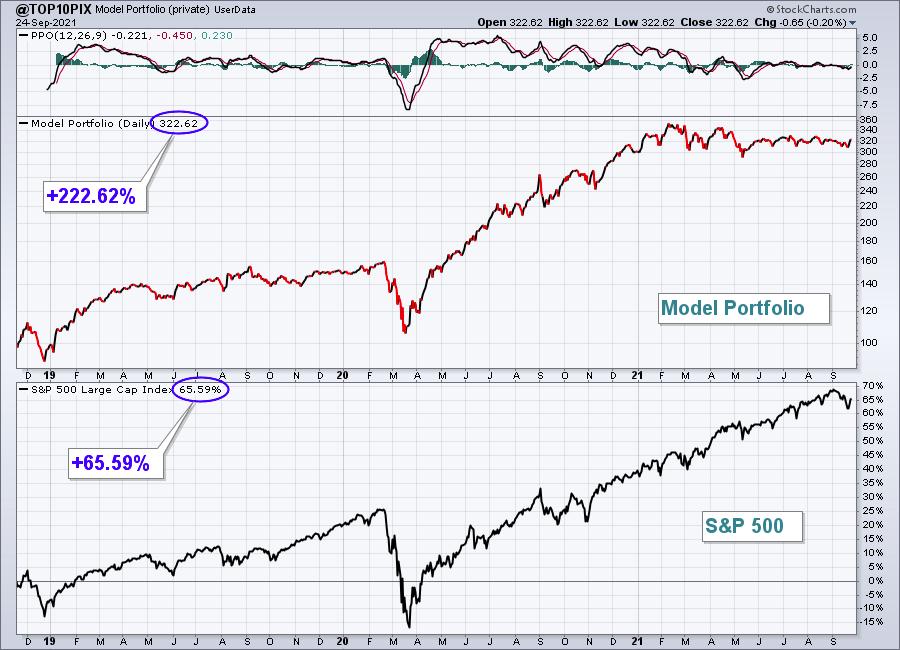
Here are how the Model portfolio component stocks performed last week:
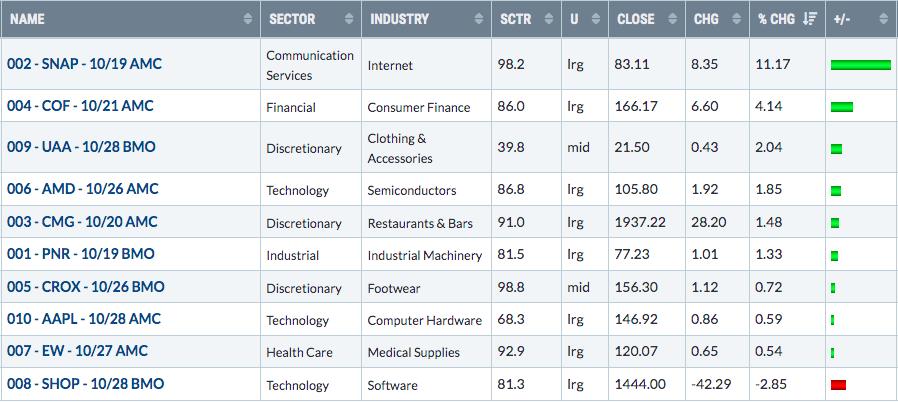
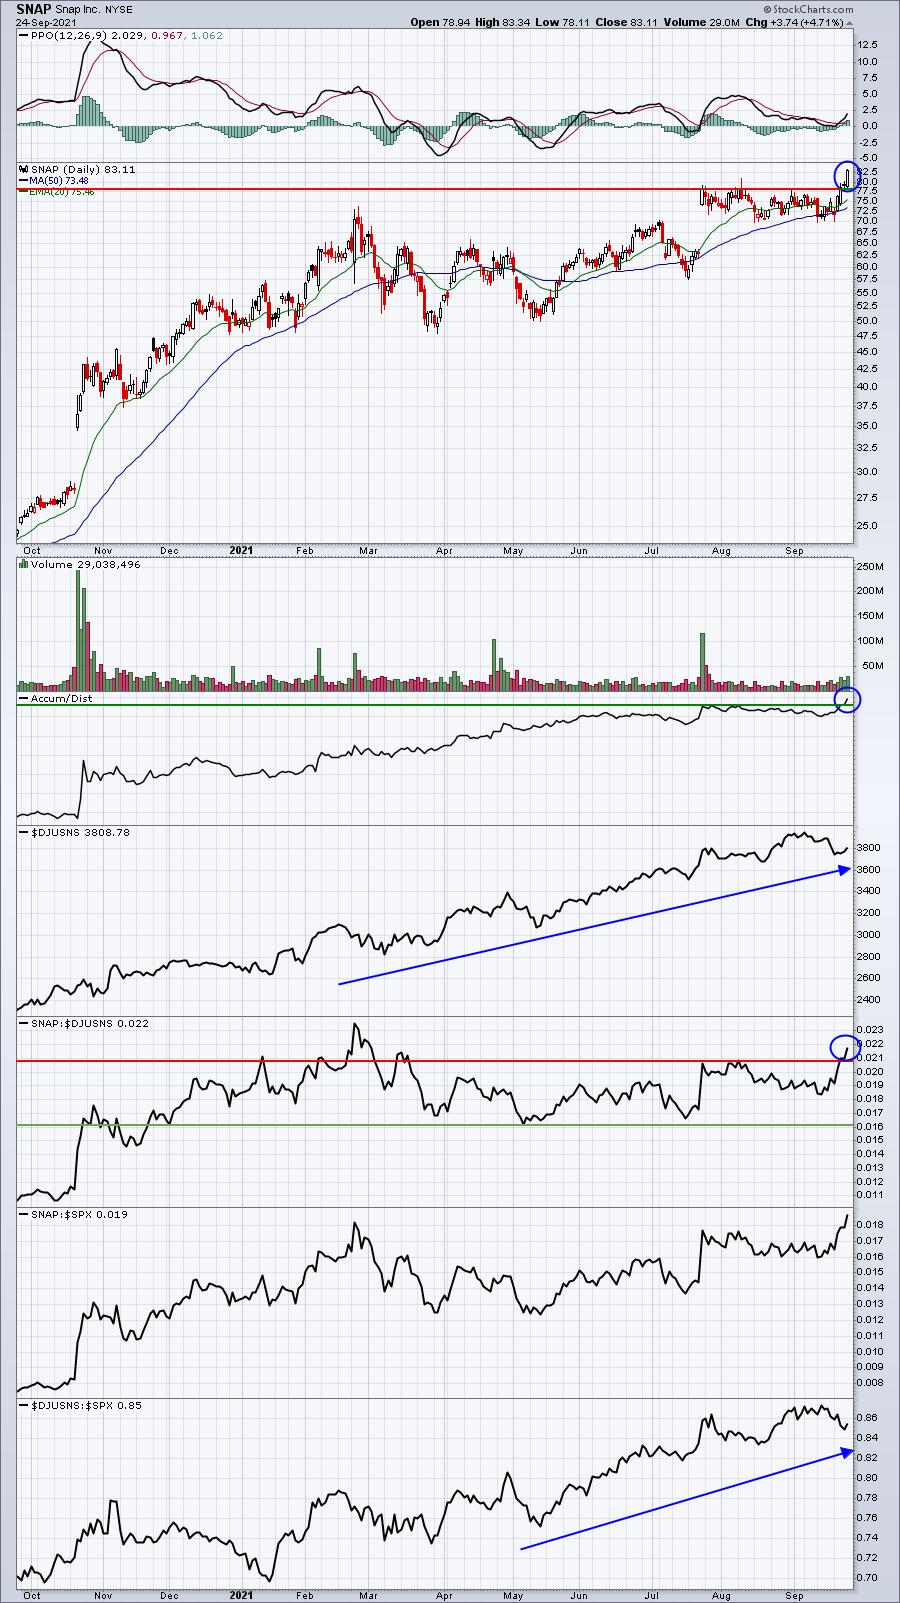
SNAP has broken out and is once again showing strong leadership, a very bullish development for the stock:
Aggressive Portfolio:
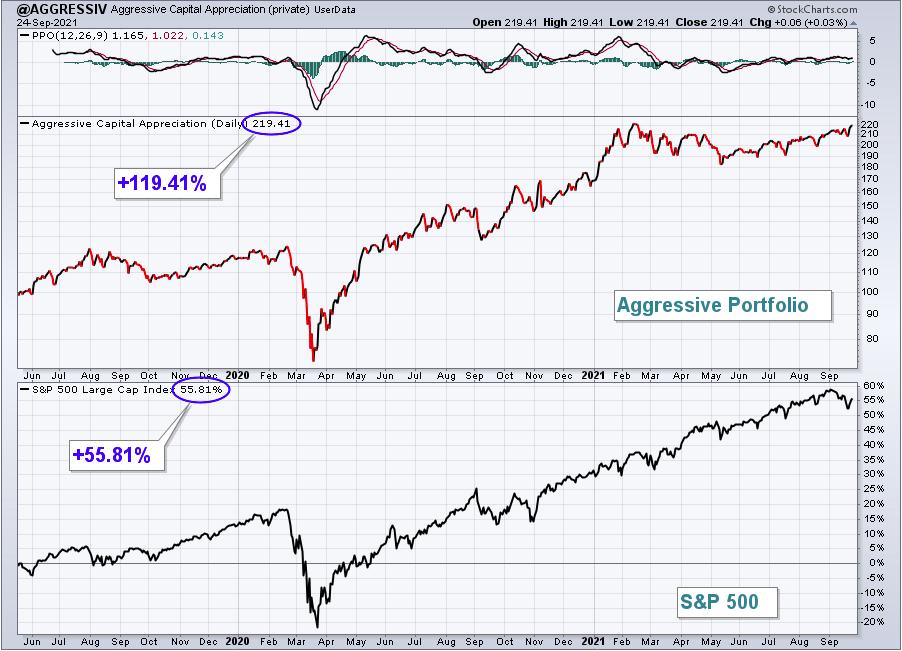
The Aggressive Portfolio climbed 2.68% last week, easily clearing the S&P 500's gain. Here's the updated inception-to-date chart of the portfolio:
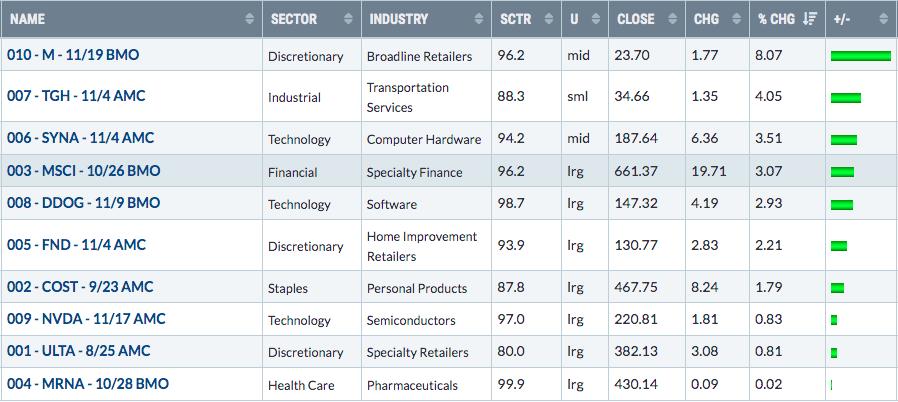
Here are how the Aggressive portfolio component stocks performed last week:
M also made a nice breakout on Friday, with increasing volume. It's also on the verge of another breakout vs. its broadline retail ($DJUSRB) peers:
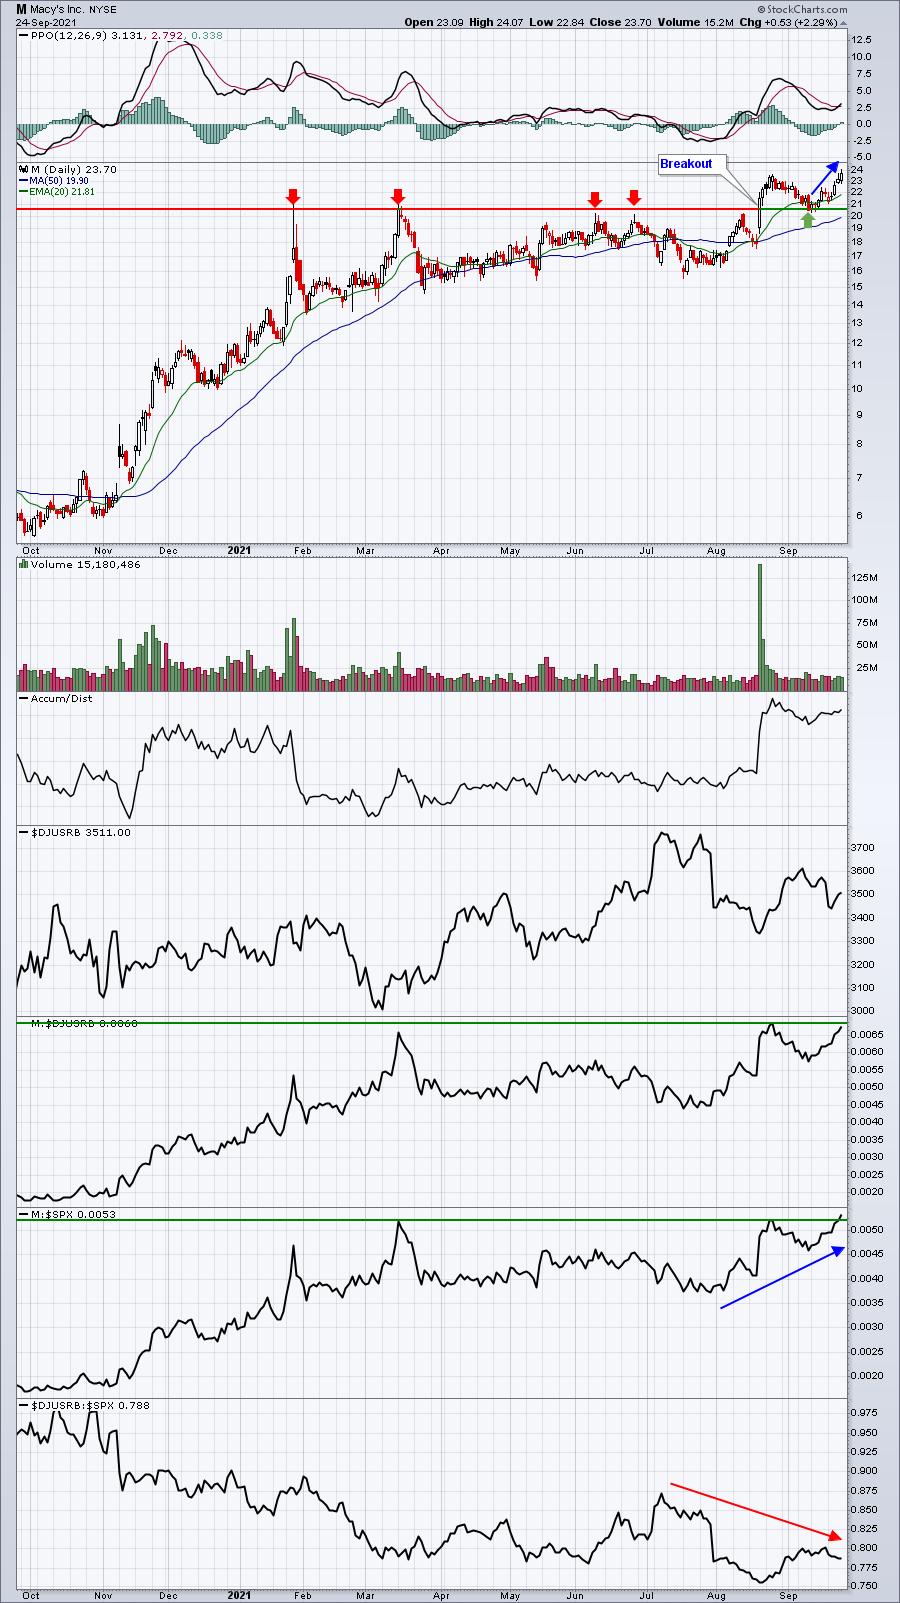
Those bottom two panels help to explain why our portfolios have outperformed, for the most part, since we introduced the concept in 2018. Broadline retail ($DJUSRB) is downtrending vs. the benchmark S&P 500. Yet M, a broadline retailer, has managed to outperform the S&P 500 because it's a leader in the space.
Income Portfolio:
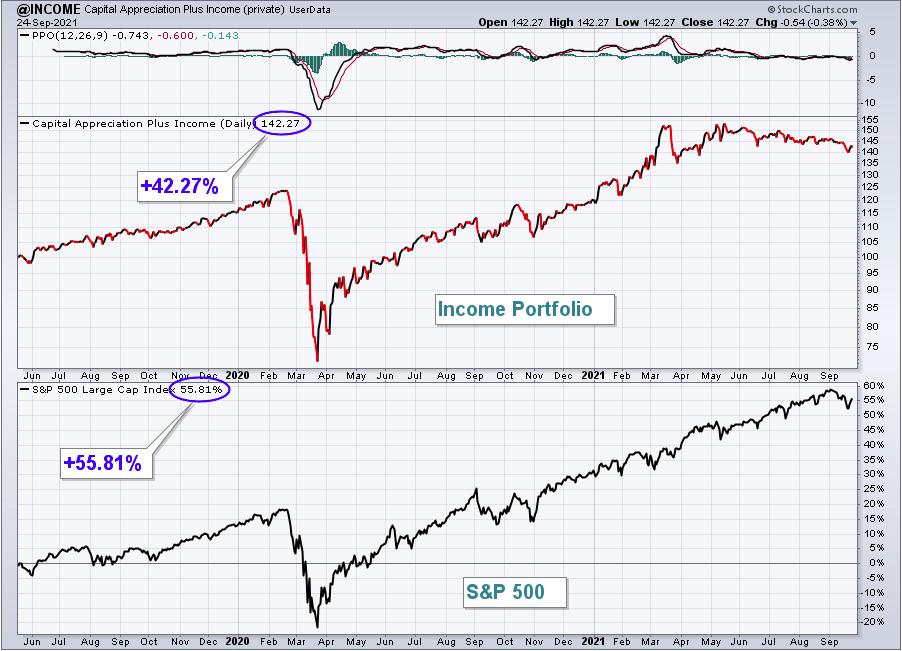
The Income Portfolio gained 0.13%, but fell a bit vs. the S&P 500. Here's the updated inception-to-date chart of the portfolio:
Here are how the Income portfolio component stocks performed last week:
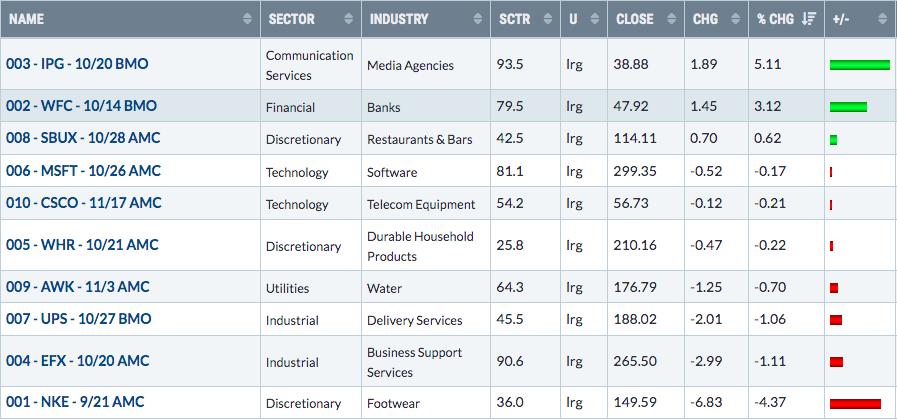
NKE reported its quarterly results, beating EPS estimates, but falling short on revenues. The company blamed supply chain disruptions for the shortfall. Technically, I don't like to see NKE lose key gap support:
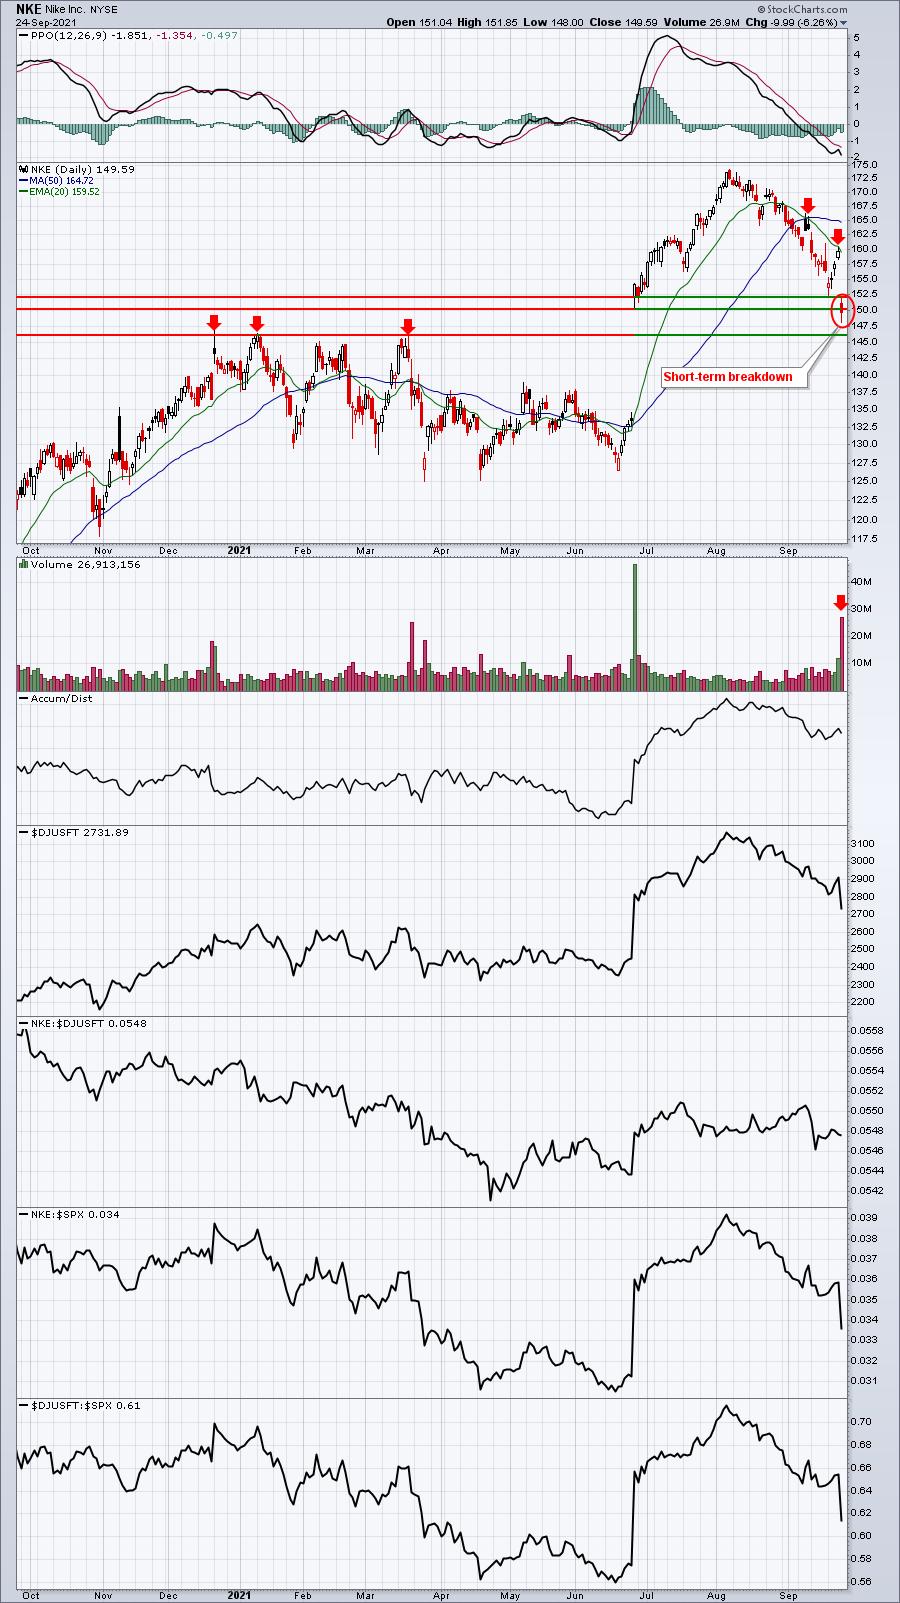
I eventually see NKE turning back to the upside as most stocks should do well in Q4. However, in the near-term, I believe there's further downside risk. Key price support should be found close to 146 and I wouldn't consider that the downtrend has ended until NKE can close AT LEAST back above its declining 20-day EMA. The red arrows above highlight both 20-day EMA resistance AND prior price support at that 146 level (which now is support).
Strong AD Portfolio:
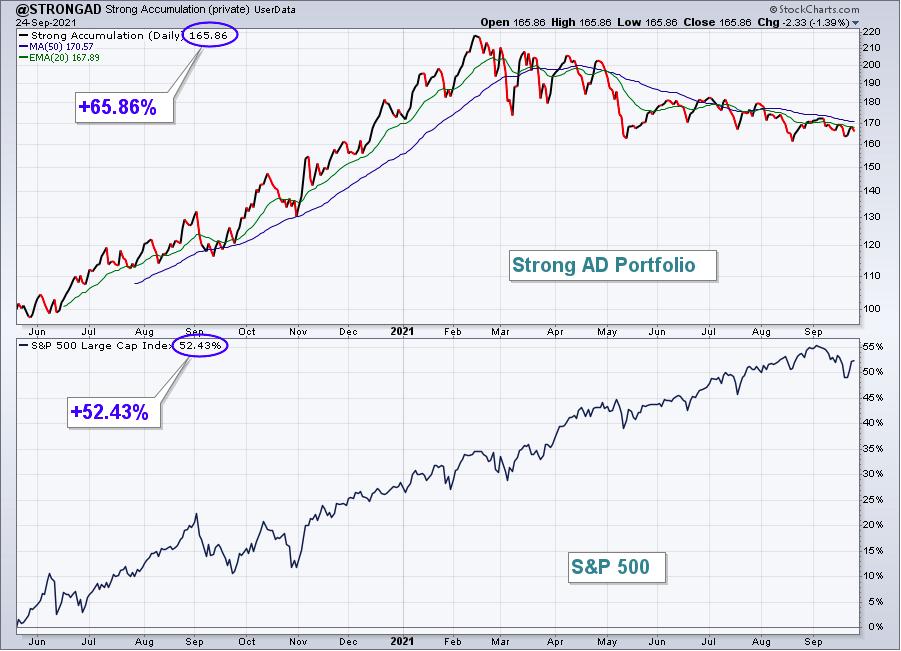
The Strong AD Portfolio lost 1.24% last week, losing ground to the S&P 500. Here's the updated inception-to-date chart of the portfolio:
Here are how the Strong AD portfolio component stocks performed last week:
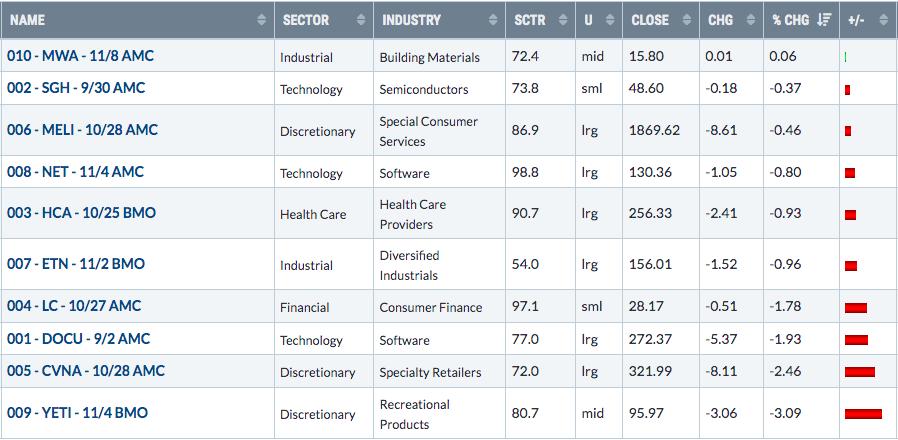
YETI, the worst performer in this portfolio last week, actually tested a key level of price support. I'd expect to see bounce next week:
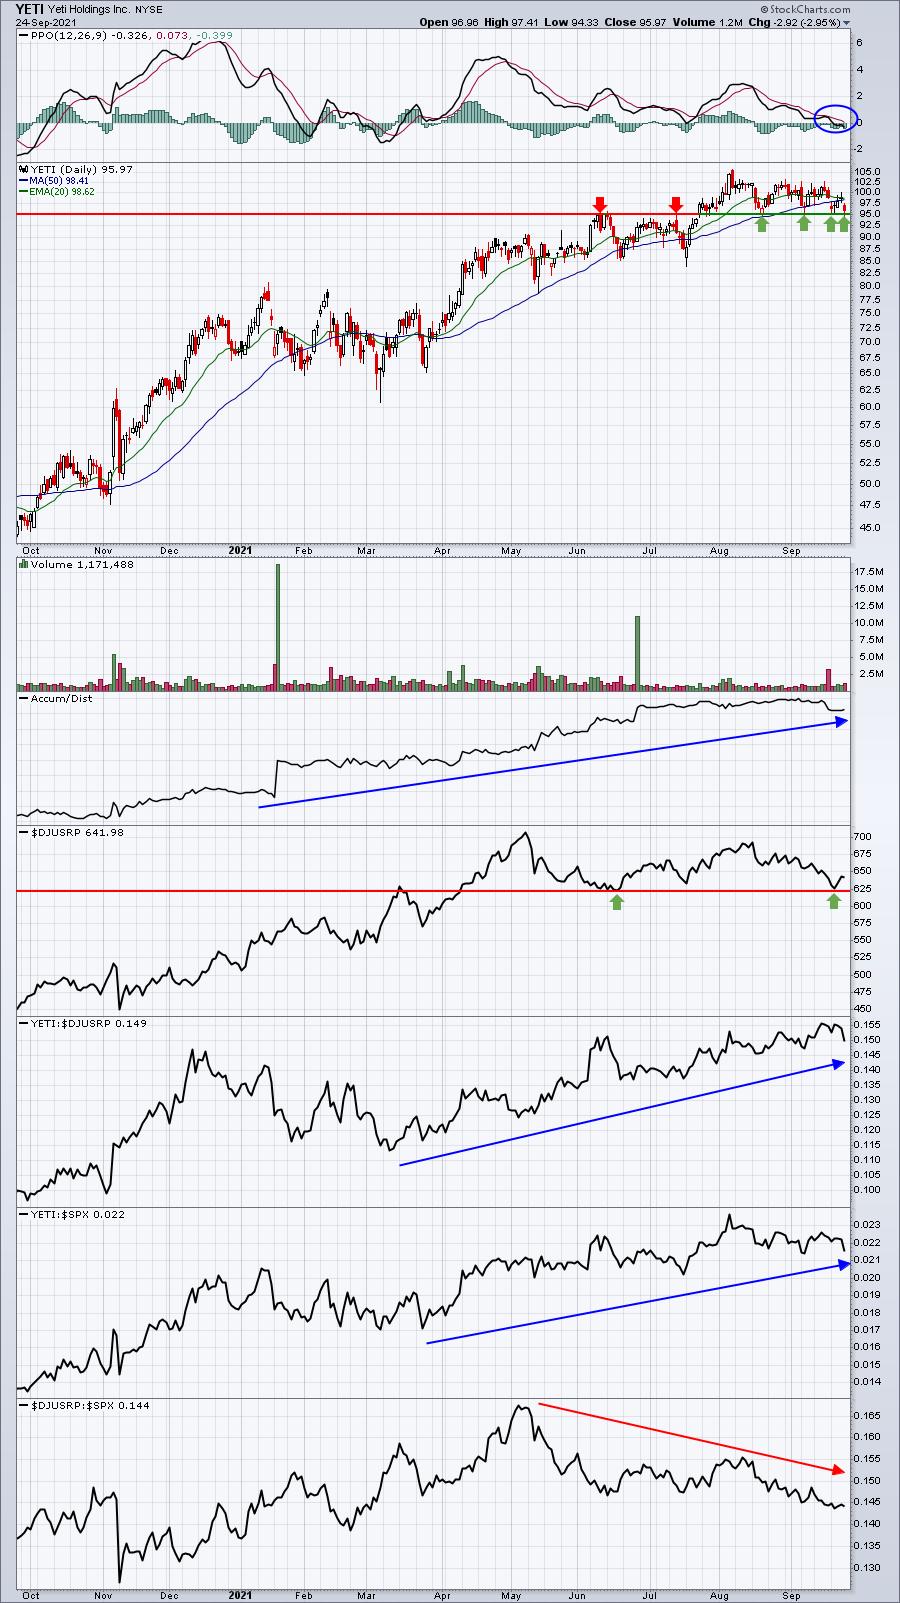
YETI, like M, shows the importance of sticking with leaders. The recreational products group ($DJUSRP) has been downtrending vs. the S&P 500 for over 4 months, while YETI has been trending higher vs. that benchmark, resulting in a recent 52-week relative high vs. its recreational product peers. Having said this, there's still no guarantee that price support near 95 holds. But I'm much more confident trading stocks showing relative strength.
Earnings Reaction Portfolio:
The Earnings Reaction Portfolio gained 0.70% last week, edging the S&P 500. Here's the updated inception-to-date chart of the portfolio:
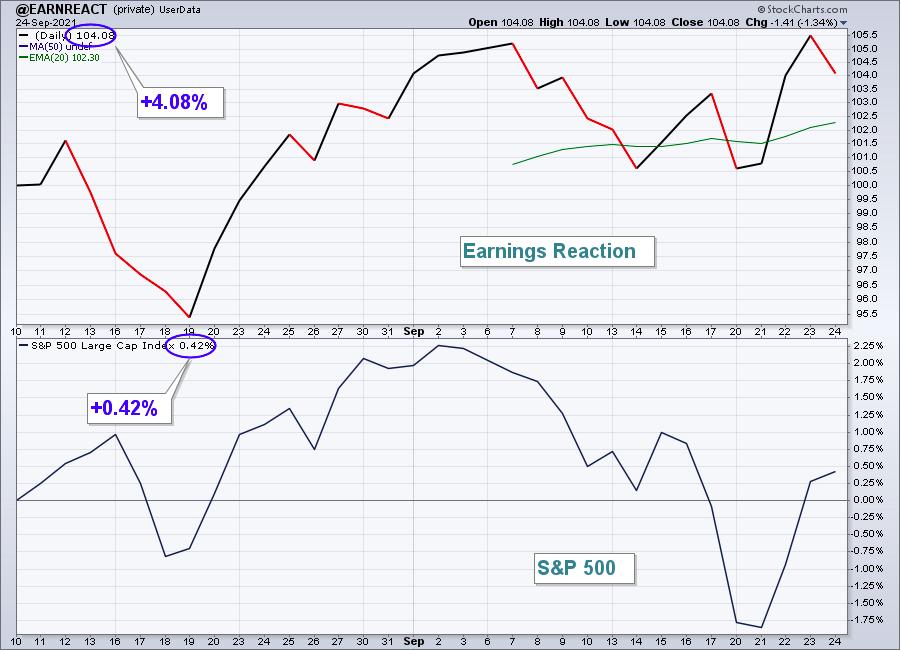
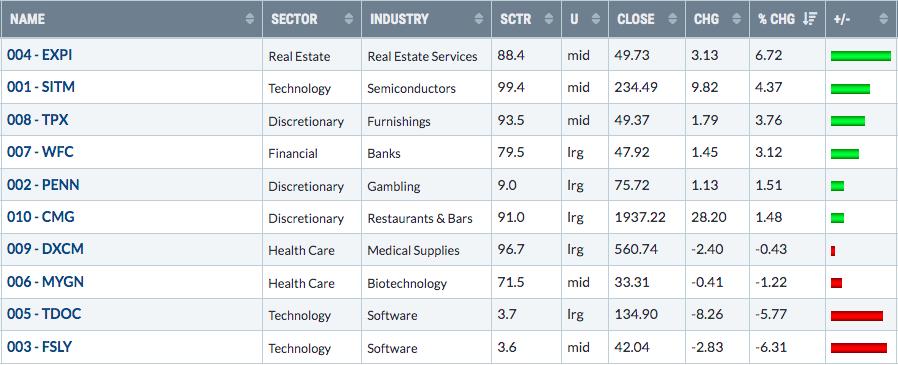
Here are how the Earnings Reaction portfolio component stocks performed last week:
Summary
We're closing in on Q4, which has produced the best calendar quarter performance on the S&P 500 since 1950. I honestly don't see what could hold the U.S. equity market back. I'm not talking about fundamentals. I receive plenty of emails from members and non-members that explain the stock market cannot go higher with mounds of fundamental worries. You know what? If those "issues" are truly problematic, we'll see it translate onto the charts. So when I say I don't see anything to hold back the stock market, I'm talking technically. If Wall Street isn't worrying about fundamental issues, then neither will I. I will ALWAYS listen to the charts, not the media. Sit back and think about all the fundamental "issues" that were supposed to take U.S. equities lower the past decade:
- TARP
- QE (quantitative easing)
- trade war
- various elections
- the 100-year pandemic (COVID)
- inflation/deflation
- government debt
- consumer debt
- PE ratios (my personal favorite)
- the Fed and higher interest rates
- the Fed and lower interest rates
- faltering GDP
- accelerating GDP
- the rising dollar
- the falling dollar
The list literally goes on and on. Blah, blah, blah. FOLLOW THE CHARTS. Declining treasury yields and downtrending transportation stocks have been the biggest issues technically and you rarely hear about that in the "news". The good news here, however, is that the 10-year treasury yield ($TNX) busted out of its recent sideways trading range and cleared 1.40%. I'm not saying that yields will now explode higher, but technically this is a very positive development for equities as money is now flowing OUT of bonds. History teaches us that rising yields are generally synonymous with rising equity prices (and rising transportation stocks).
One last thing. Rising treasury yields also tend to spur small cap stocks ($SML). Therefore, I'd be watching for positive technical developments on this asset class. The IWM (ETF that tracks the Russell 2000) is one way to play a potential rally in small caps. Seasonally, small caps (IWM) tend to jump start heading into October as well:
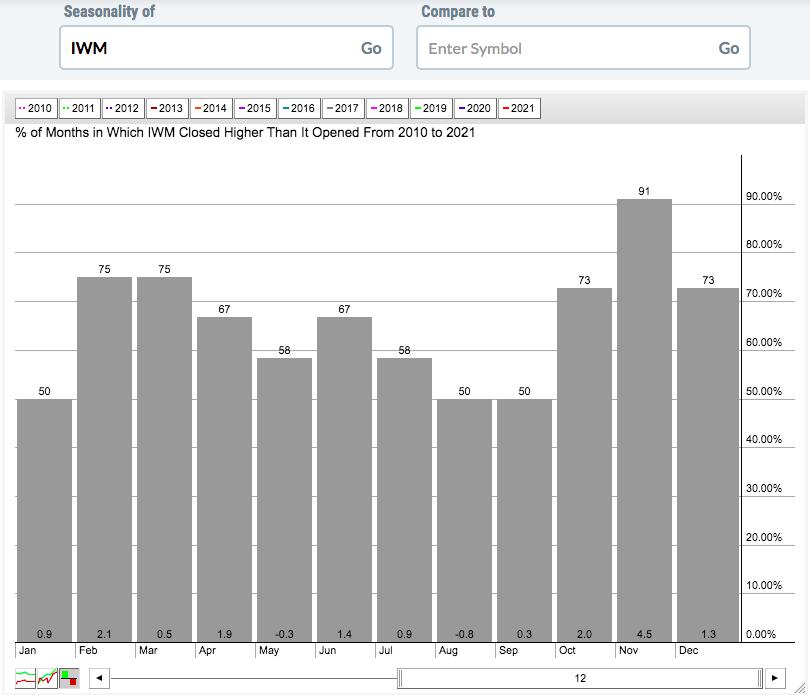
This represents the IWM performance over the past 12 years (beginning in 2010), or since the major 2009 market bottom. I think it's rather clear that small caps enjoy the Q4 time frame. Rising treasury yields won't hurt.
Model ETF Portfolio
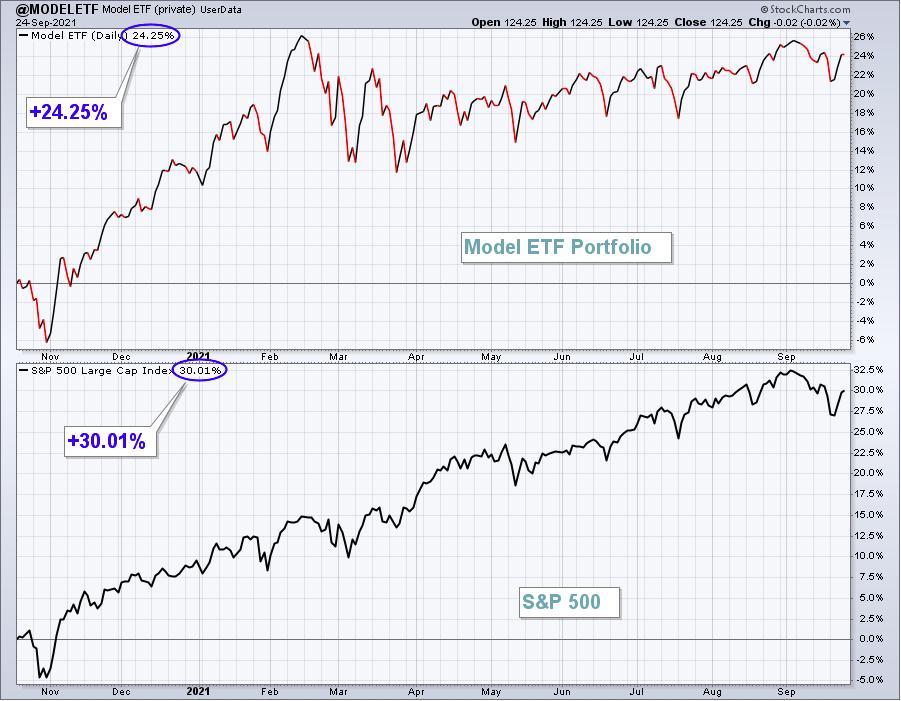
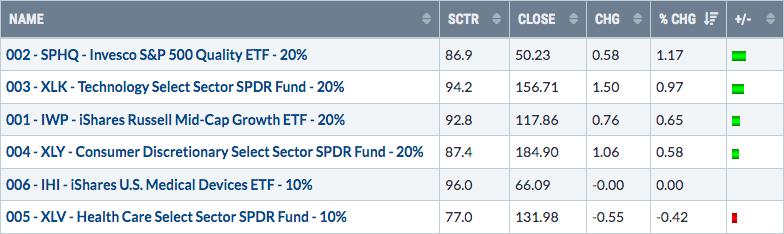
Our Model ETF Portfolio gained 0.43% last week, slightly underperforming the S&P 500.
Here's the updated inception-to-date chart of the Model ETF Portfolio:
Here are how the Model ETF Portfolio component ETFs performed last week:
Happy trading!
Tom Bowley, Chief Market Strategist
EarningsBeats.com
"Better timing. Better trades."