
EB Weekly Portfolio Report - October 17, 2021
Model ETF Portfolio "DRAFT"
On Tuesday, October 19th, at 4:30pm ET, I will review last quarter's Model ETF Portfolio results and announce the ETFs and respective weightings to be held in our Model ETF Portfolio for the next 3 months. Please mark your calendar and plan to attend, if this is of interest to you. Even if you don't trade or invest in ETFs, I'll be discussing themes that I favor over the next 3 months, which could provide you some things to consider in your own investing/trading.
Upcoming Earnings Reports
According to Zacks.com, the following companies will be reporting earnings this week and each is a component of one of our portfolios:
Monday, October 18: None
Tuesday, October 19: None
Wednesday, October 20: EFX
Thursday, October 21: SNAP, CMG, IPG, WHR, CROX
Friday, October 22: HCA
PLEASE NOTE: The above companies were provided after scanning the Zacks Earnings Calendar. My research is limited to what Zacks provides and I also can make a mistake from time to time, so please check for earnings dates for all companies that you own. We do hold our portfolio stocks through one earnings report, but every EarningsBeats.com member must make his/her own investing/trading decisions about holding stocks into earnings reports as it's the most volatile (risky) time to own a stock.
ALSO: WE HAVE "ORIGINAL" EXPECTED EARNINGS DATES POSTED NEXT TO EACH STOCK SYMBOL IN OUR VARIOUS PORTFOLIO CHARTLISTS. I UPDATED THOSE EXPECTED DATES THIS MORNING AND MANY OF THEM CHANGED SINCE THOSE ORIGINAL EXPECTED EARNINGS DATES, SO PLEASE BE AWARE OF THAT. YOU WILL SEE THOSE UPDATED EARNINGS DATES BELOW IN THE SUMMARY FOR EACH PORTFOLIO. IF YOU RE-DOWNLOAD OUR PORTFOLIOS FROM OUR WEBSITE, THE UPDATED EARNINGS DATES WILL AUTOMATICALLY APPEAR. AGAIN, I JUST WANT EVERYONE TO KNOW THAT MANY OF THESE EXPECTED EARNINGS DATES CHANGED IN RECENT WEEKS. PLEASE BE SURE TO DOUBLE CHECK EARNINGS DATES FOR ANY STOCKS THAT YOU HOLD.
Portfolio Rules and Objectives
Here are the common traits and objectives of our portfolios:
- There are 10 leading stocks from up to 10 leading industries in each portfolio (at the time of selection). Generally, there will only be one stock per industry group, but there could be exceptions.
- They are held for an entire 90-day period, with no stops in place. We strive for consistency, transparency, and simplicity in our portfolios. EB.com members may hold these stocks for the entire 90 days, trade them, use stops, etc., but for purposes of our calculation, we will make no exceptions to our "buy and hold for three months" strategy.
- Every stock will generally be held through ONE earnings report
- The expectation is that relative winners will carry the portfolio to outperformance
- They were all entered into as of the close on Thursday, August 19th; members may choose to try to time better entries, but EB.com "purchased" as of August 19th's closing price
- Primary objective is to outperform the benchmark S&P 500
Here are several considerations for EB members:
- I would expect the Strong AD and Aggressive portfolios to be the riskiest, followed by the Model portfolio, and then the Income portfolio
- The Strong AD portfolio will be selected from a combination of rising accumulation/distribution lines and SCTRs above 70 at the time of selection. It is the only portfolio that does NOT require a revenue and EPS beat in its most recent quarterly earnings report
- The Income portfolio stocks will all pay dividends, with the expected average dividend yield to be at least 1.0%
- Drawdowns (losses) should be much milder on the Income portfolio, with more volatility expected on the other three; please review inception-to-date charts below to gain an idea of the volatility associated with each
- I believe the larger drawdown on the Income portfolio at the beginning of the pandemic was an anomaly, occurring as many defensive, higher-yielding companies uncharacteristically underperformed during a market decline.
- Large drawdowns in the February through May period were due to the rapid rotation from growth stocks to value stocks; each quarter, our portfolios are based on themes and there is never a guarantee that our analysis and beliefs will be proven correct
- You should consider owning or trading these stocks in whatever manner is most comfortable for you; while we will buy all 10 stocks in the manner identified above, feel free to trade certain stocks or wait for pullbacks if the stocks are overbought
- We have no idea what risk each member is willing or able to take. We are not registered investment advisors so be sure you understand the risk you take. Please consult your financial advisor.
- EarningsBeats.com shareholders/employees may own all or some of the portfolio stocks from time to time.
Weekly Snapshot
Here's a weekly recap:
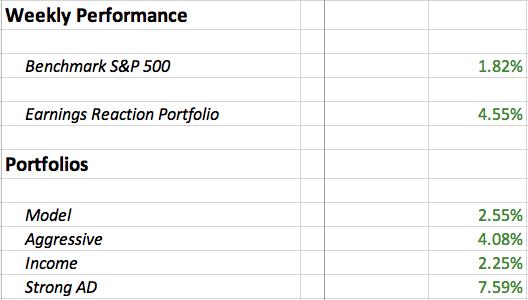
It was a solid week for the benchmark S&P 500 and an even better week for our portfolios. It was particularly nice to see a very strong week for our Strong AD Portfolio as that group has been drifting lower vs. the S&P 500 for many weeks.
Weekly Summary
Benchmark S&P 500:
The S&P 500 reclaimed its 20-day EMA, ending its recent period of downtrending prices - in my opinion, of course. It's possible that we'll consolidate in sideways fashion, but I would not be looking for another move beneath the recent low. Here's how the chart now looks:
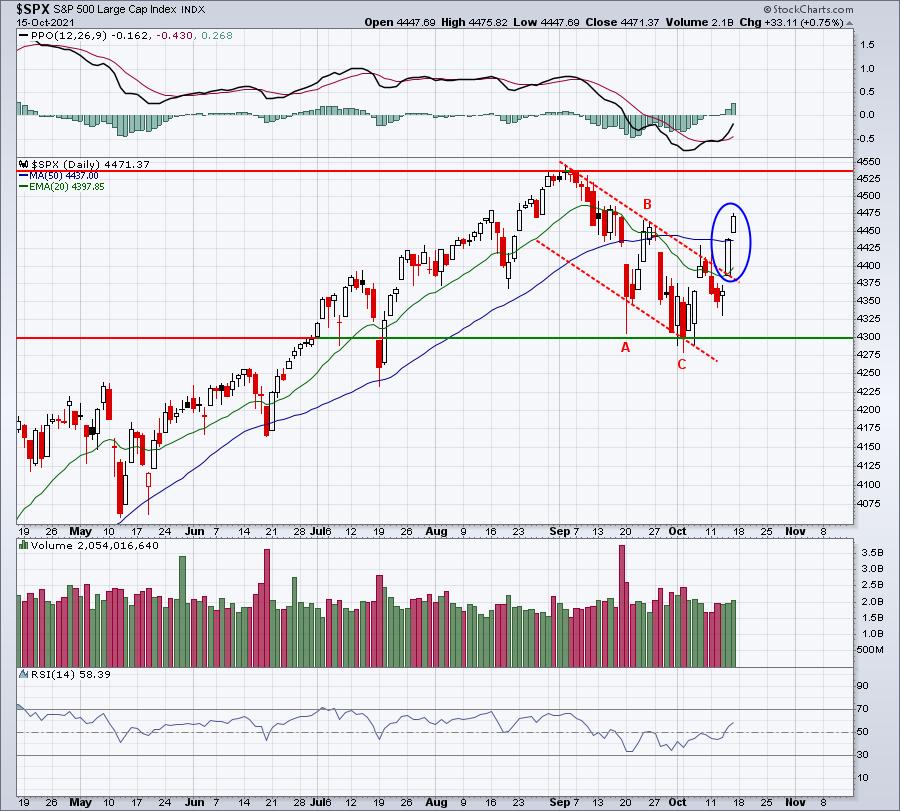
I believe the breakout above the down channel on Thursday/Friday confirms that the A-B-C correction is over. It is still possible we consolidate, however. I don't believe we will as I'm looking for new all-time highs ahead, but we have no confirmation of that. Keep an eye on the key intermediate-term high and low now. That's roughly 4540 to the upside and 4300 to the downside.
Model Portfolio:
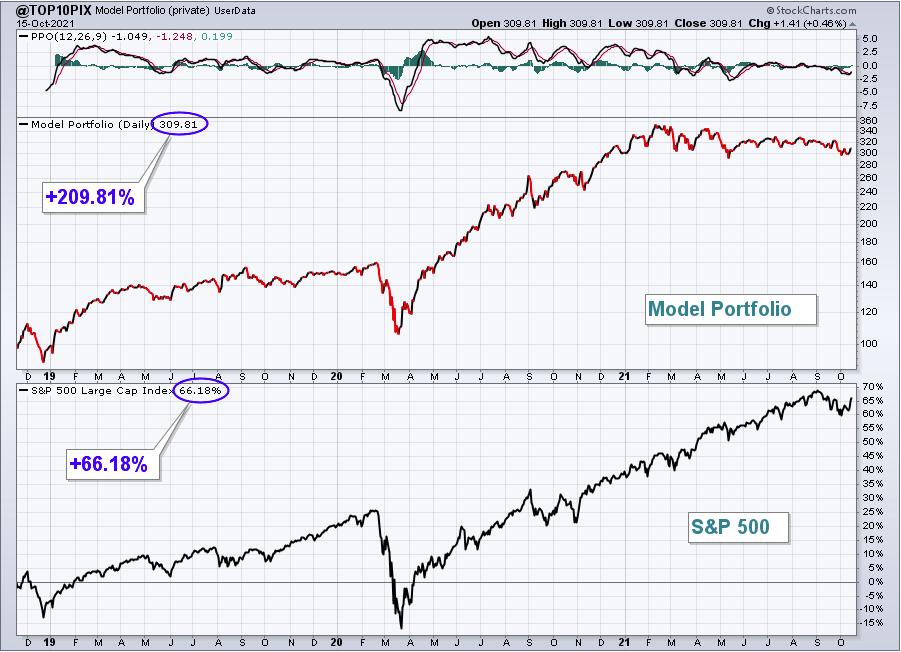
The Model Portfolio jumped 2.55%, gaining a bit on the S&P 500. Here's the updated inception-to-date chart of the portfolio:
Here are how the Model portfolio component stocks performed last week:
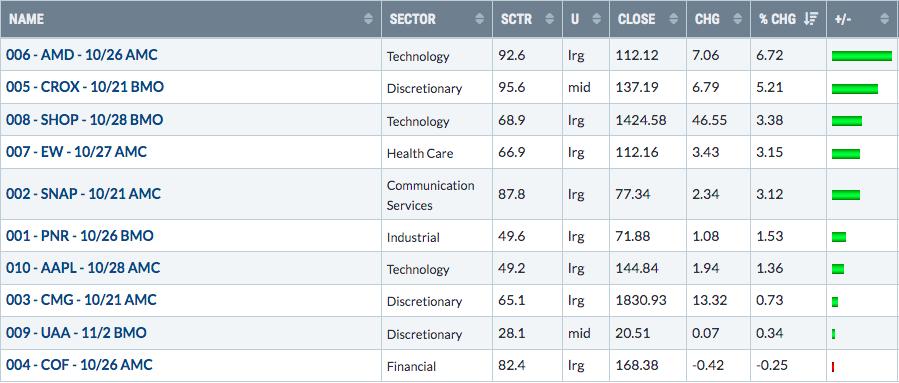
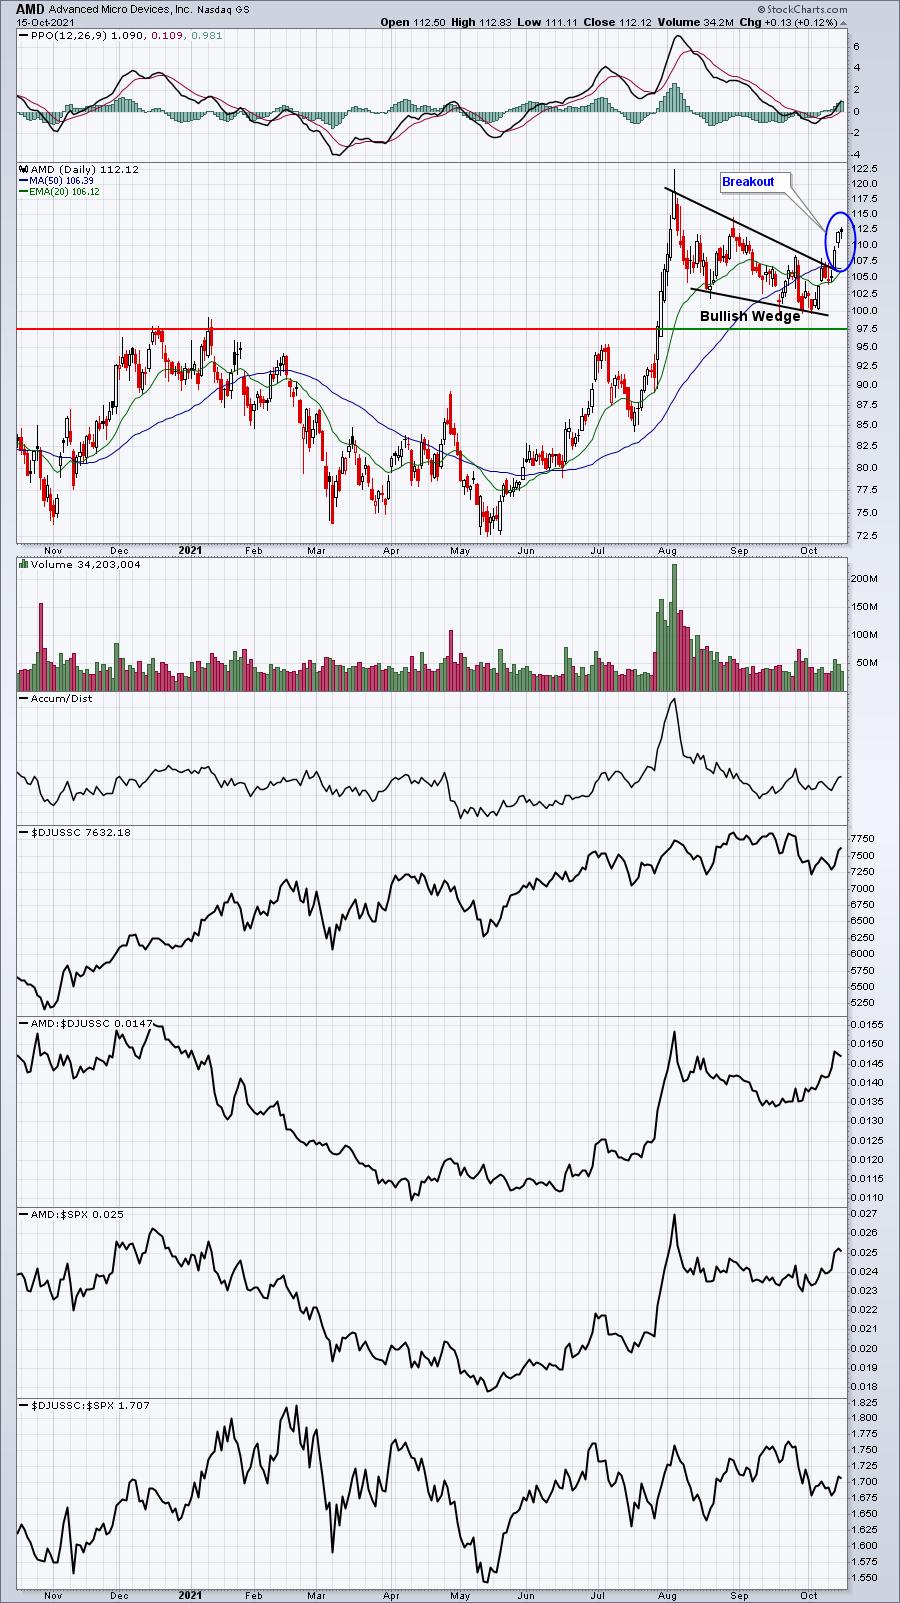
AMD has resumed its earlier uptrend after nearly testing its key level of price support. It very well could be in the midst of a pre-earnings advance higher:
Aggressive Portfolio:
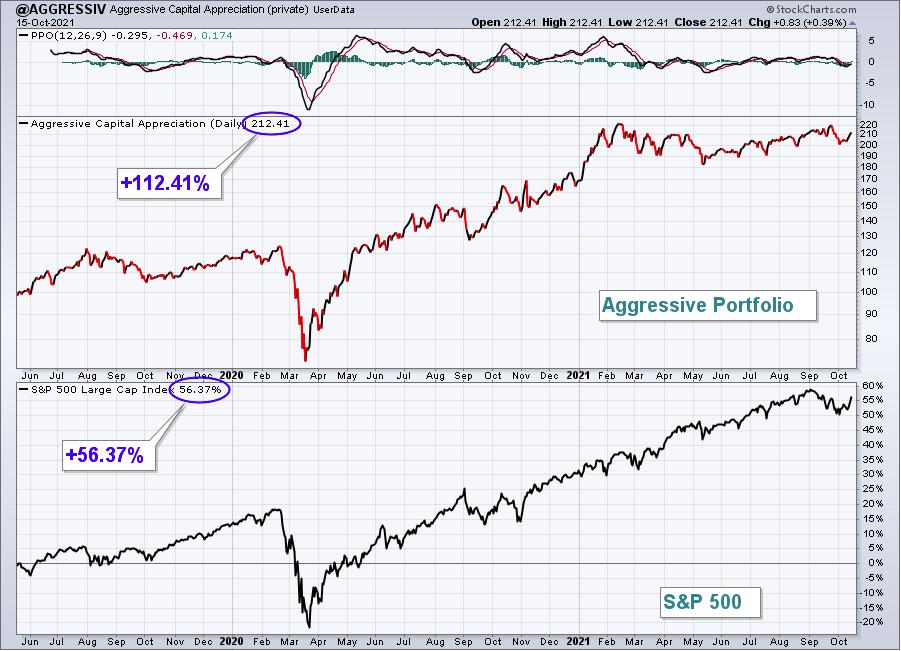
The Aggressive Portfolio climbed 4.08% last week, easily surpassing the S&P 500. Here's the updated inception-to-date chart of the portfolio:
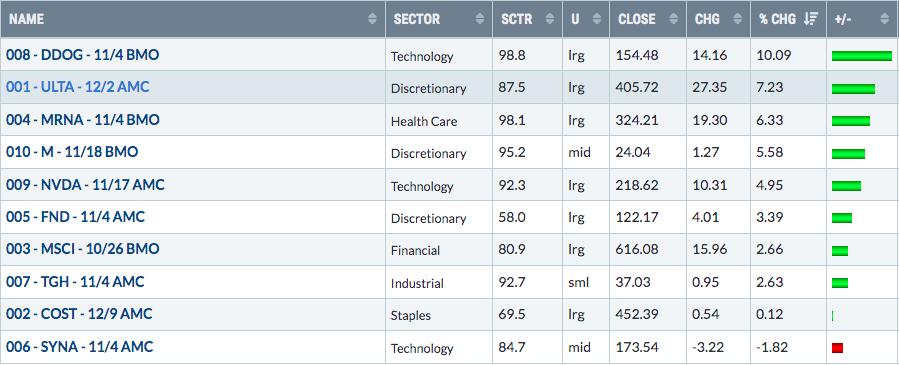
Here are how the Aggressive portfolio component stocks performed last week:
SYNA was the sole component stock to lose ground in the Aggressive Portfolio. I expect that it will bounce from this exact area OR at the top of gap support. Here's what I see:
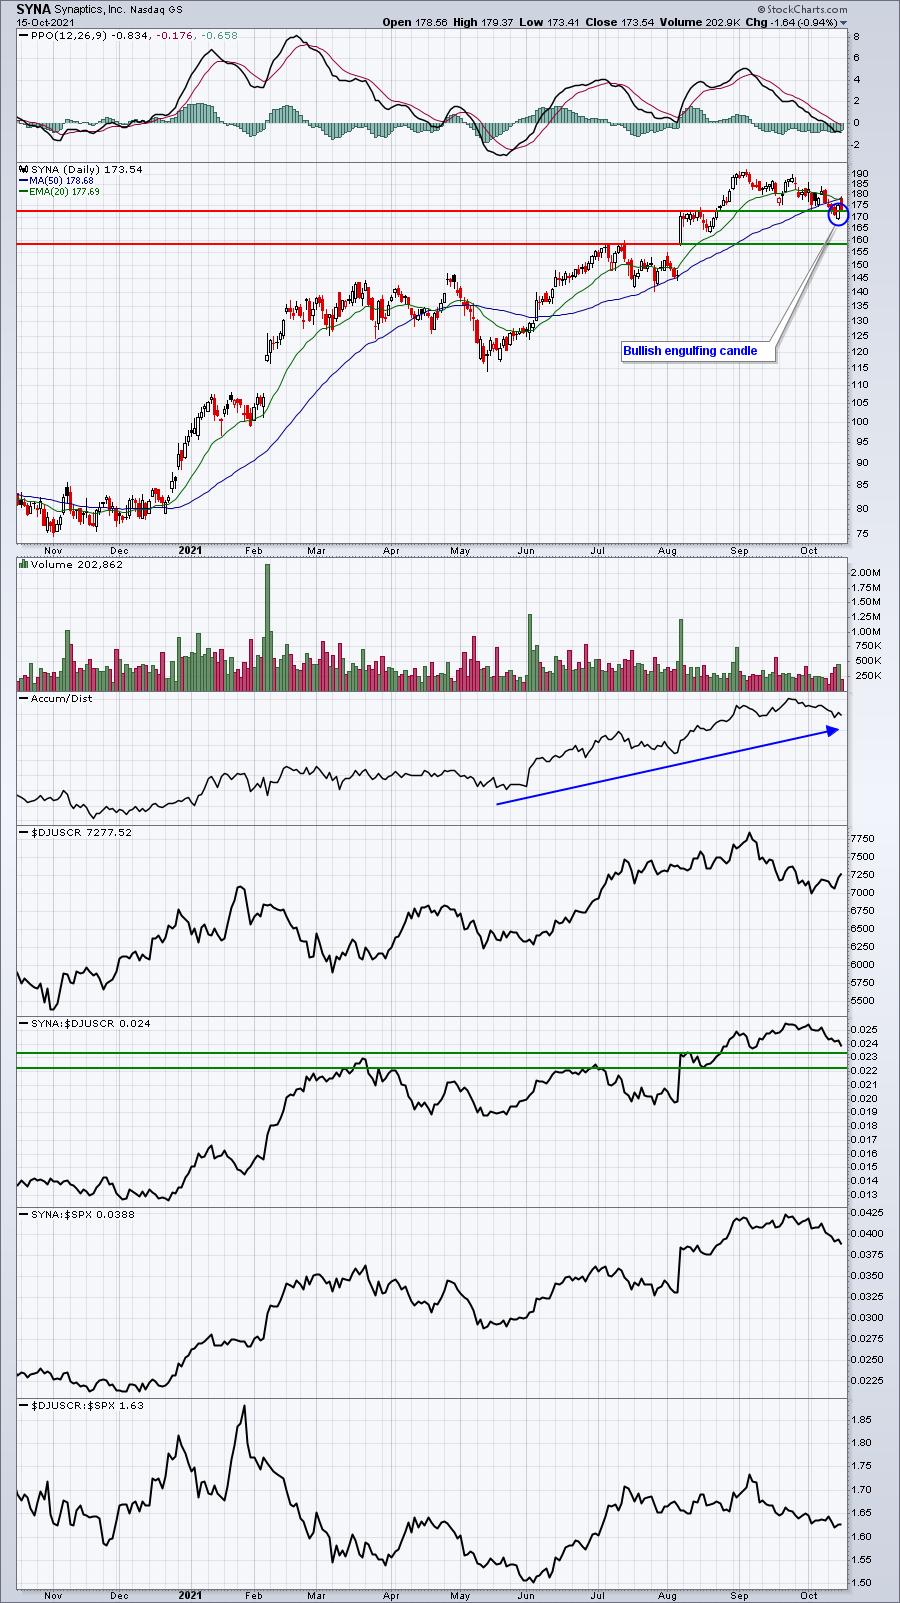
I like that reversing bullish engulfing candle as this weakness seems to be more about the overall group seeing profit taking rather than anything stock-specific. SYNA's relative strength remains intact and its AD line is strong as well.
Income Portfolio:
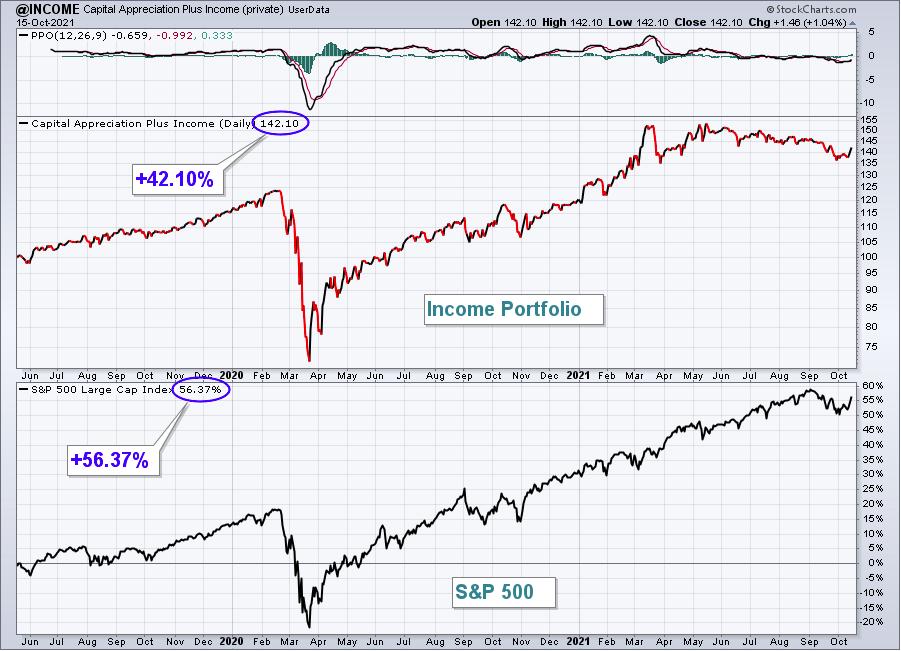
The Income Portfolio rose 2.25%, besting the S&P 500. Here's the updated inception-to-date chart of the portfolio:
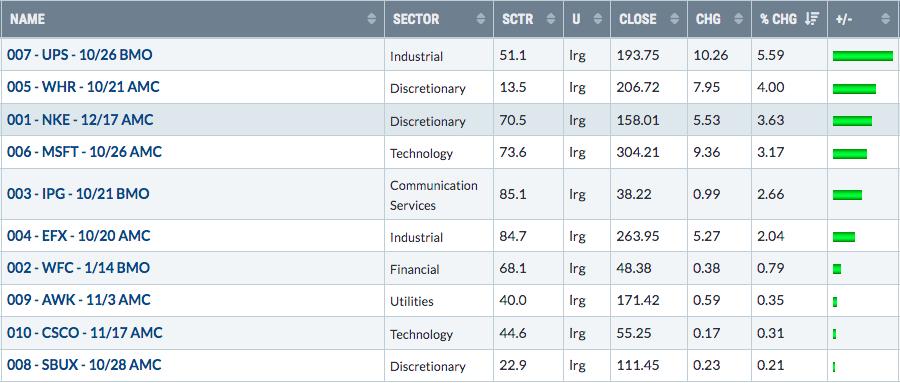
Here are how the Income portfolio component stocks performed last week:
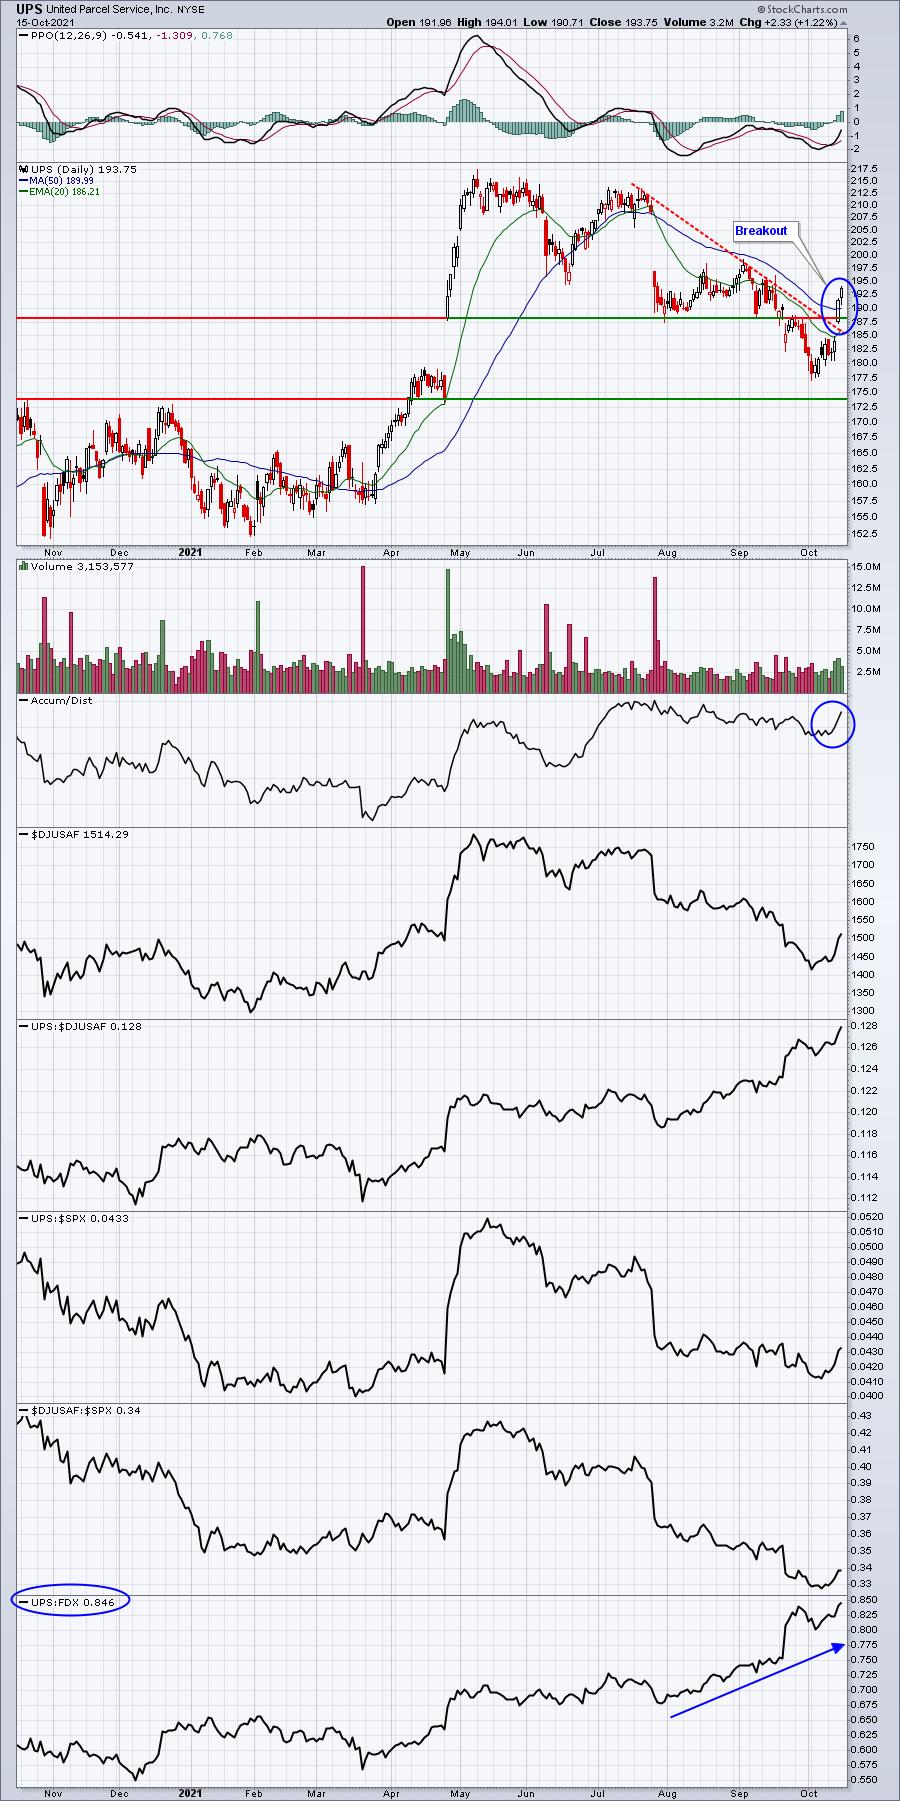
UPS had a strong week and is showing more bullish characteristics of late. Volume picked up late last week as UPS broke out of its recent downtrend. Its AD line is suggesting that recent weakness was accompanied by accumulation rather than distribution, another positive signal. And Wall Street has clearly announced its preference of UPS over FedEx (FDX) - check out the bottom panel below:
Strong AD Portfolio:
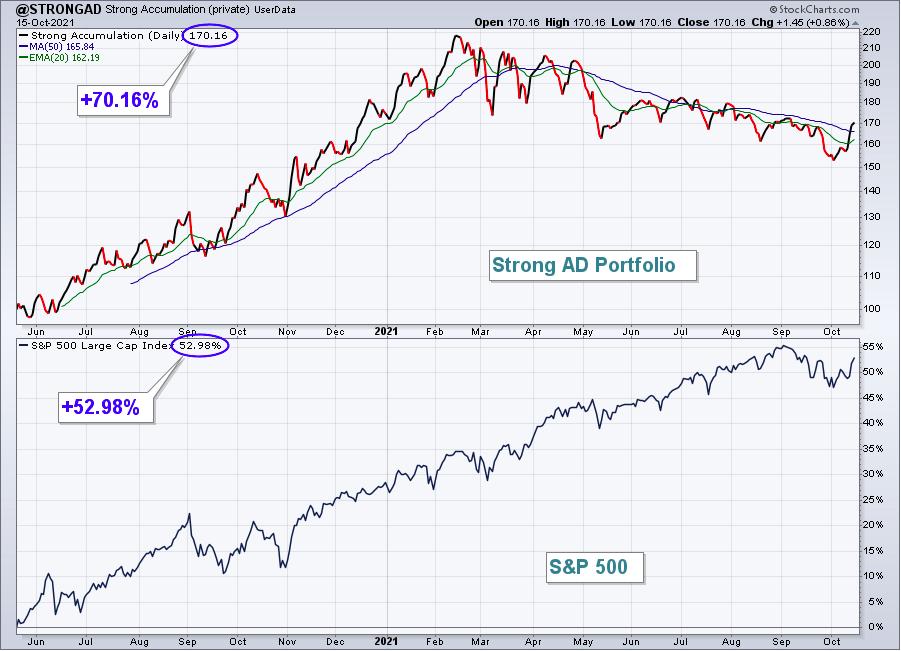
The Strong AD Portfolio surged 7.59%, posting one of its best weeks of the year. Here's the updated inception-to-date chart of the portfolio:
Here are how the Strong AD portfolio component stocks performed last week:
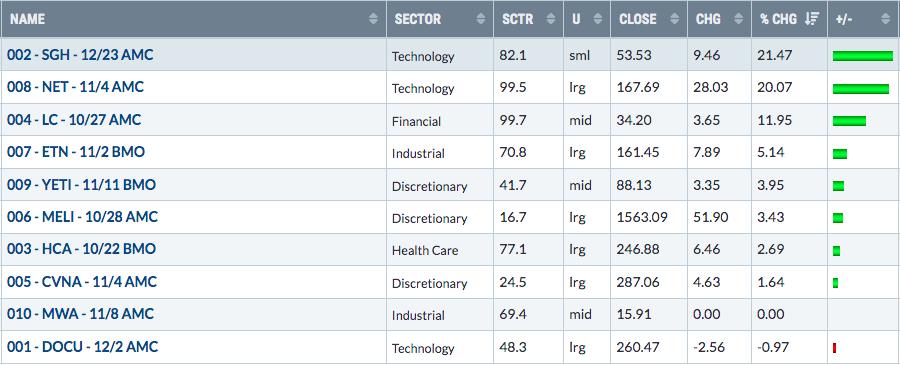
Two of our Strong AD Portfolio stocks gained more than 20% last week, which was the big reason the portfolio had such a strong week relative to the S&P 500. But I'll focus instead on the stock that didn't work last week - Docusign (DOCU):
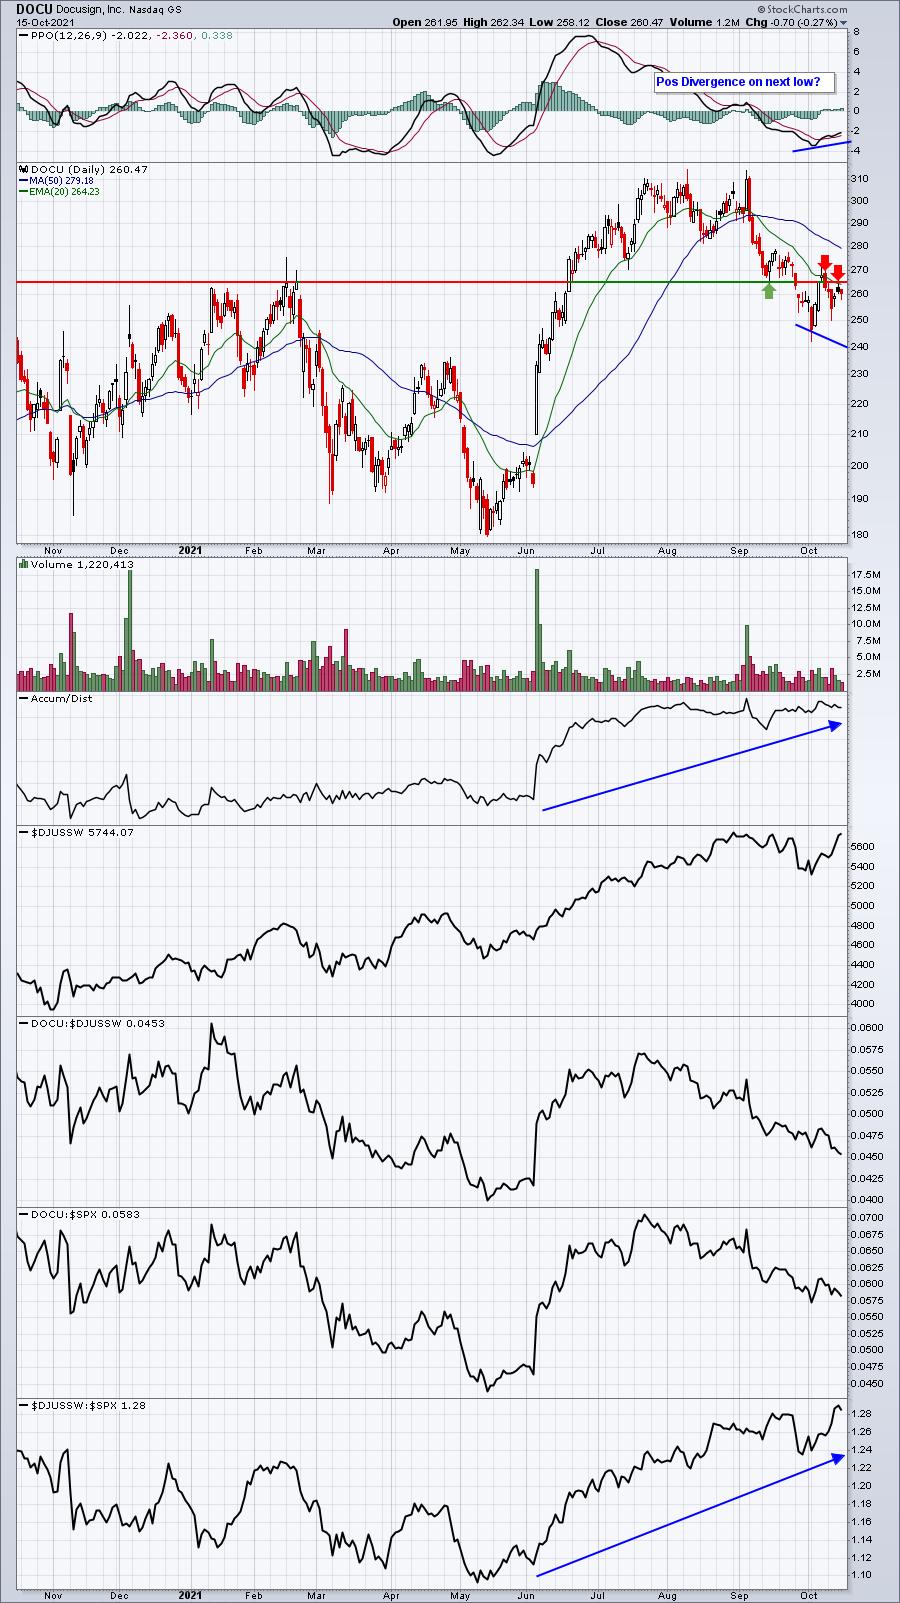
I look for DOCU to rally back. It doesn't report earnings again until early December, so there's no rush for institutions to buy "pre-earnings". As it's fallen back, check out its AD line, which remains near a high. If it were to weaken further, we'd likely see a positive divergence print - higher PPO reading on a lower price. If I owned DOCU, I'd hold it based on what I'm seeing, understanding we could see one more low print. If I were to consider trading DOCU, I'd either wait on that new low with a positive divergence OR I'd buy on a break above 270, then use the 20-day EMA as a tight stop moving forward.
Earnings Reaction Portfolio:
The Earnings Reaction Portfolio fell %, . Here's the updated inception-to-date chart of the portfolio:
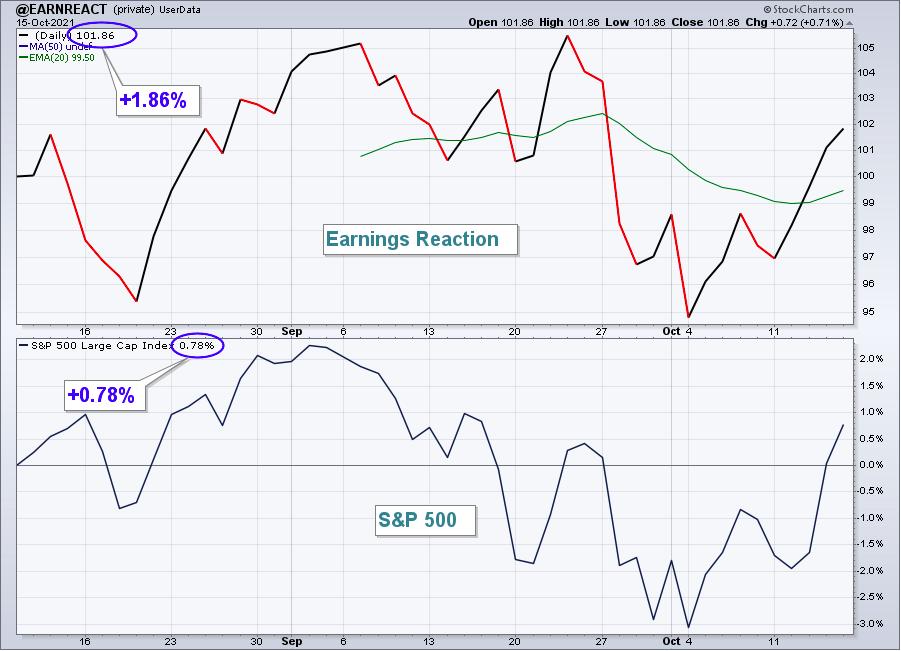
Here are how the Earnings Reaction portfolio component stocks performed last week:
Summary
We're going to have a test, starting late this upcoming week. If technical conditions continue to improve, we'll have overhead resistance on the S&P 500 at its early-September high. That timing could coincide with the worst historical period of the year for the S&P 500 since 1950. The October 21st (close) through October 27th (close) period has produced annualized returns of -43.42%. That doesn't mean we'll go lower this year during this period, but it does tell us the S&P 500 tendency, which has been bearish. If we finish next week at or near price resistance, this historical data would provide us one additional reason to be a bit cautious, that's all. I certainly am not expecting some sort of major selloff, but a temporary pullback would align seasonally.
Model ETF Portfolio
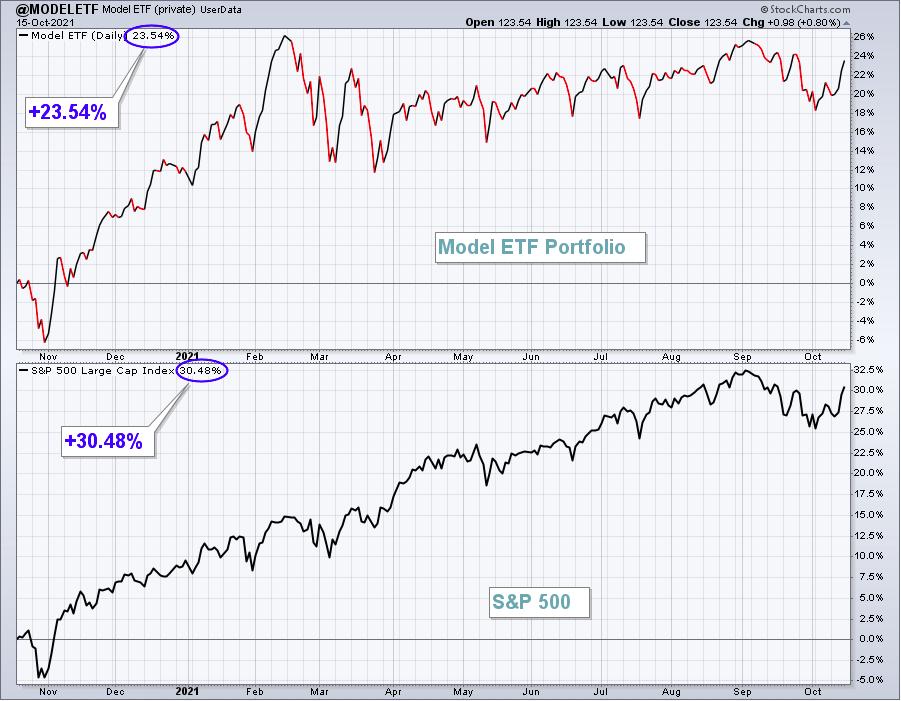
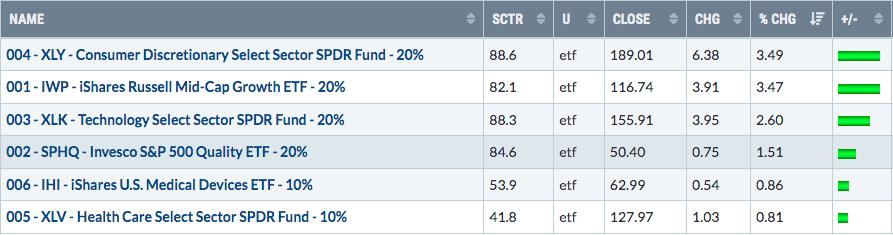
Our Model ETF Portfolio rose 2.39% last week, edging the 1.82% gain in the S&P 500. Our Model ETF Portfolio has now moved past the S&P 500's return this quarter (7/19 through 10/16), with just two days left before our next quarterly draft on Tuesday, October 19th at 4:30pm ET.
Here's the updated inception-to-date chart of the Model ETF Portfolio:
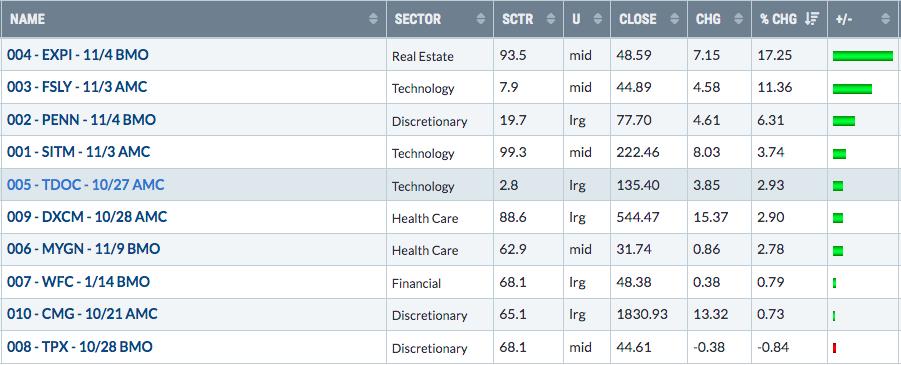
Here are how the Model ETF Portfolio component ETFs performed last week:
Happy trading!
Tom Bowley, Chief Market Strategist
EarningsBeats.com
"Better timing. Better trades."