
EB Weekly Portfolio Report - Sunday, October 24, 2021
Upcoming Earnings Reports
According to Zacks.com, the following companies will be reporting earnings this week and each is a component of one of our portfolios:
Monday, October 25: None
Tuesday, October 26: PNR, COF, AMD, MSCI, MSFT, UPS
Wednesday, October 27: EW, LC, TDOC (Earnings Reaction)
Thursday, October 28: SHOP, AAPL, SBUX, MELI, TPX (Earnings Reaction), DXCM (Earnings Reaction)
Friday, October 29: None
PLEASE NOTE: The above companies were provided after scanning the Zacks Earnings Calendar. My research is limited to what Zacks provides and I also can make a mistake from time to time, so please check for earnings dates for all companies that you own. We do hold our portfolio stocks through one earnings report, but every EarningsBeats.com member must make his/her own investing/trading decisions about holding stocks into earnings reports as it's the most volatile (risky) time to own a stock.
ALSO: WE HAVE "ORIGINAL" EXPECTED EARNINGS DATES POSTED NEXT TO EACH STOCK SYMBOL IN OUR VARIOUS PORTFOLIO CHARTLISTS. I UPDATED THOSE EXPECTED DATES THIS MORNING AND MANY OF THEM CHANGED SINCE THOSE ORIGINAL EXPECTED EARNINGS DATES, SO PLEASE BE AWARE OF THAT. YOU WILL SEE THOSE UPDATED EARNINGS DATES BELOW IN THE SUMMARY FOR EACH PORTFOLIO. IF YOU RE-DOWNLOAD OUR PORTFOLIOS FROM OUR WEBSITE, THE UPDATED EARNINGS DATES WILL AUTOMATICALLY APPEAR. AGAIN, I JUST WANT EVERYONE TO KNOW THAT MANY OF THESE EXPECTED EARNINGS DATES CHANGED IN RECENT WEEKS. PLEASE BE SURE TO DOUBLE CHECK EARNINGS DATES FOR ANY STOCKS THAT YOU HOLD.
Portfolio Rules and Objectives
Here are the common traits and objectives of our portfolios:
- There are 10 leading stocks from up to 10 leading industries in each portfolio (at the time of selection). Generally, there will only be one stock per industry group, but there could be exceptions.
- They are held for an entire 90-day period, with no stops in place. We strive for consistency, transparency, and simplicity in our portfolios. EB.com members may hold these stocks for the entire 90 days, trade them, use stops, etc., but for purposes of our calculation, we will make no exceptions to our "buy and hold for three months" strategy.
- Every stock will generally be held through ONE earnings report
- The expectation is that relative winners will carry the portfolio to outperformance
- They were all entered into as of the close on Thursday, August 19th; members may choose to try to time better entries, but EB.com "purchased" as of August 19th's closing price
- Primary objective is to outperform the benchmark S&P 500
Here are several considerations for EB members:
- I would expect the Strong AD and Aggressive portfolios to be the riskiest, followed by the Model portfolio, and then the Income portfolio
- The Strong AD portfolio will be selected from a combination of rising accumulation/distribution lines and SCTRs above 70 at the time of selection. It is the only portfolio that does NOT require a revenue and EPS beat in its most recent quarterly earnings report
- The Income portfolio stocks will all pay dividends, with the expected average dividend yield to be at least 1.0%
- Drawdowns (losses) should be much milder on the Income portfolio, with more volatility expected on the other three; please review inception-to-date charts below to gain an idea of the volatility associated with each
- I believe the larger drawdown on the Income portfolio at the beginning of the pandemic was an anomaly, occurring as many defensive, higher-yielding companies uncharacteristically underperformed during a market decline.
- Large drawdowns in the February through May period were due to the rapid rotation from growth stocks to value stocks; each quarter, our portfolios are based on themes and there is never a guarantee that our analysis and beliefs will be proven correct
- You should consider owning or trading these stocks in whatever manner is most comfortable for you; while we will buy all 10 stocks in the manner identified above, feel free to trade certain stocks or wait for pullbacks if the stocks are overbought
- We have no idea what risk each member is willing or able to take. We are not registered investment advisors so be sure you understand the risk you take. Please consult your financial advisor.
- EarningsBeats.com shareholders/employees may own all or some of the portfolio stocks from time to time.
Weekly Snapshot
Here's a weekly recap:
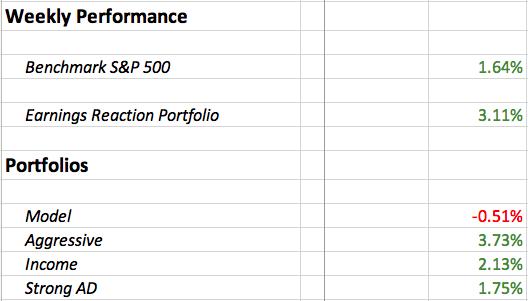
Overall, it was a solid week for our portfolios. Unfortunately, our Model Portfolio took a hit when Snap, Inc. (SNAP) reported disappointing revenues and offered a less-than-inspiring outlook. More on that below. Our other portfolios all beat the S&P 500 last week, however, which was encouraging as we head into the teeth of earnings season.
Weekly Summary
Benchmark S&P 500:
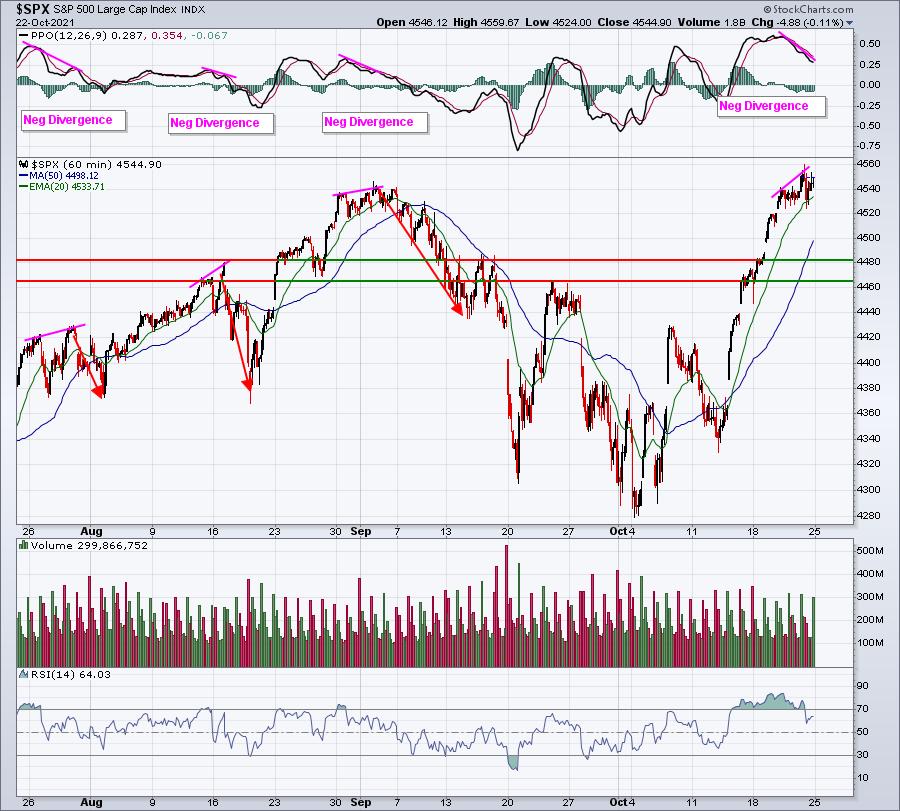
The S&P 500 set fresh intraday and closing all-time highs last week, on the surface a very bullish development. But it is facing a technical hurdle given the hourly negative divergence reflected below:
It was also a bit disconcerting seeing last week's sector leaderboard peppered with defensive groups:
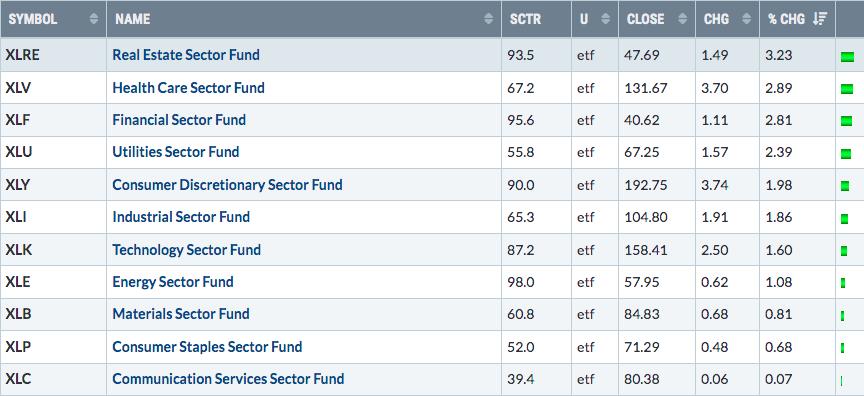
An all-time high set with leadership from real estate and health care? Hhhhmmmmm.
Model Portfolio:
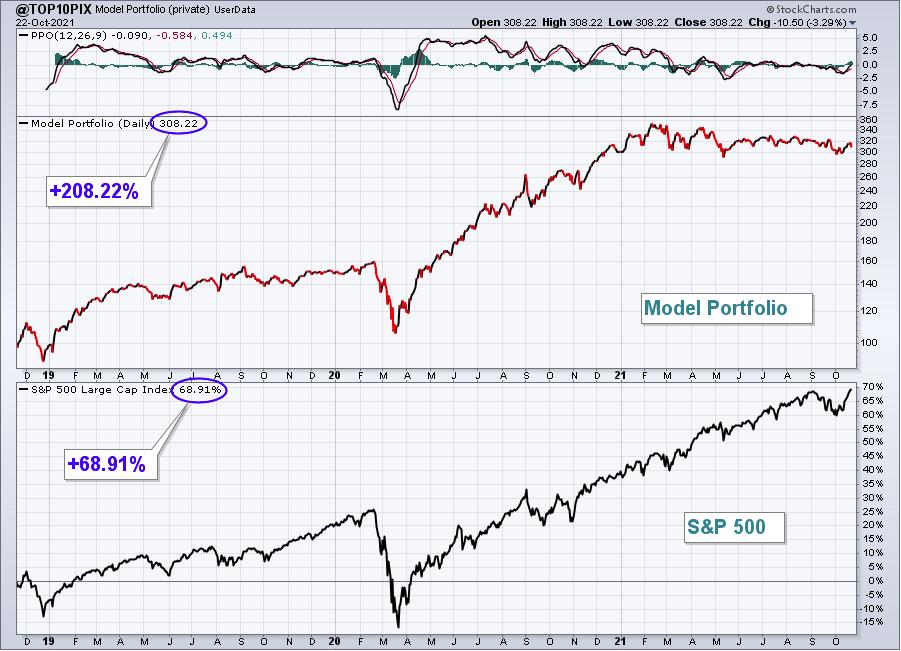
The Model Portfolio fell 0.51%, underperforming the S&P 500. Here's the updated inception-to-date chart of the portfolio:
Here are how the Model portfolio component stocks performed last week:
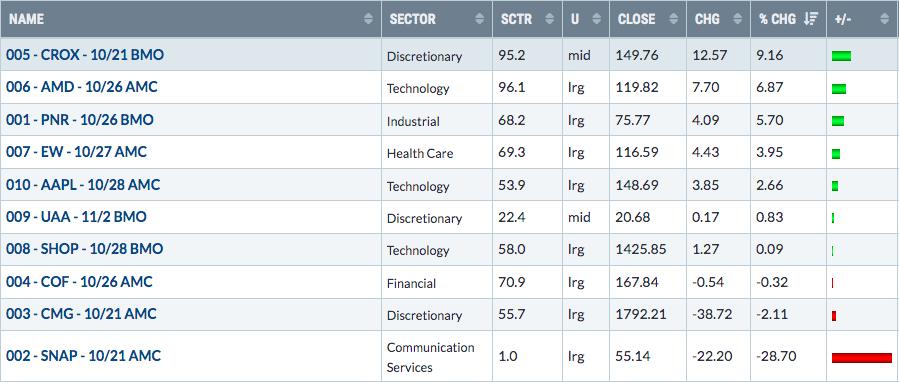
The Model Portfolio actually had a decent week, except for the disaster that was SNAP. Management discussed the impact that Apple privacy issues would have on SNAP's advertising revenue and SNAP traders, along with other software stocks' traders facing similar issues, took a SELL NOW, BUY LATER approach. Clearly, the chart here was damaged technically after a steep earnings-related drop. Most traders will likely be in "damage control" mode, looking to escape on any price strength. Here's the current technical look at the chart:
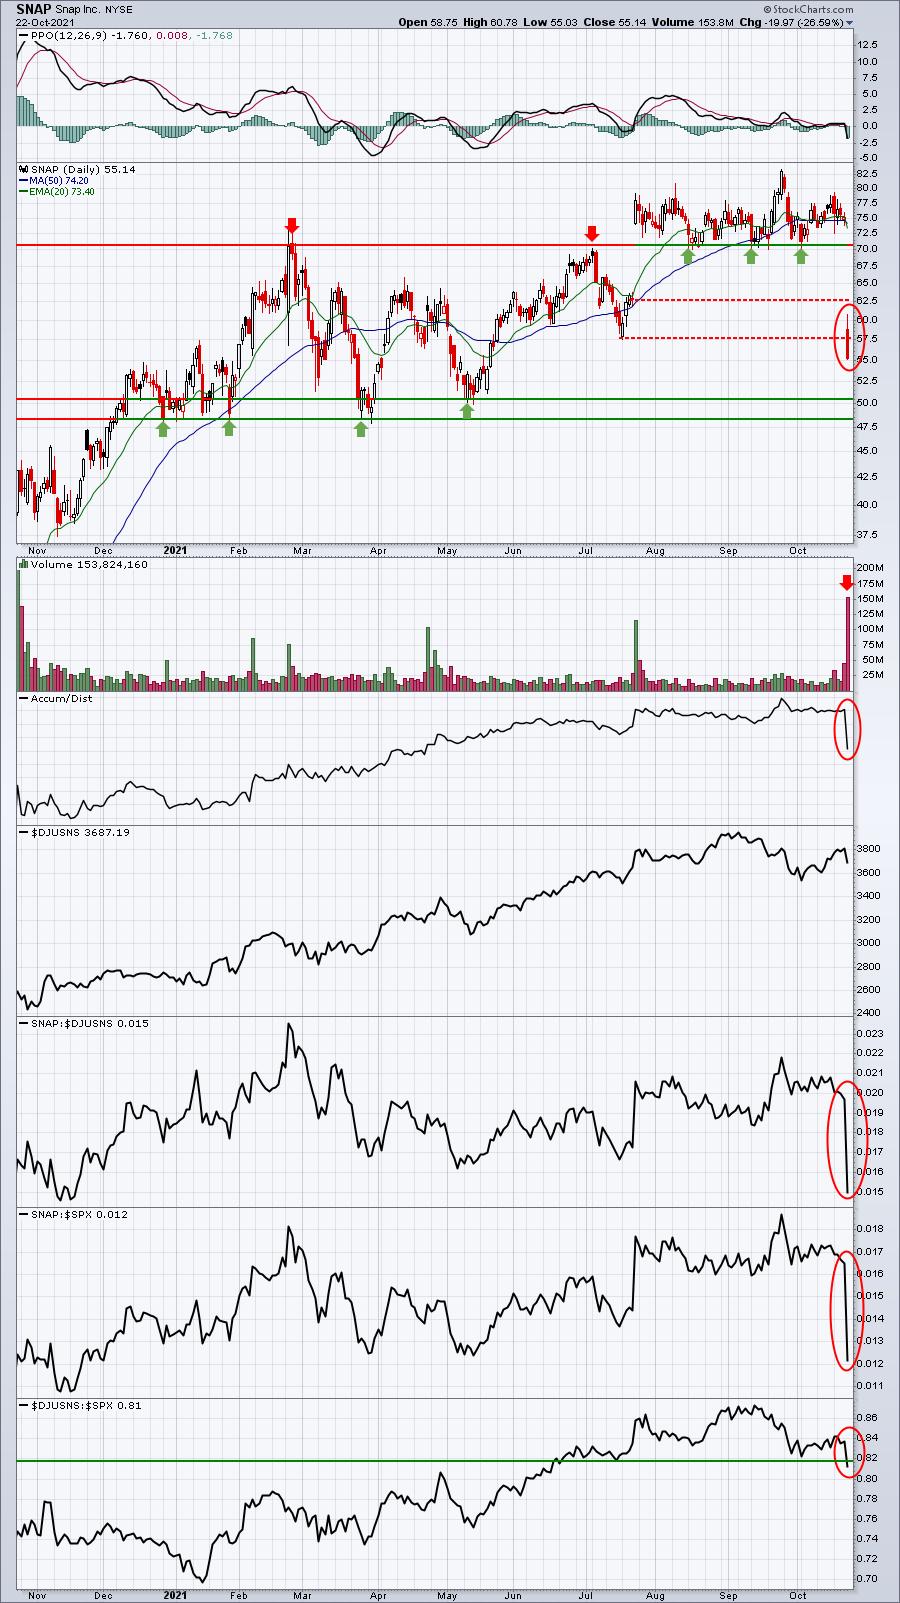
Short-term price resistance is likely to be found in the 57.50-62.50 area, while critical longer-term support is in the 48-50 range.
Aggressive Portfolio:
The Aggressive Portfolio surged 3.73% last week, adding distance to its quarter-to-date lead over the S&P 500. Here's the updated inception-to-date chart of the portfolio:
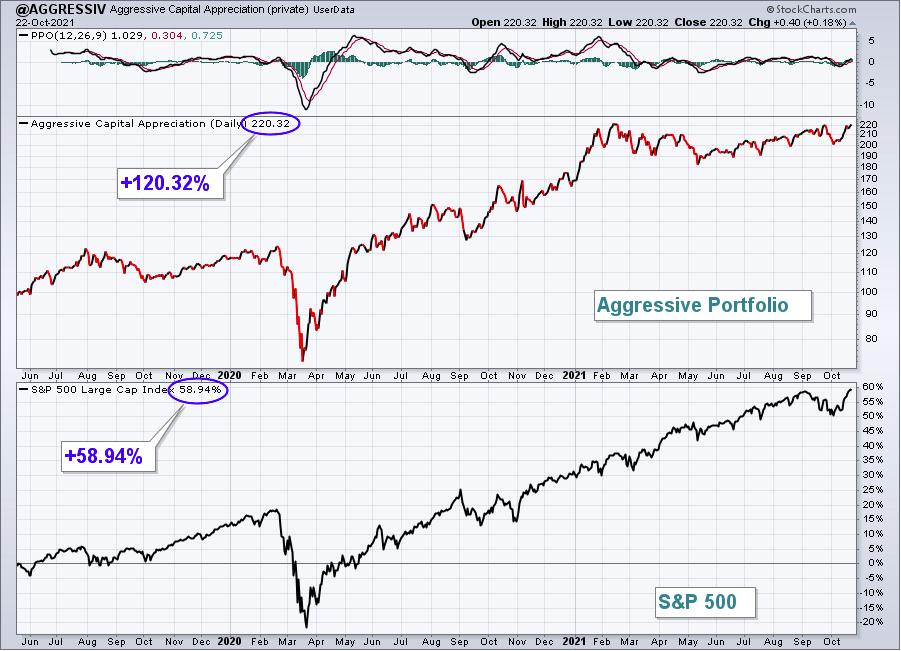
Here are how the Aggressive portfolio component stocks performed last week:
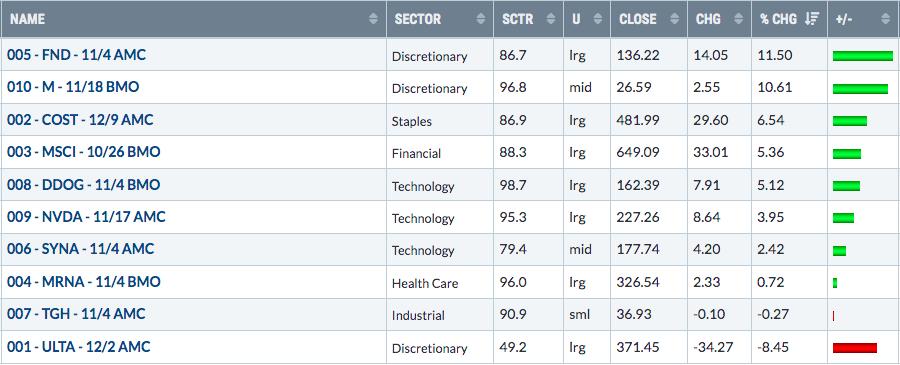
ULTA discussed its future growth rate and traders were unimpressed leading to a big selloff on Tuesday last week. I believe it was another opportunity to buy the stock, but there are two keys technically going forward. The first will be ULTA's price reaction if it hits its 20-day EMA and the second will be whether price support holds on any further weakness:
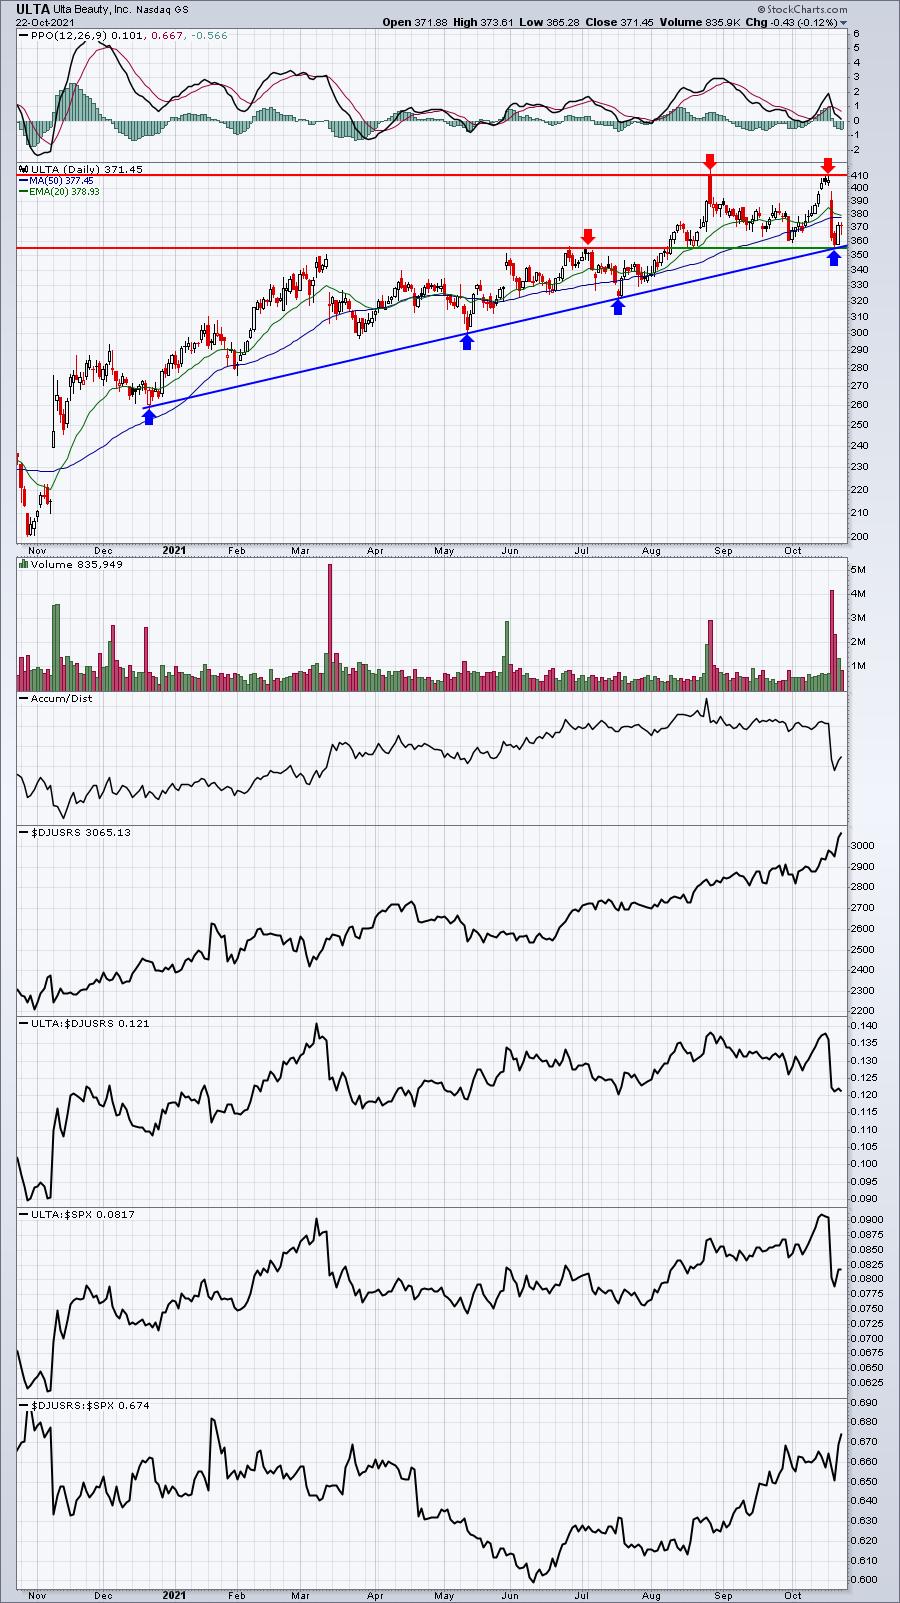
There was a ton of selling last week on ULTA and volume was extremely heavy, but I don't believe critical price support was ever lost. Price and trendline support intersect close to 355 and buyers returned at that level.
Income Portfolio:
The Income Portfolio rose 2.13%, gaining ground on the S&P 500. Here's the updated inception-to-date chart of the portfolio:
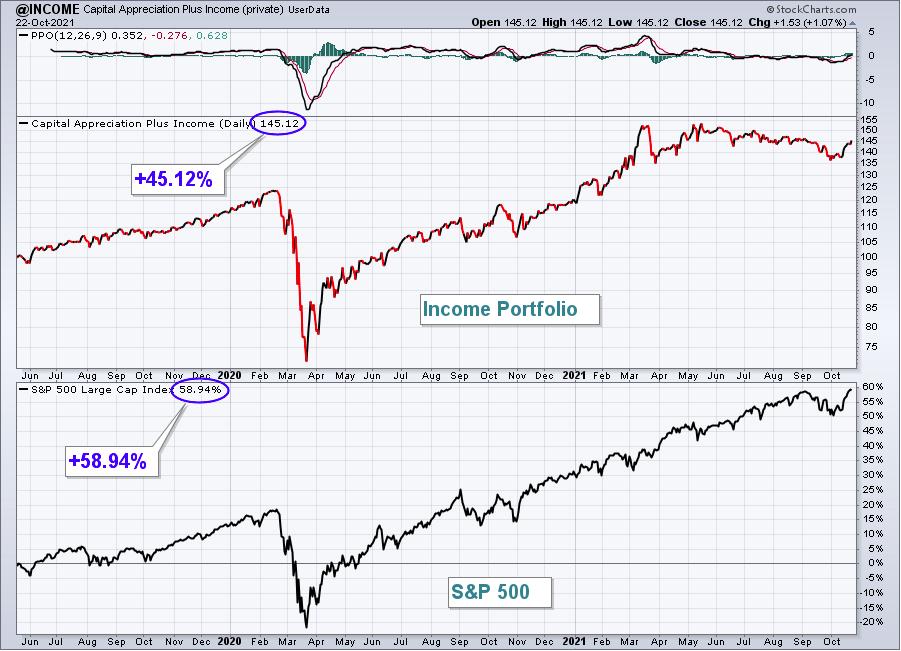
Here are how the Income portfolio component stocks performed last week:
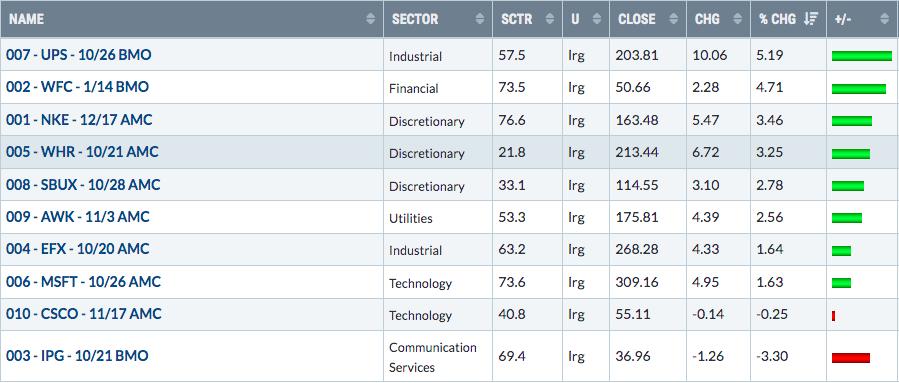
IPG reported quarterly results last week, easily surpassing Wall Street's consensus estimates for both revenues and EPS. They also boosted their revenue and EPS outlook as well. Despite this solid report and guidance, IPG failed to breakout and remains range-bound for now. Here is the trading range to keep an eye on:
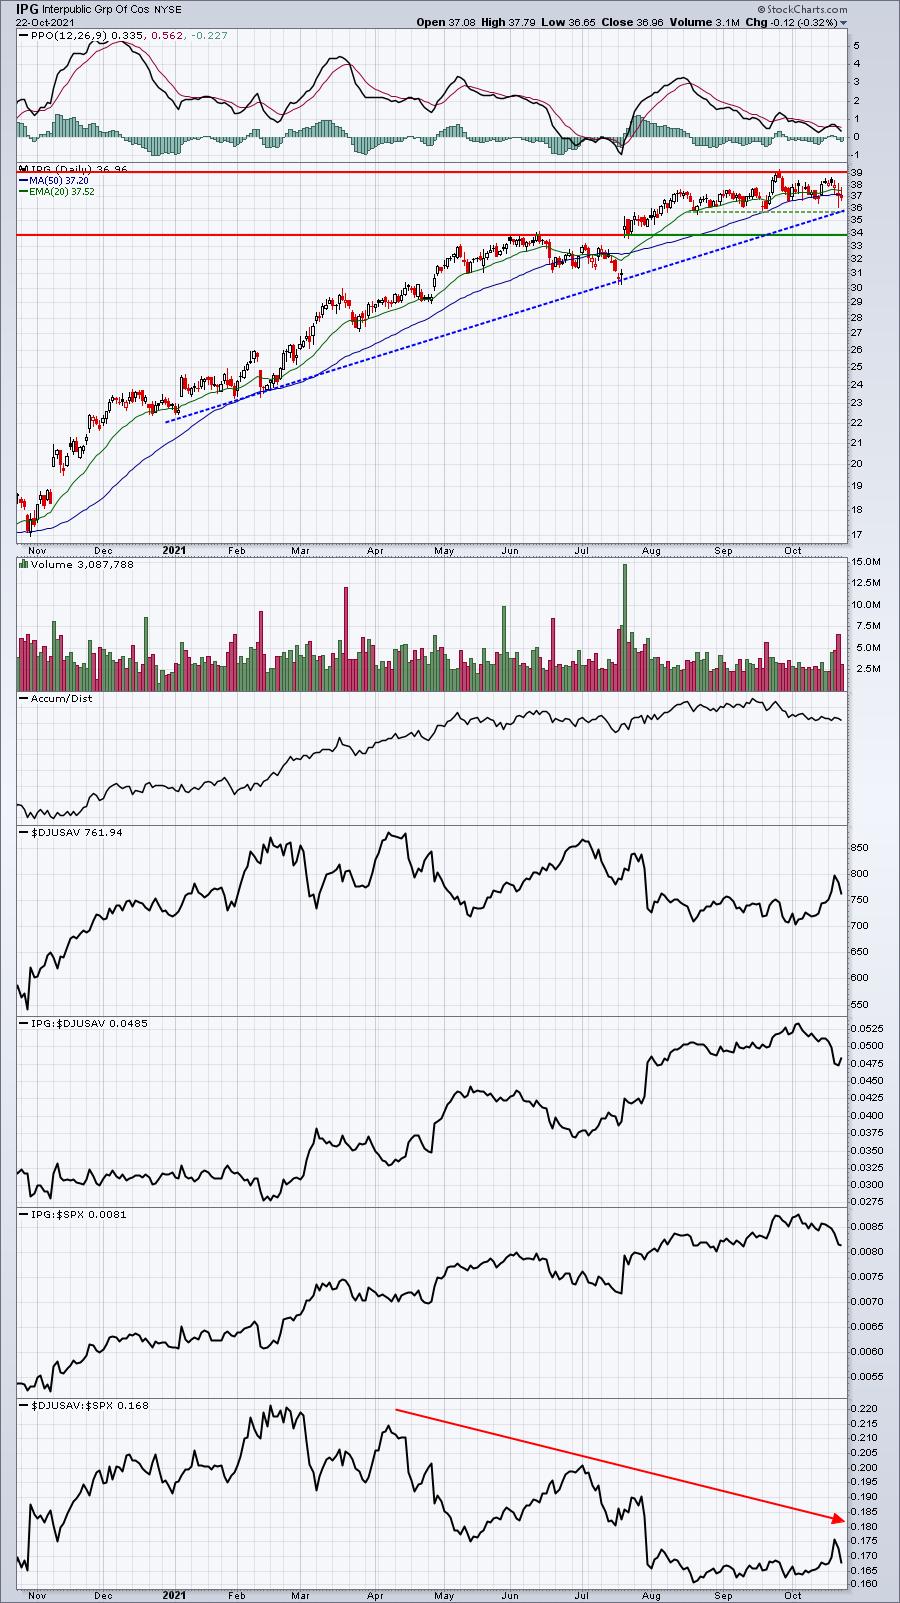
I think the biggest problem with IPG right now is its peer group. Media agencies ($DJUSAV) can't seem to sustain any relative momentum, which played a key role in IPG's lack of a bullish earnings-related response. I still see an uptrend here, however, and consider weakness to the support levels identified above as buying opportunities.
Strong AD Portfolio:
The Strong AD Portfolio climbed 1.75%, edging the S&P 500. Here's the updated inception-to-date chart of the portfolio:
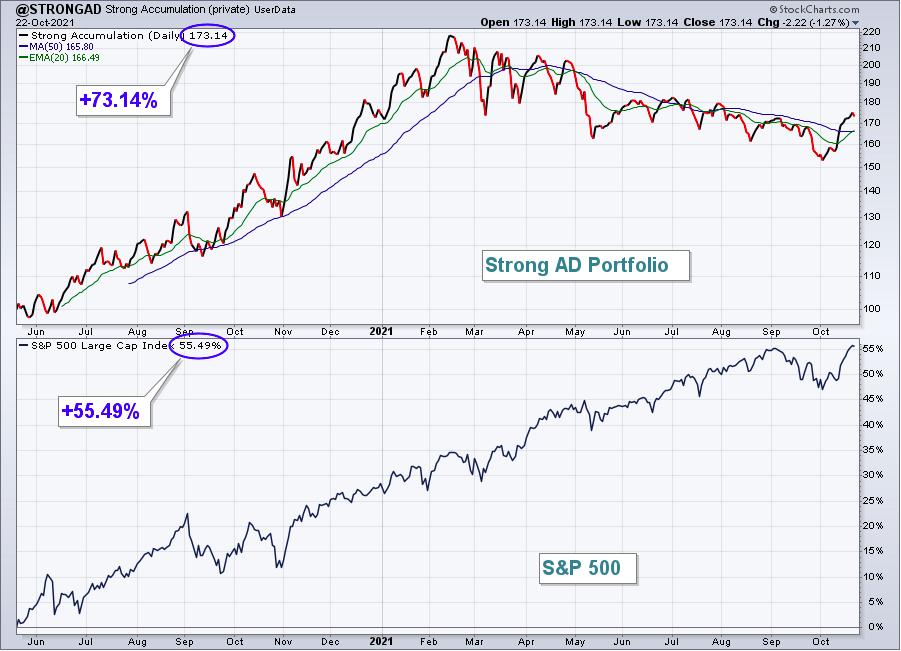
Here are how the Strong AD portfolio component stocks performed last week:
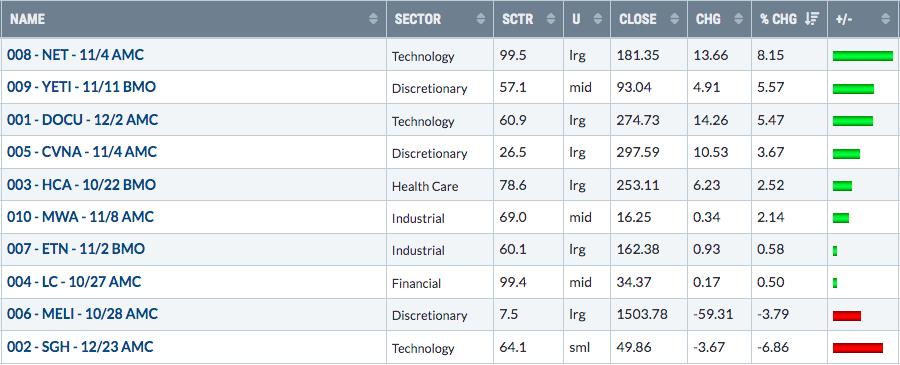
SGH was the big loser in this portfolio last week, but it's actually reached a key support area where I could see a bounce and possibly a resumption in its uptrend:
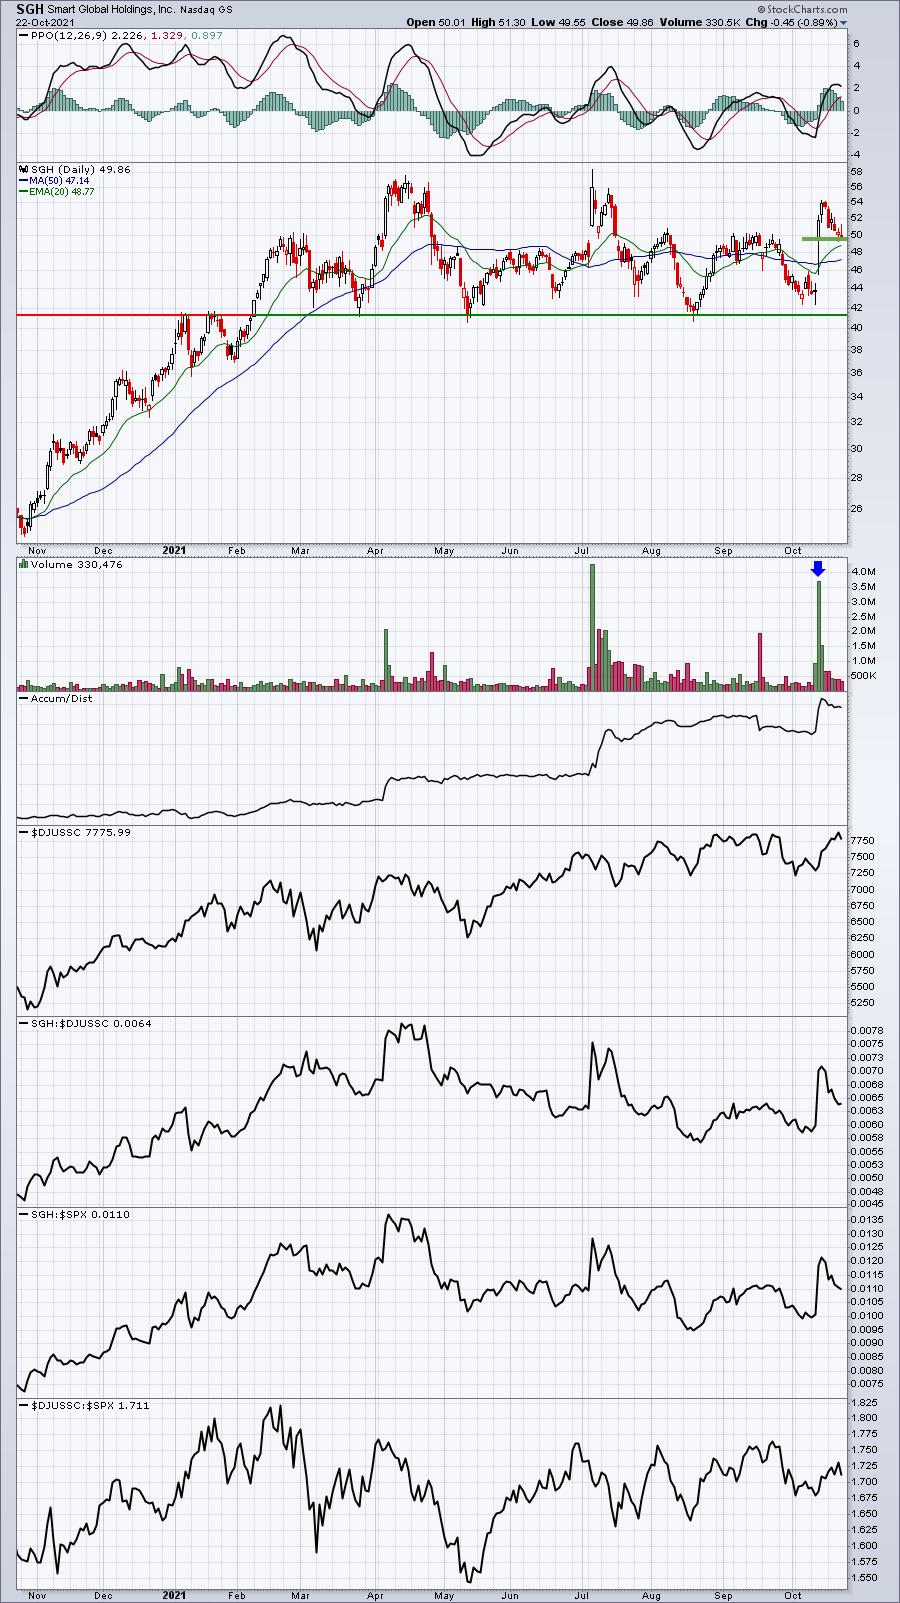
SGH saw massive volume accompany its earnings-related gap higher on October 13th. It opened at 49.70 that day before climbing to 54.25 the very next day. Over the past six days, the volume has tailed off considerably as SGH has returned to test that 49.70 level. I'm looking for SGH to turn higher right here. Failure to do so would raise the odds of SGH returning back to its more critical price support level near 41. I don't believe it goes back down there, but there's certainly that possibility. The rising 20-day EMA, currently at 48.77, would be another key short-term support area to watch.
Earnings Reaction Portfolio:
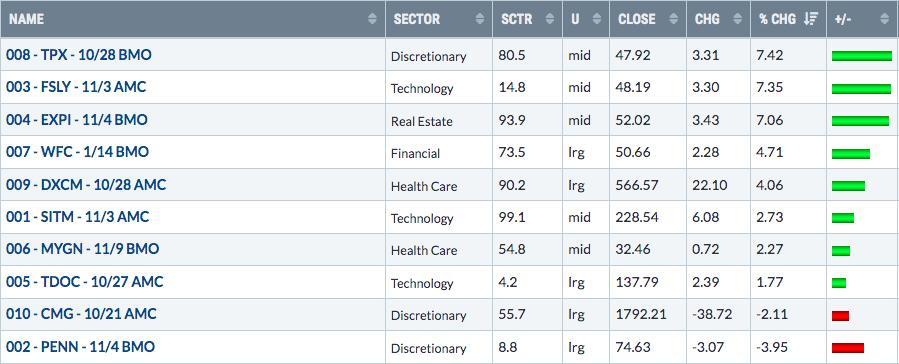
The Earnings Reaction Portfolio gained 3.11%, quietly building a nice advantage over the S&P 500. Here's the updated inception-to-date chart of the portfolio:
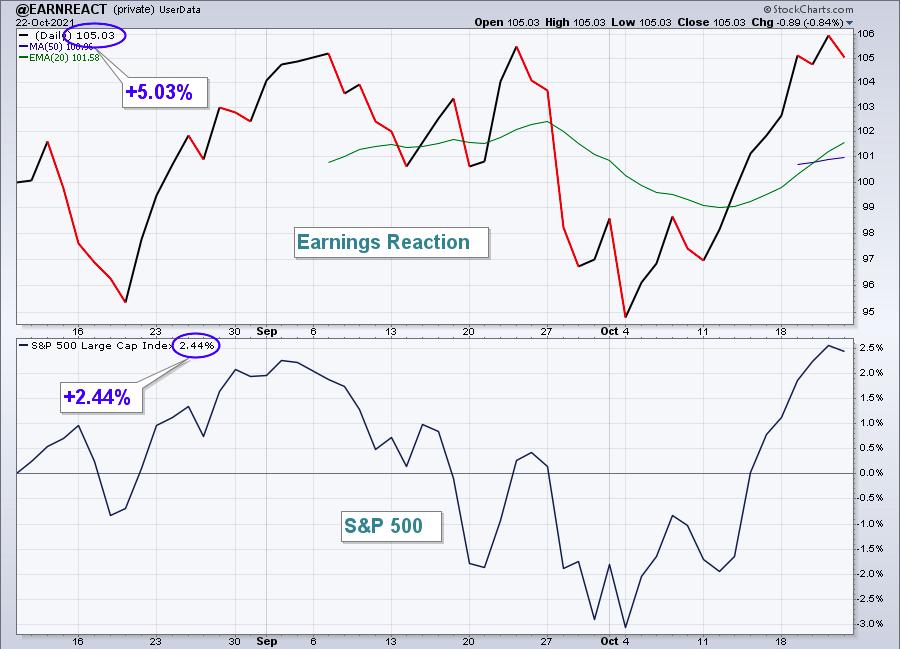
Here are how the Earnings Reaction portfolio component stocks performed last week:
Summary
The upcoming week could prove difficult as our short-term hourly charts show signs of momentum issues (negative divergences) just about everywhere. I wrote an article in my Trading Places blog on Saturday after reviewing dozens of charts. If you didn't have a chance to read that article, "U.S. Equities Have One VERY Serious Short-Term Problem", you can do so by clicking on the link.
Negative divergences on an hourly chart tend to take care of themselves over 1 to 3 day periods, which just so happens to coincide with October 25th through October 27th, the final 3 days of the worst historical period of the year on the S&P 500 since 1950. The October 22nd through October 27th period has produced annualized returns of -43.42%. Not good. And the NASDAQ is even worse. Over the same six day period, the NASDAQ has produced annualized returns of -64.74% since 1971. This historical weakness, together with the negative divergences, argues for downward price action to start this week. As always, this guarantees us absolutely nothing. The market may take off as it's flirting with breakouts on the Dow Jones and S&P 500. But the most important element of successful trading involves managing risk. Given what I see on the horizon, I'd be careful this week. That might mean building extra cash for some, being totally in cash for others, possibly selling calls against stock positions, buying put insurance, etc. There's no right or wrong answer here. It simply comes down to how much risk you're willing to take. Again, I'm VERY BULLISH the U.S. stock market. Short-term, however, we have issues to address.
Model ETF Portfolio
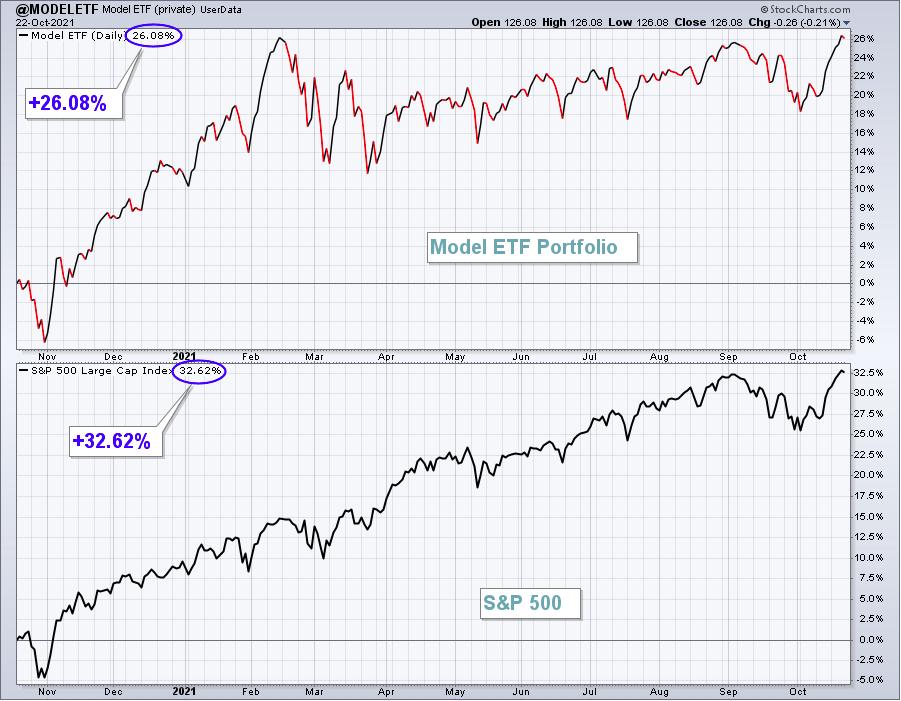
Our Model ETF Portfolio rose 2.05% last week, beating the S&P 500 last week.
Here's the updated inception-to-date chart of the Model ETF Portfolio:
Here are how the Model ETF Portfolio component ETFs performed last week:
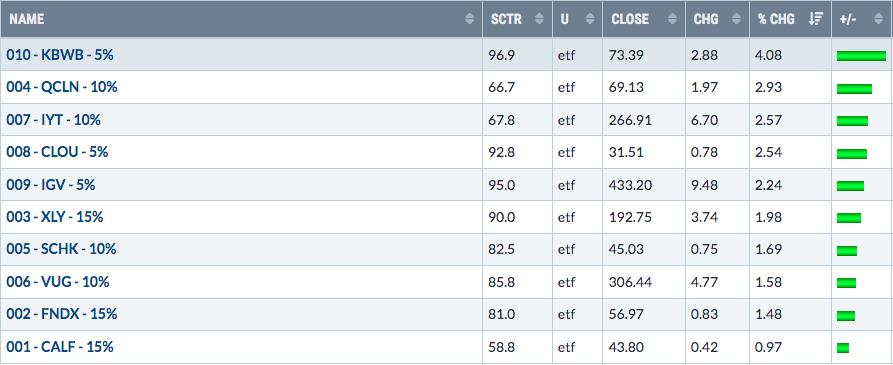
These are the one week results of the NEW Model ETF Portfolio, the ETFs of which were "drafted" at Tuesday, October 19th's close. The OLD Model ETF Portfolios were held on Monday and Tuesday of last week, but their results are not reflected above.
Happy trading!
Tom Bowley, Chief Market Strategist
EarningsBeats.com
"Better timing. Better trades."