
EB Weekly Portfolio Report - Sunday, November 7, 2021
Upcoming Earnings Reports
According to Zacks.com, the following companies will be reporting earnings this week and each is a component of one of our portfolios:
Monday, November 8: MWA
Tuesday, November 9: None
Wednesday, November 10: None
Thursday, November 11: YETI
Friday, November 12: None
PLEASE NOTE: The above companies were provided after scanning the Zacks Earnings Calendar. My research is limited to what Zacks provides and I also can make a mistake from time to time, so please check for earnings dates for all companies that you own. We do hold our portfolio stocks through one earnings report, but every EarningsBeats.com member must make his/her own investing/trading decisions about holding stocks into earnings reports as it's the most volatile (risky) time to own a stock.
ALSO: WE HAVE "ORIGINAL" EXPECTED EARNINGS DATES POSTED NEXT TO EACH STOCK SYMBOL IN OUR VARIOUS PORTFOLIO CHARTLISTS. I UPDATED THOSE EXPECTED DATES RECENTLY AND MANY OF THEM CHANGED SINCE THOSE ORIGINAL EXPECTED EARNINGS DATES, SO PLEASE BE AWARE OF THAT. YOU WILL SEE THOSE UPDATED EARNINGS DATES BELOW IN THE SUMMARY FOR EACH PORTFOLIO. IF YOU RE-DOWNLOAD OUR PORTFOLIOS FROM OUR WEBSITE, THE UPDATED EARNINGS DATES WILL AUTOMATICALLY APPEAR. AGAIN, I JUST WANT EVERYONE TO KNOW THAT MANY OF THESE EXPECTED EARNINGS DATES CHANGED IN RECENT WEEKS. PLEASE BE SURE TO DOUBLE CHECK EARNINGS DATES FOR ANY STOCKS THAT YOU HOLD.
Portfolio Rules and Objectives
Here are the common traits and objectives of our portfolios:
- There are 10 leading stocks from up to 10 leading industries in each portfolio (at the time of selection). Generally, there will only be one stock per industry group, but there could be exceptions.
- They are held for an entire 90-day period, with no stops in place. We strive for consistency, transparency, and simplicity in our portfolios. EB.com members may hold these stocks for the entire 90 days, trade them, use stops, etc., but for purposes of our calculation, we will make no exceptions to our "buy and hold for three months" strategy.
- Every stock will generally be held through ONE earnings report
- The expectation is that relative winners will carry the portfolio to outperformance
- They were all entered into as of the close on Thursday, August 19th; members may choose to try to time better entries, but EB.com "purchased" as of August 19th's closing price
- Primary objective is to outperform the benchmark S&P 500
Here are several considerations for EB members:
- I would expect the Strong AD and Aggressive portfolios to be the riskiest, followed by the Model portfolio, and then the Income portfolio
- The Strong AD portfolio will be selected from a combination of rising accumulation/distribution lines and SCTRs above 70 at the time of selection. It is the only portfolio that does NOT require a revenue and EPS beat in its most recent quarterly earnings report
- The Income portfolio stocks will all pay dividends, with the expected average dividend yield to be at least 1.0%
- Drawdowns (losses) should be much milder on the Income portfolio, with more volatility expected on the other three; please review inception-to-date charts below to gain an idea of the volatility associated with each
- I believe the larger drawdown on the Income portfolio at the beginning of the pandemic was an anomaly, occurring as many defensive, higher-yielding companies uncharacteristically underperformed during a market decline.
- Large drawdowns in the February through May period were due to the rapid rotation from growth stocks to value stocks; each quarter, our portfolios are based on themes and there is never a guarantee that our analysis and beliefs will be proven correct
- You should consider owning or trading these stocks in whatever manner is most comfortable for you; while we will buy all 10 stocks in the manner identified above, feel free to trade certain stocks or wait for pullbacks if the stocks are overbought
- We have no idea what risk each member is willing or able to take. We are not registered investment advisors so be sure you understand the risk you take. Please consult your financial advisor.
- EarningsBeats.com shareholders/employees may own all or some of the portfolio stocks from time to time.
Weekly Snapshot
Here's a weekly recap:
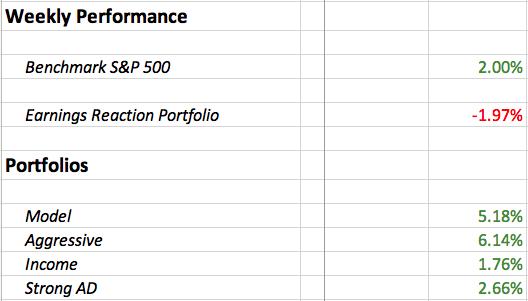
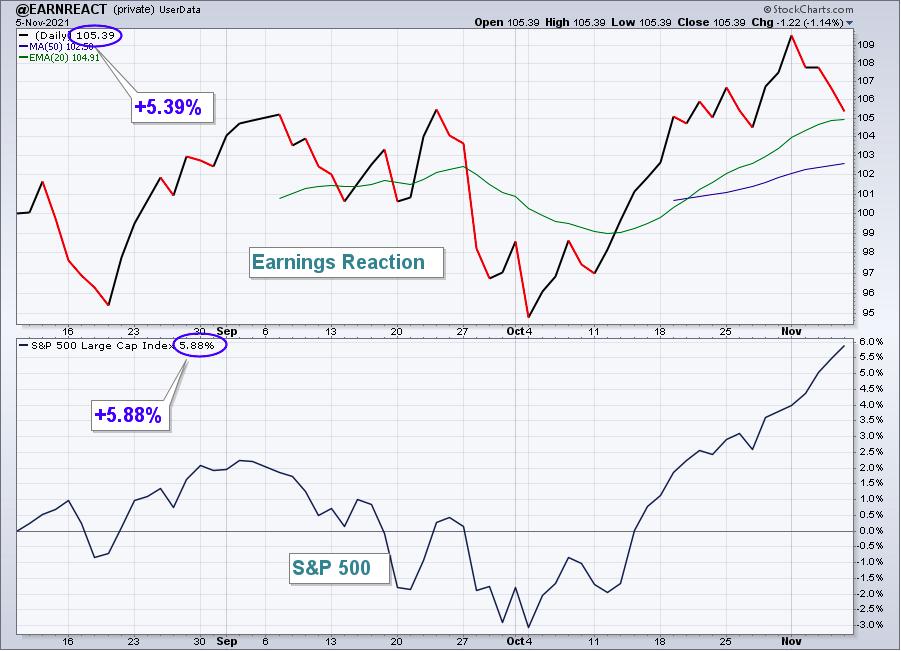
Our portfolios had a strong week, though our Earnings Reaction Portfolio struggled. With just a few days left in its inaugural quarter, it's fallen fractionally behind the S&P 500 return, +5.39% vs. +5.88%. We'll be drafting 10 new stocks for this portfolio on Wednesday after the closing bell. Be sure to join me or check out the recording.
Weekly Summary
Benchmark S&P 500:
We survived the biggest earnings week of the quarter. In fact, many of our portfolio component stocks posted excellent quarterly reports and were rewarded with very bullish market reactions. But the true strength for U.S. equities came in the form of breakouts in all of our major indices to fresh all-time highs. It took awhile, but both transportation stocks ($TRAN) and small cap stocks ($SML) joined the all-time high party as well. Wide participation is critical to extended secular bull market rallies, because shorts literally have nowhere to turn.
While our major indices were higher in the 2-3% range last week, small caps surged 6.49%, while transports jumped 5.89%. Clearly, money was rotating and chasing those two areas. This fits with typical seasonal behavior as both of these areas tend to outperform during the month of November. The good news is that we're only one week into this month.
Model Portfolio:
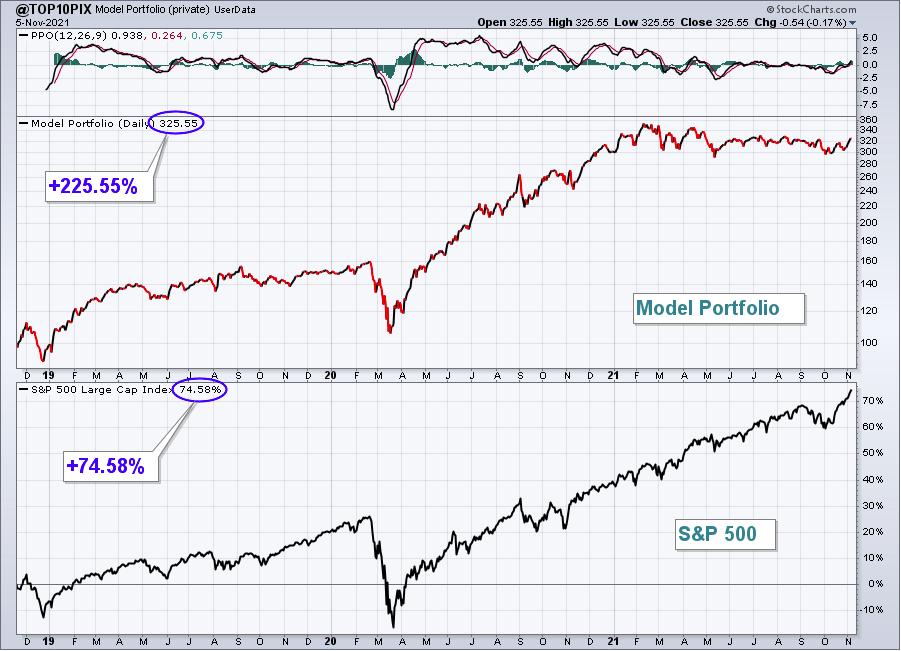
The Model Portfolio spiked 5.18%, outdistancing the S&P 500 and trying to make up ground. Here's the updated inception-to-date chart of the portfolio:
Here are how the Model portfolio component stocks performed last week:
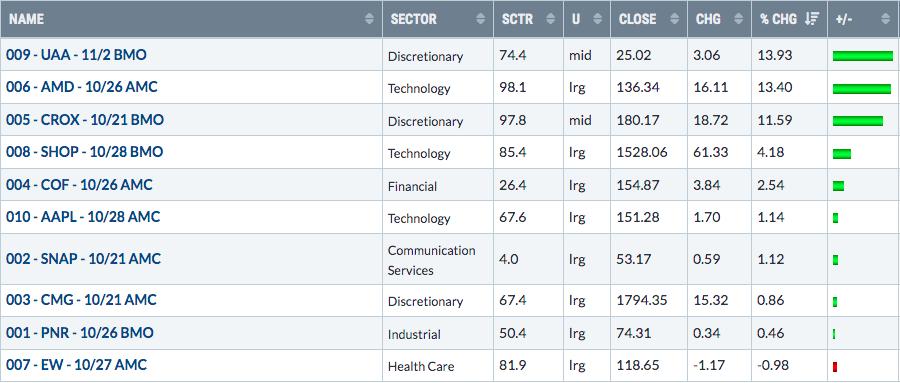
It seems like nearly every earnings reaction has been negative in this portfolio, which is unusual based on the history of our portfolios. But for one week, the tables turned. UAA reported its quarterly results last week and the market reaction was quite positive:
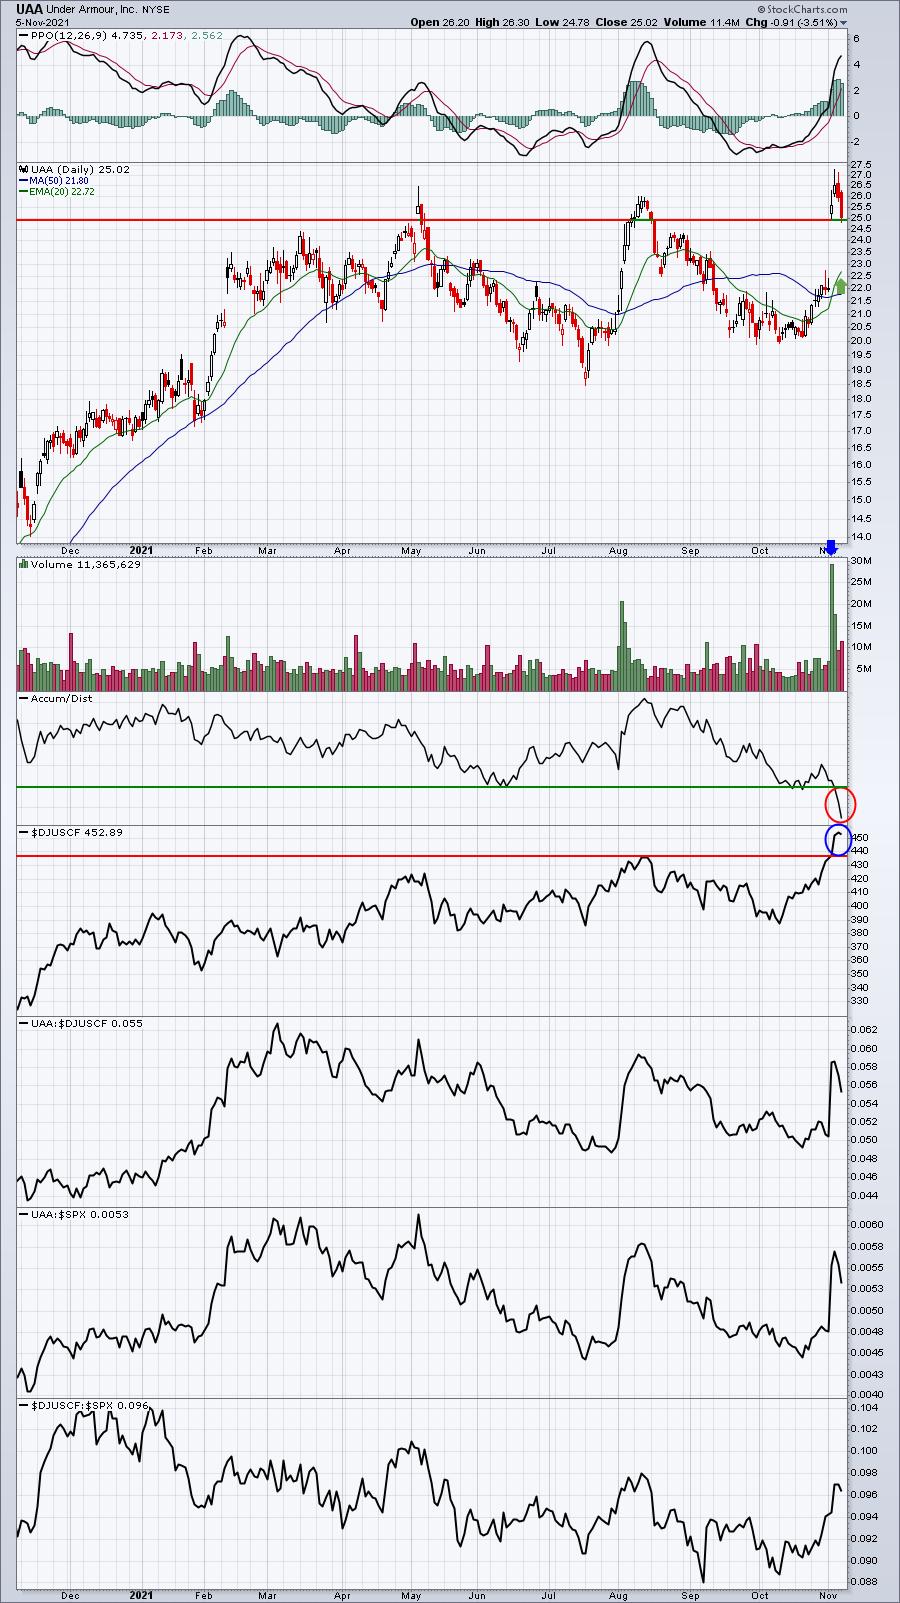
UAA benefited from a breakout in its industry group, as well as a strong earnings report. It crushed earnings estimates and raised forward guidance.
Aggressive Portfolio:
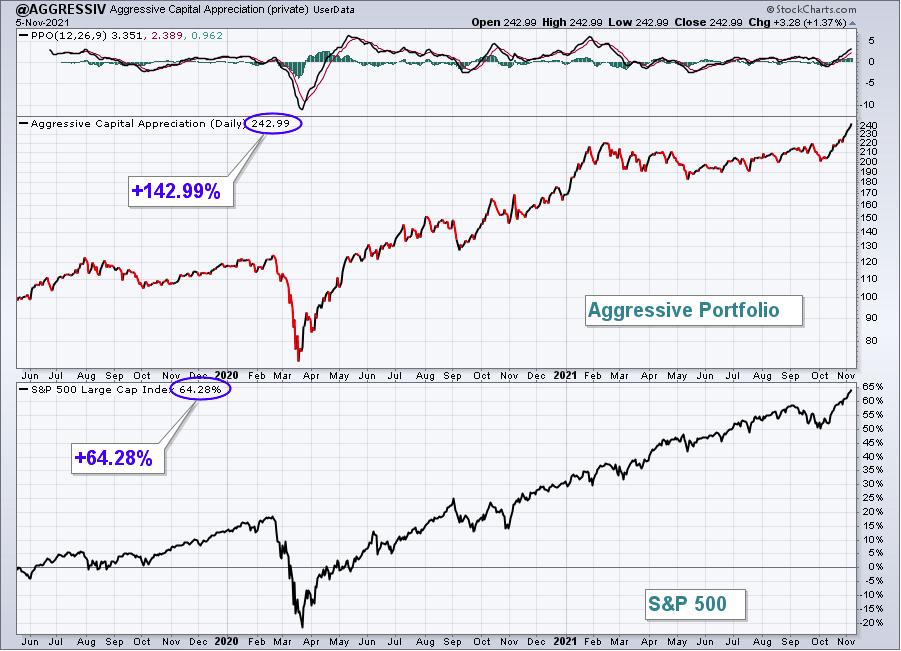
The Aggressive Portfolio surged 6.14%, further separating from the benchmark's return. Here's the updated inception-to-date chart of the portfolio:
Here are how the Aggressive portfolio component stocks performed last week:
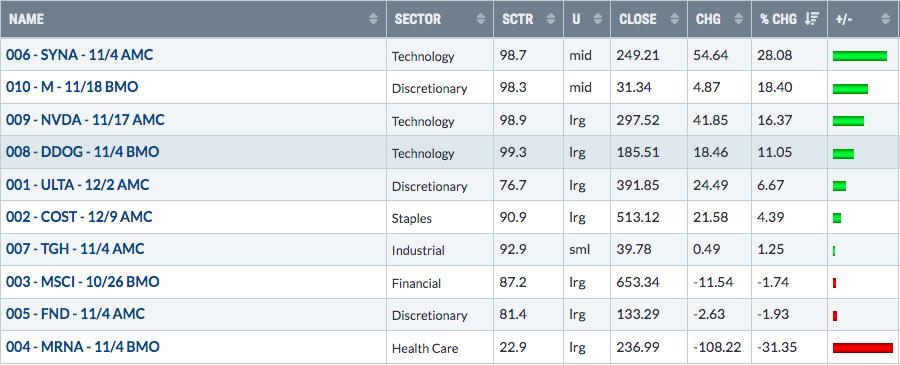
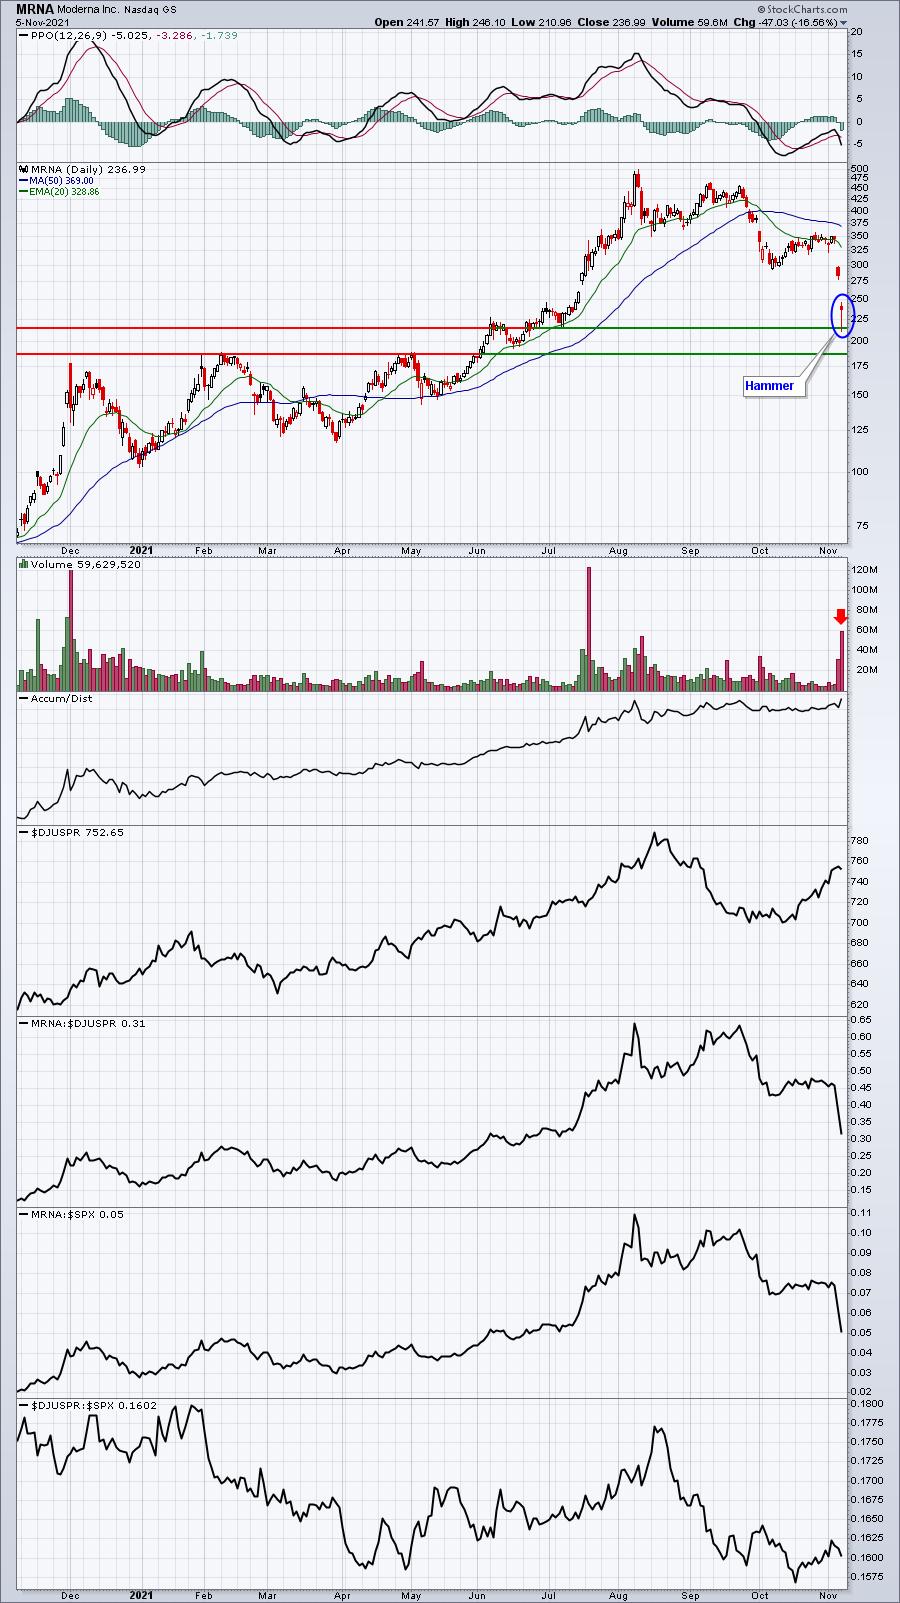
I included a chart of SYNA last week and suggested blowout earnings were likely on the way and that's exactly what we saw. However, MRNA was on the other side of the earnings reaction, getting hammered last week after falling short of both revenue and EPS estimates AND reacting to Pfizer's positive data from its COVID-19 oral antiviral treatment. Traders mostly ignored the $1 billion share buyback, which honestly is quite small relative to the company's market cap. While I'd expect further selling ahead, MRNA did print a hammer on Friday. We'll see if that helps to change the stock's short-term direction:
Income Portfolio:
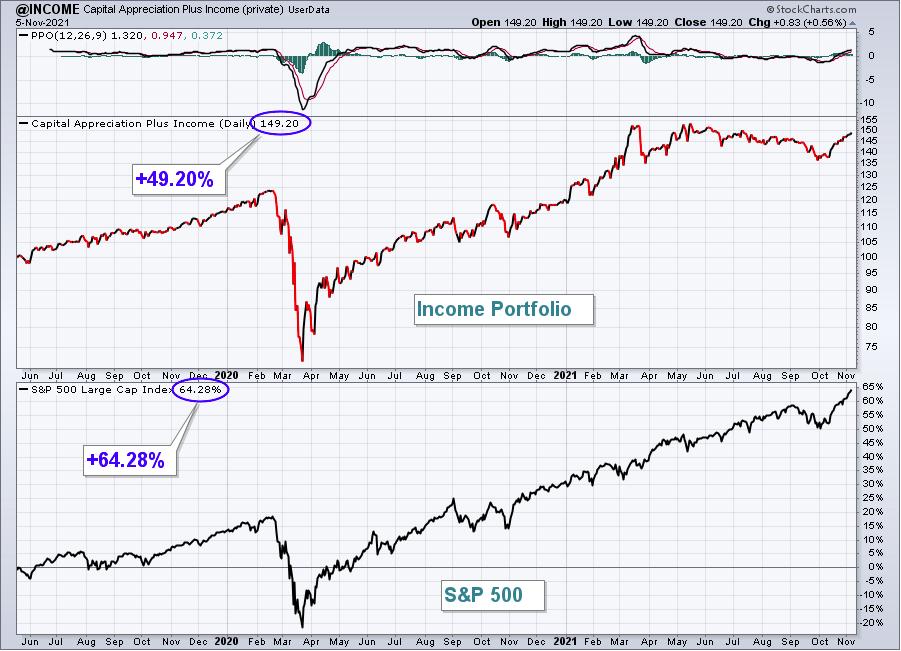
The Income Portfolio rose 1.77%, but still trailed the S&P 500 slightly. Here's the updated inception-to-date chart of the portfolio:
Here are how the Income portfolio component stocks performed last week:
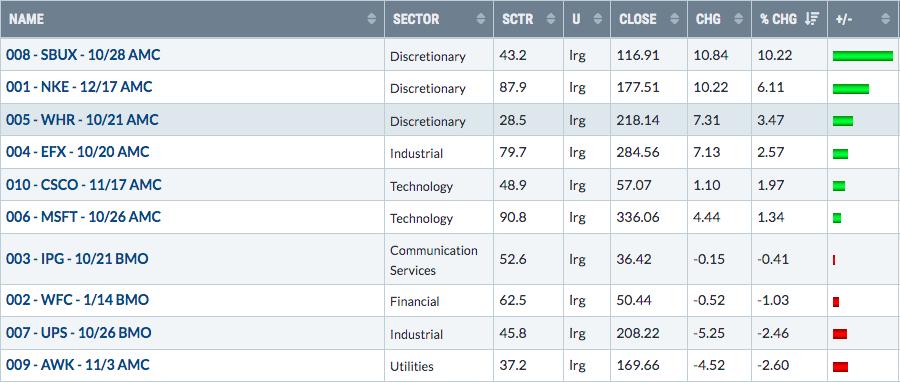
NKE, after struggling significantly throughout September, has rebounded nicely over the past 5 weeks, breaking to fresh new highs. Note its AD line is also on the verge of breaking, which is a bullish sign.
Strong AD Portfolio:
The Strong AD Portfolio climbed 2.66% last week, slightly outperforming the S&P 500. Here's the updated inception-to-date chart of the portfolio:
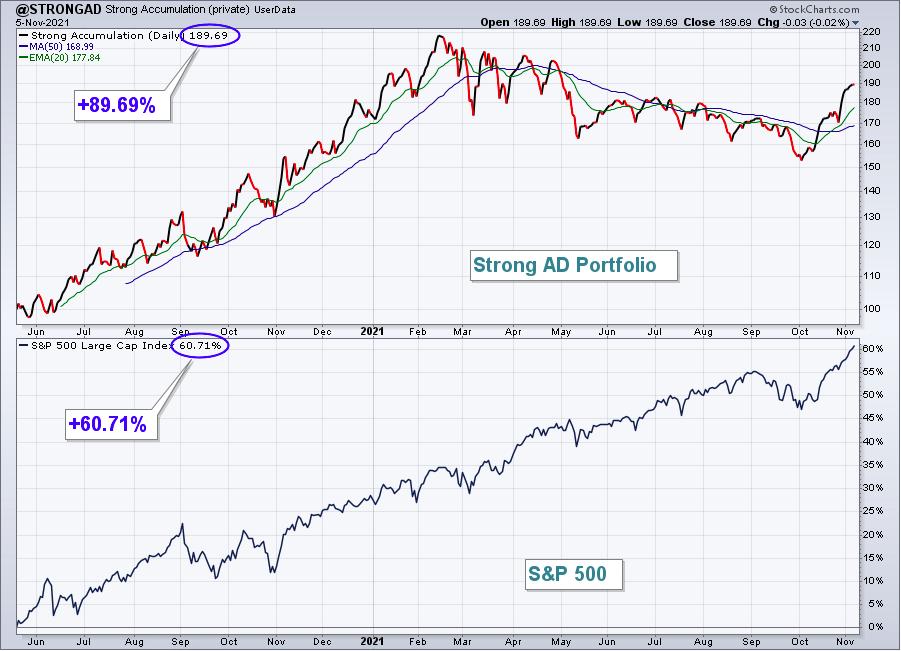
Here are how the Strong AD portfolio component stocks performed last week:
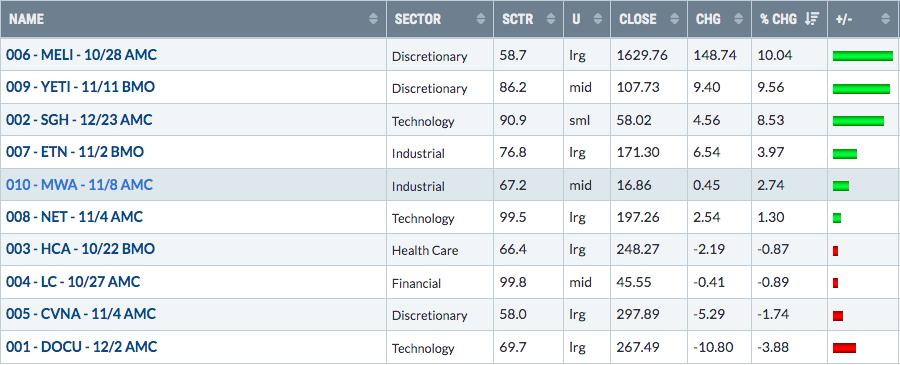
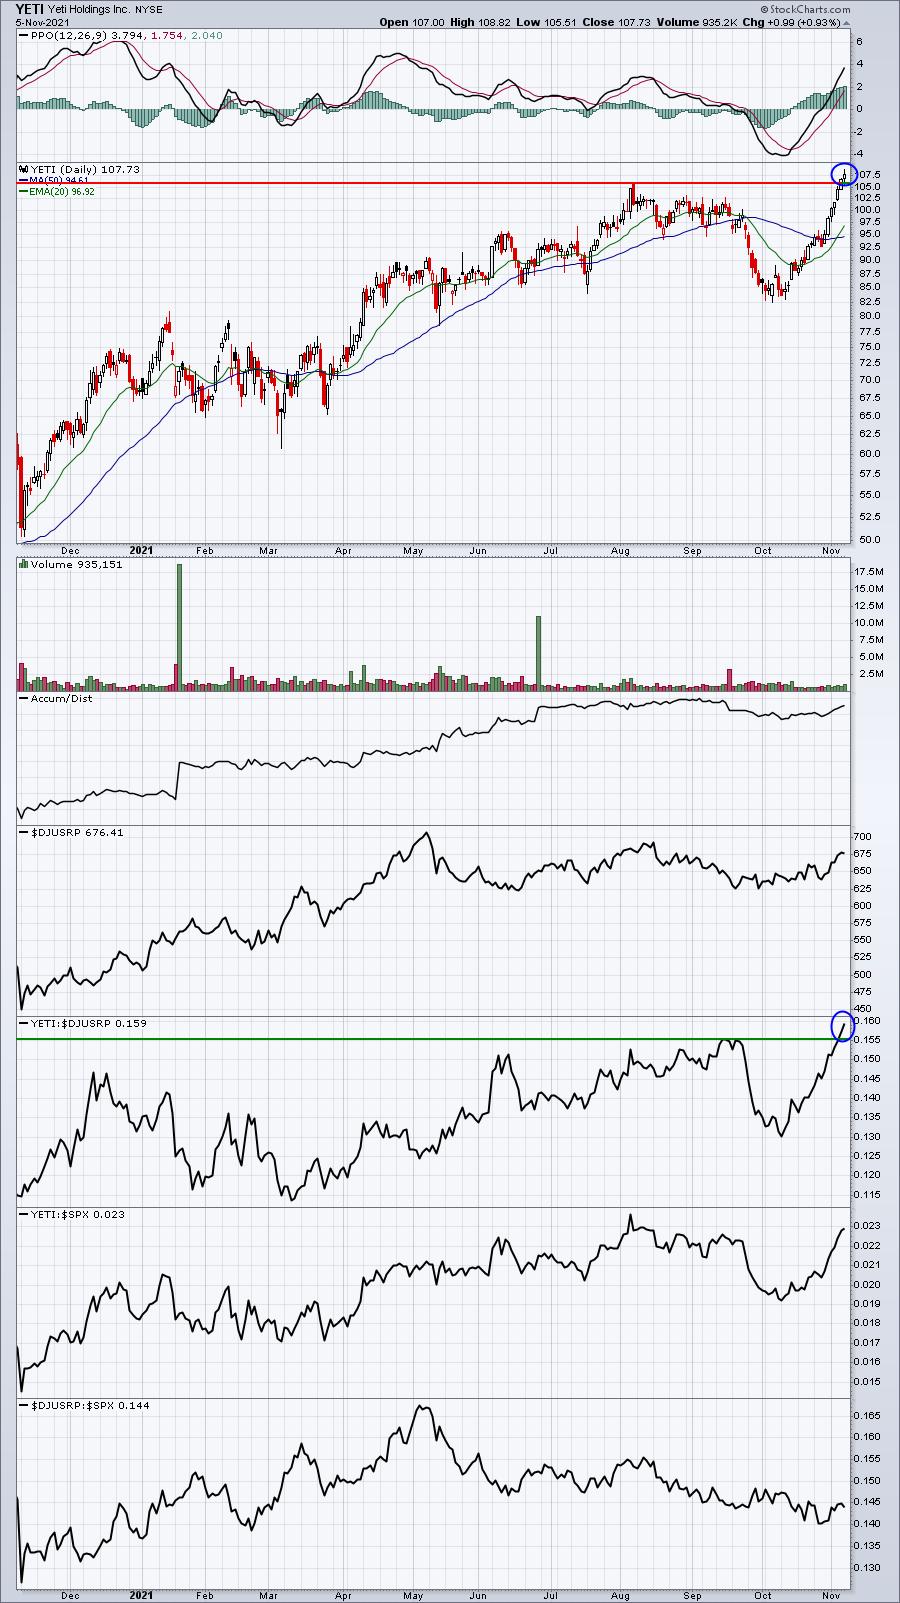
YETI's move last week was notable as it broke to a fresh all-time high and also broke out vs. its recreational products peers ($DJUSRP) a week ahead of its earnings report. I'd view YETI similar to SYNA. I believe it's setting up for a blowout earnings report this week:
Earnings Reaction Portfolio:
The Earnings Reaction Portfolio lost 1.97%, giving up its relative advantage vs. the S&P 500. Here's the updated inception-to-date chart of the portfolio:
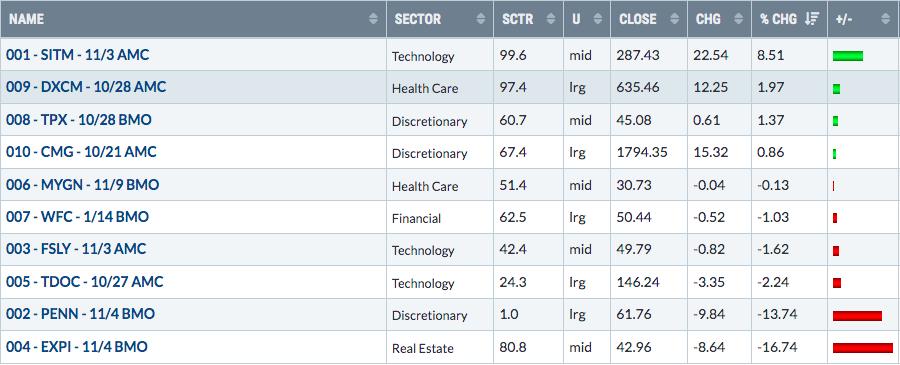
Here are how the Earnings Reaction portfolio component stocks performed last week:
Summary
Well, we have two more weeks before our next "draft" of portfolio stocks in the Model, Aggressive, Income, and Strong AD Portfolios. The Model Portfolio has a bit more ground to make up vs. the S&P 500, but it's been a stellar quarter thus far for both our Aggressive and Strong AD Portfolios. Growth stocks have returned to favor and that has no doubt helped our portfolios as we have generally have a concentration of growth stocks. Here's the latest growth vs. value (IWF:IWD) update:
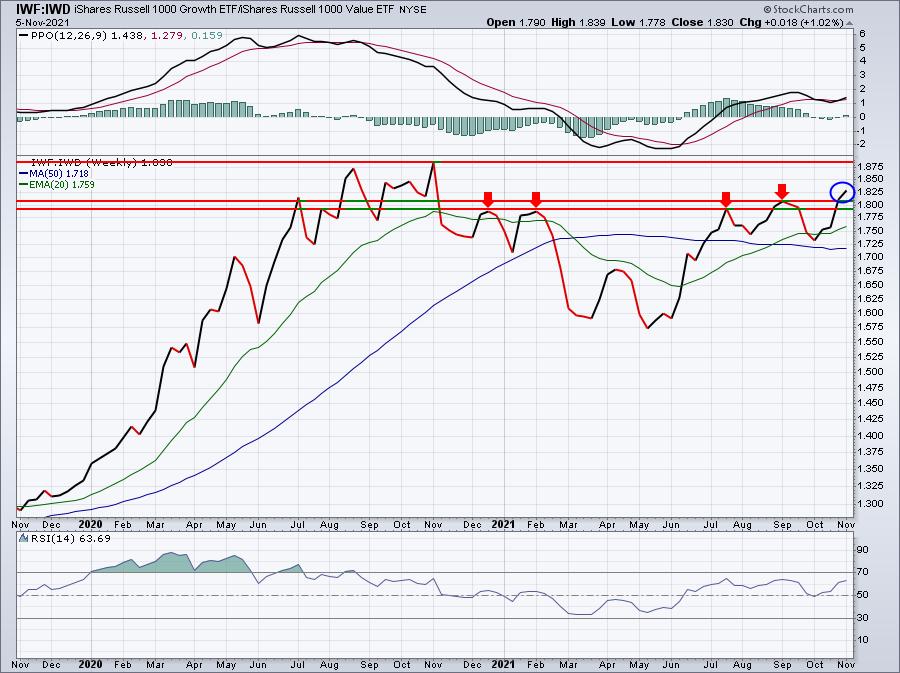
I expect we'll continue to see this ratio mostly climb higher - at least until we see a test of relative resistance near the 1.88 level.
Model ETF Portfolio
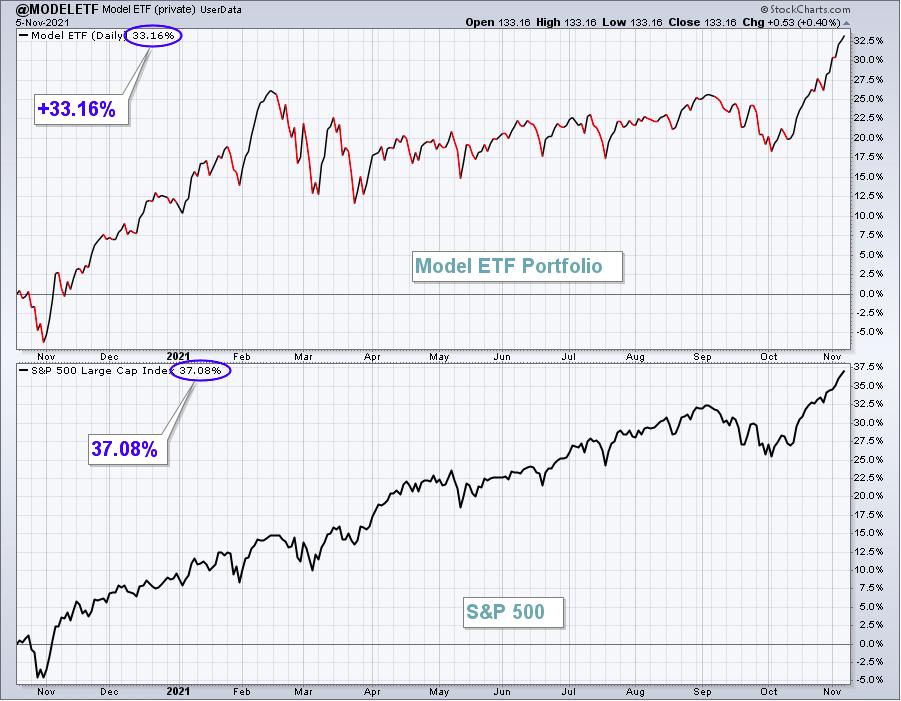
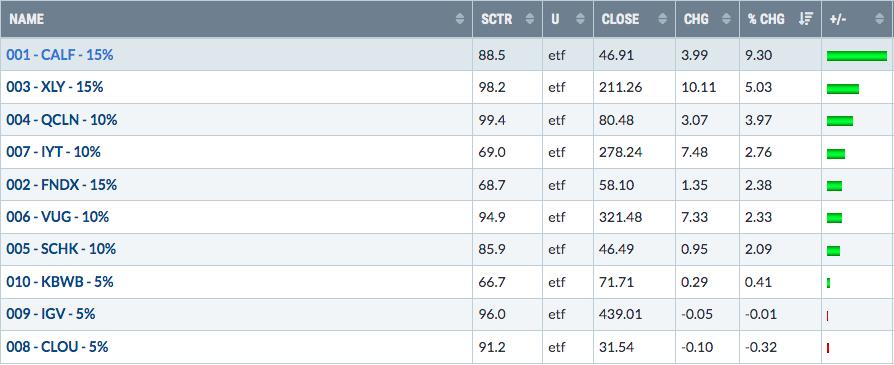
Our Model ETF Portfolio rose 3.62% last week, cruising past the S&P 500's 2.00% return.
Here's the updated inception-to-date chart of the Model ETF Portfolio:
Here are how the Model ETF Portfolio component ETFs performed last week:
Happy trading!
Tom Bowley, Chief Market Strategist
EarningsBeats.com
"Better timing. Better trades."