
EB Weekly Portfolio Report - Sunday, December 12, 2021
Upcoming Earnings Reports
According to Zacks.com, the following companies will be reporting earnings this week and each is a component of one of our portfolios:
Monday, December 13: None
Tuesday, December 14: None
Wednesday, December 15: None
Thursday, December 16: None
Friday, December 17: None
PLEASE NOTE: The above companies were provided after scanning the Zacks Earnings Calendar. My research is limited to what Zacks provides and I also can make a mistake from time to time, so please check for earnings dates for all companies that you own. We do hold our portfolio stocks through one earnings report, but every EarningsBeats.com member must make his/her own investing/trading decisions about holding stocks into earnings reports as it's the most volatile (risky) time to own a stock.
Portfolio Rules and Objectives
Here are the common traits and objectives of our portfolios:
- There are 10 leading stocks from up to 10 leading industries in each portfolio (at the time of selection). Generally, there will only be one stock per industry group, but there could be exceptions.
- They are held for an entire 90-day period, with no stops in place. We strive for consistency, transparency, and simplicity in our portfolios. EB.com members may hold these stocks for the entire 90 days, trade them, use stops, etc., but for purposes of our calculation, we will make no exceptions to our "buy and hold for three months" strategy.
- Every stock will generally be held through ONE earnings report
- The expectation is that relative winners will carry the portfolio to outperformance
- They were all entered into as of the close on Friday, November 19th; members may choose to try to time better entries, but EB.com "purchased" as of November 19th's closing price
- Primary objective is to outperform the benchmark S&P 500
Here are several considerations for EB members:
- I would expect the Strong AD and Aggressive portfolios to be the riskiest, followed by the Model portfolio, and then the Income portfolio
- The Strong AD portfolio will be selected from a combination of rising accumulation/distribution lines and SCTRs above 70 at the time of selection. It is the only portfolio that does NOT require a revenue and EPS beat in its most recent quarterly earnings report
- The Income portfolio stocks will all pay dividends, with the expected average dividend yield to be at least 1.0%
- Drawdowns (losses) should be much milder on the Income portfolio, with more volatility expected on the other three; please review inception-to-date charts below to gain an idea of the volatility associated with each
- I believe the larger drawdown on the Income portfolio at the beginning of the pandemic was an anomaly, occurring as many defensive, higher-yielding companies uncharacteristically underperformed during a market decline.
- Large drawdowns in the February through May 2021 period were due to the rapid rotation from growth stocks to value stocks; each quarter, our portfolios are based on themes and there is never a guarantee that our analysis and beliefs will be proven correct
- You should consider owning or trading these stocks in whatever manner is most comfortable for you; while we will buy all 10 stocks in the manner identified above, feel free to trade certain stocks or wait for pullbacks if the stocks are overbought
- We have no idea what risk each member is willing or able to take. We are not registered investment advisors so be sure you understand the risk you take. Please consult your financial advisor.
- EarningsBeats.com shareholders/employees may own all or some of the portfolio stocks from time to time.
Weekly Snapshot
Here's a weekly recap:
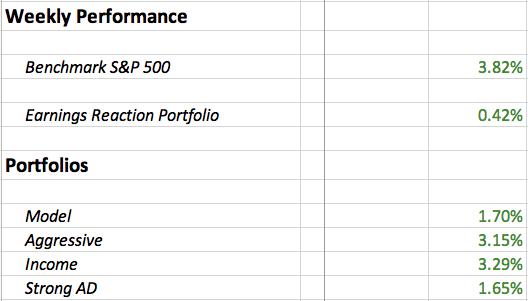
Weekly Summary
Benchmark S&P 500:
Friday's close of 4712.02 was the all-time high close and was a bit sneaky. I'm not sure if there's ever been an all-time high print on the S&P 500 in the same week that the Volatility Index ($VIX) traded in the 30s, but that's exactly what happened last week. And we're just six trading days removed from the VIX hitting its 11-month high of 35.32 on Friday, December 3rd. There was definitely more of a large cap and value feel to the move, however. For instance, the Dow Jones U.S. Small-Cap Growth Index ($DJUSGS) rose 2.61%, but remains 8-9% below its high from one month ago.
Technology (XLK, +5.90%) had a strong week, but its large cap components really carried the group. Apple (AAPL, +10.88%), for example, surged nearly 11% last week and Microsoft (MSFT, +6.05%) had a nice week as well. These two stocks account for almost 42% of the entire XLK. So yes, on the one hand, technology led last week's action, but we need to keep in mind that it was really two behemoths that put the entire sector on their backs. Following technology last week was energy (XLE, +3.81%), consumer staples (XLP, +3.66%), materials (XLB, +3.50%), and health care (XLV, +3.23%), which reflects more of the value leadership over the past week.
Model Portfolio:
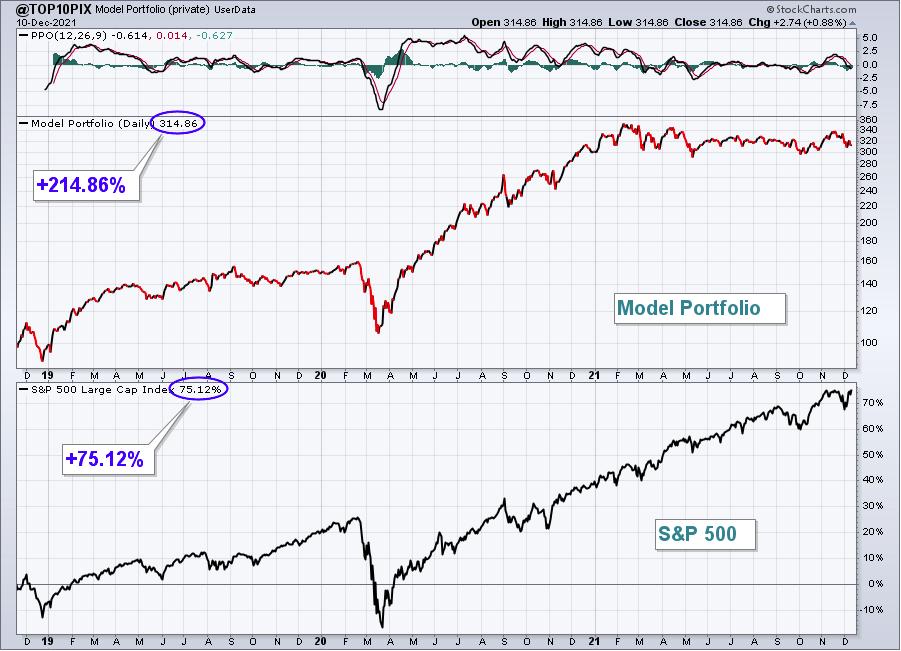
The Model Portfolio rose 1.70%, falling well short of the S&P 500. Here's the updated inception-to-date chart of the portfolio:
Here are how the Model portfolio component stocks performed last week:
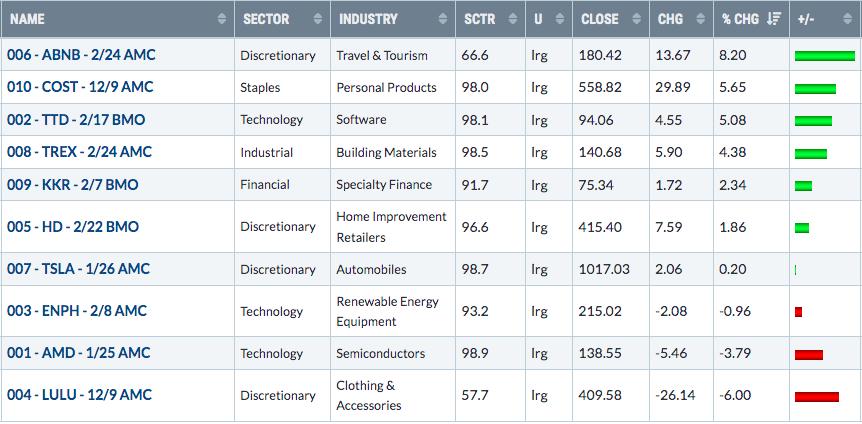
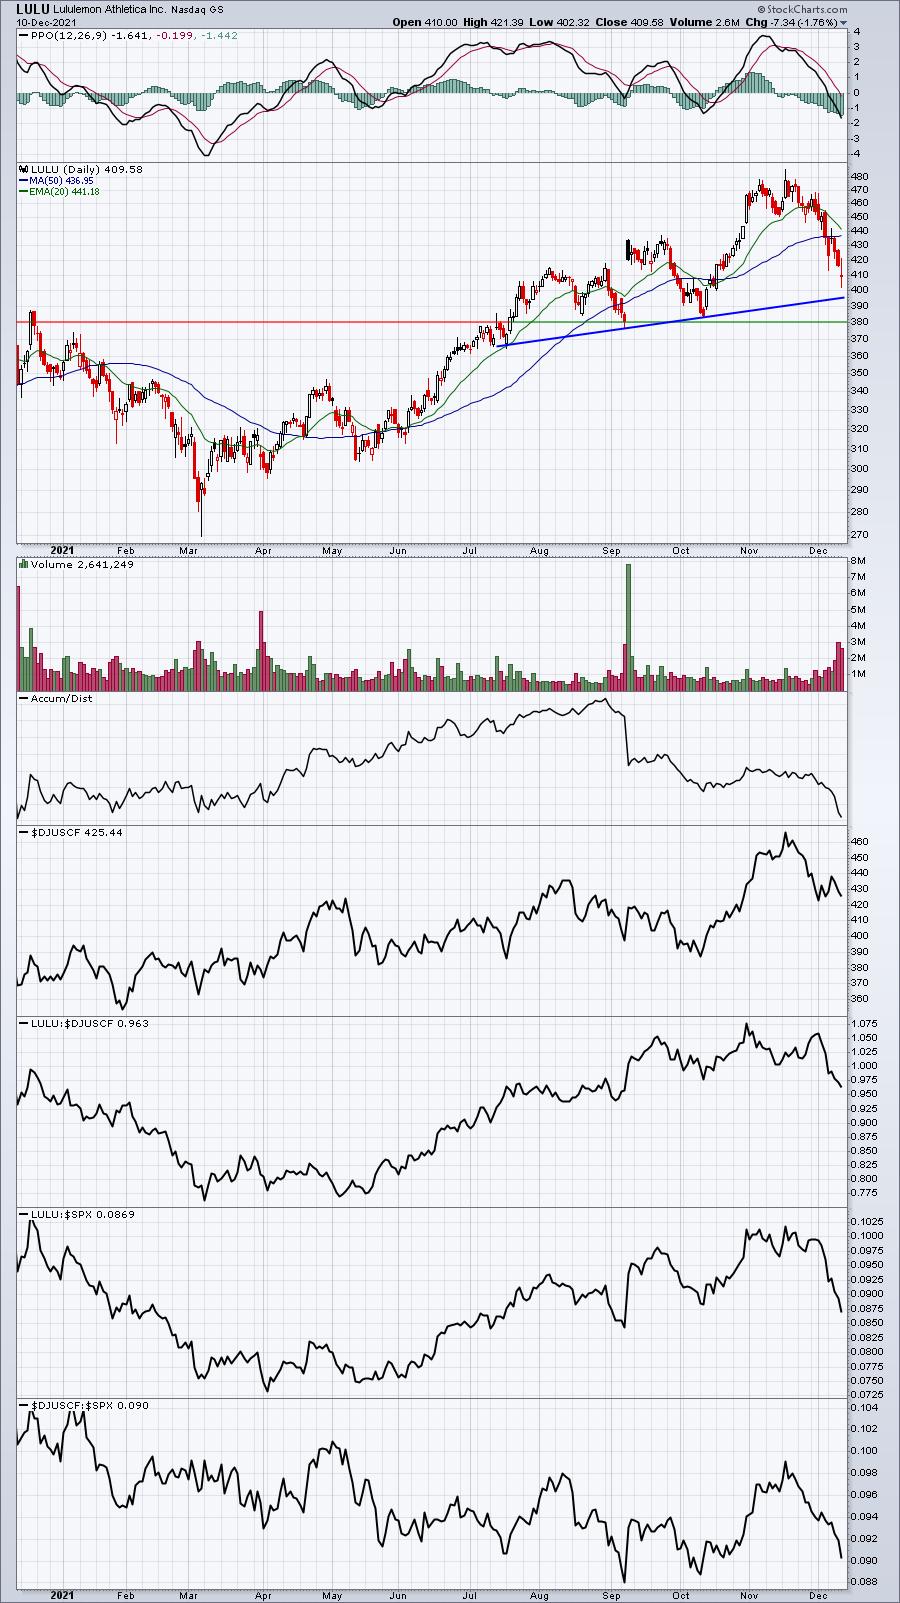
LULU reported its quarterly results last week and both revenues and EPS came in better than expected, but the company did slightly lower its revenue expectations for the upcoming quarter. Apparently, that's what Wall Street focused on short-term as LULU had a rough week and went against the market grain. LULU remains in an uptrend, however, and I fully expect to see the stock move higher into year end. The trend and price support levels that need to hold in order to maintain its uptrend are as follows:
Aggressive Portfolio:
The Aggressive Portfolio jumped 3.15%, slightly underperforming the S&P 500. Here's the updated inception-to-date chart of the portfolio:
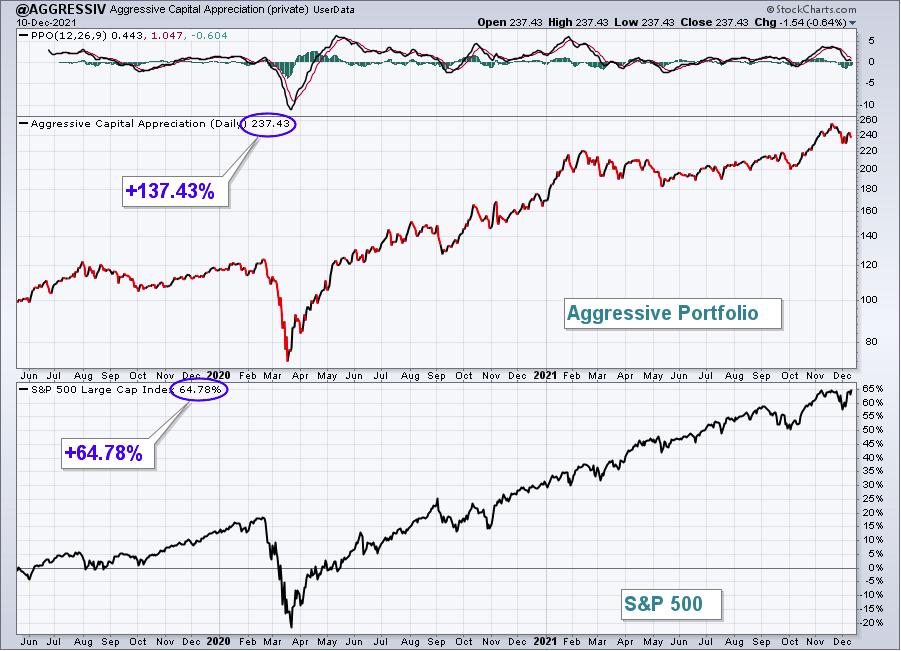
Here are how the Aggressive portfolio component stocks performed last week:
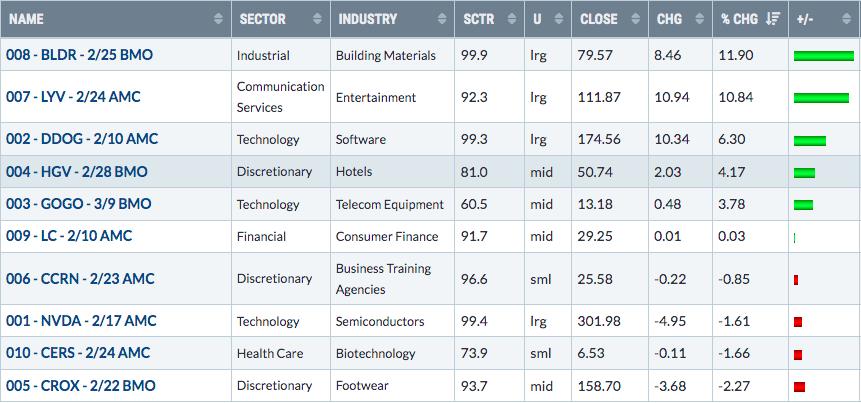
We didn't see much downside in our individual portfolio components, so let's look at a stock that had a great week, but now is facing key short-term gap resistance:
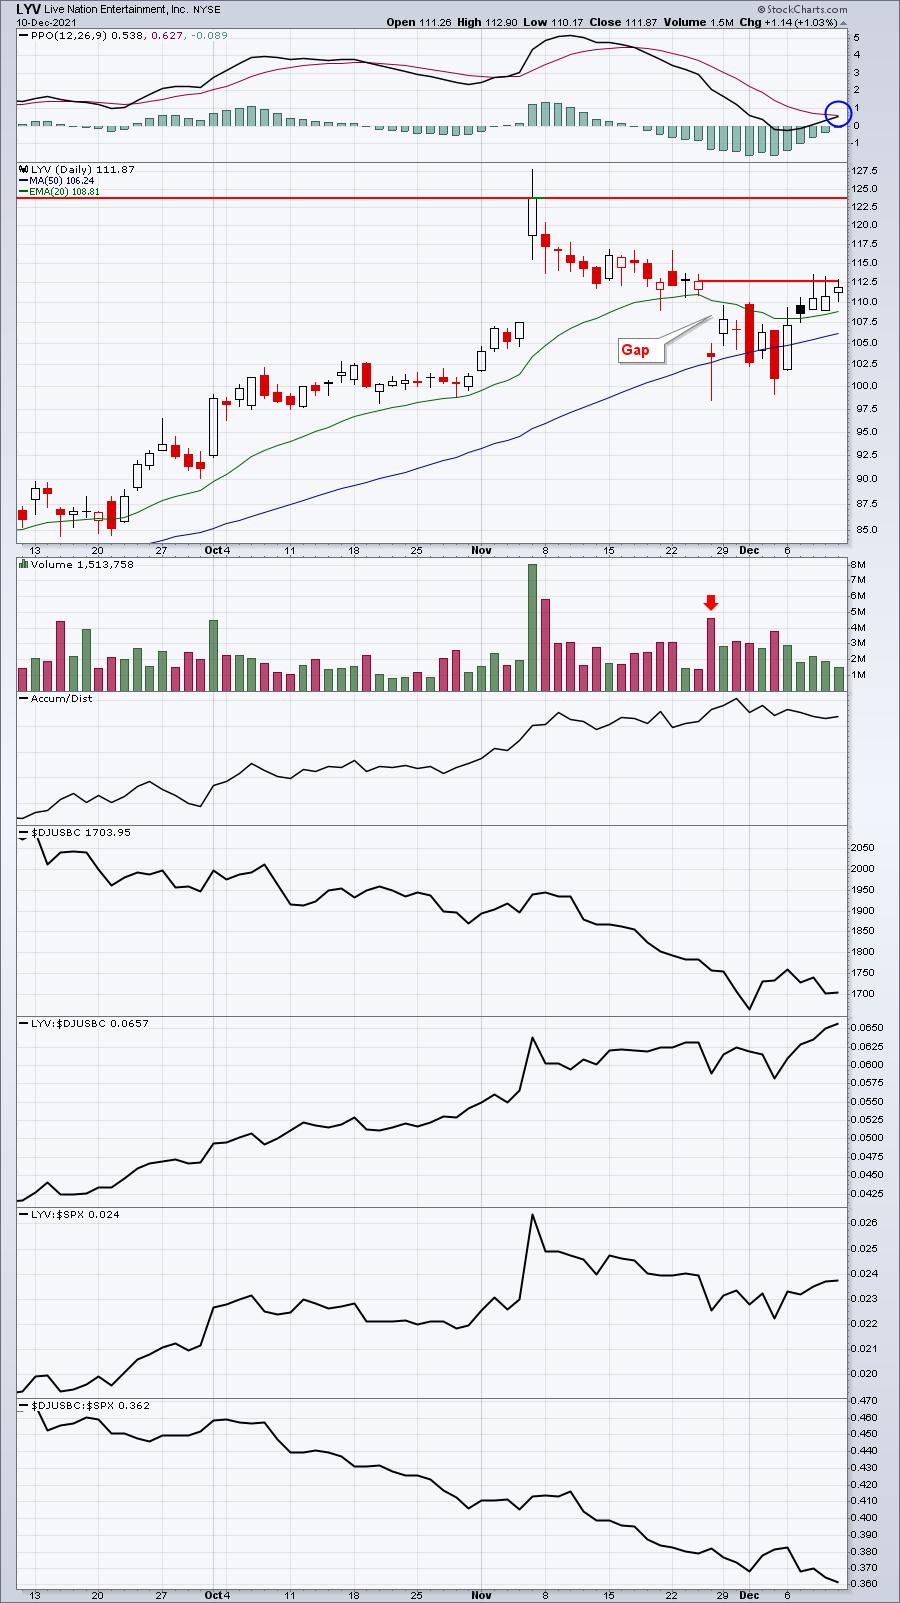
This is a very interesting chart. The biggest problem for LYV right now is that its industry group is VERY weak. If LYV can get a little strength from broadcasting & entertainment ($DJUSBC) and it can break above that gap resistance level, I could see it quickly returning to the 124-125 level.
Income Portfolio:
The Income Portfolio gained 3.29%, just shy of the S&P 500. Here's the updated inception-to-date chart of the portfolio:
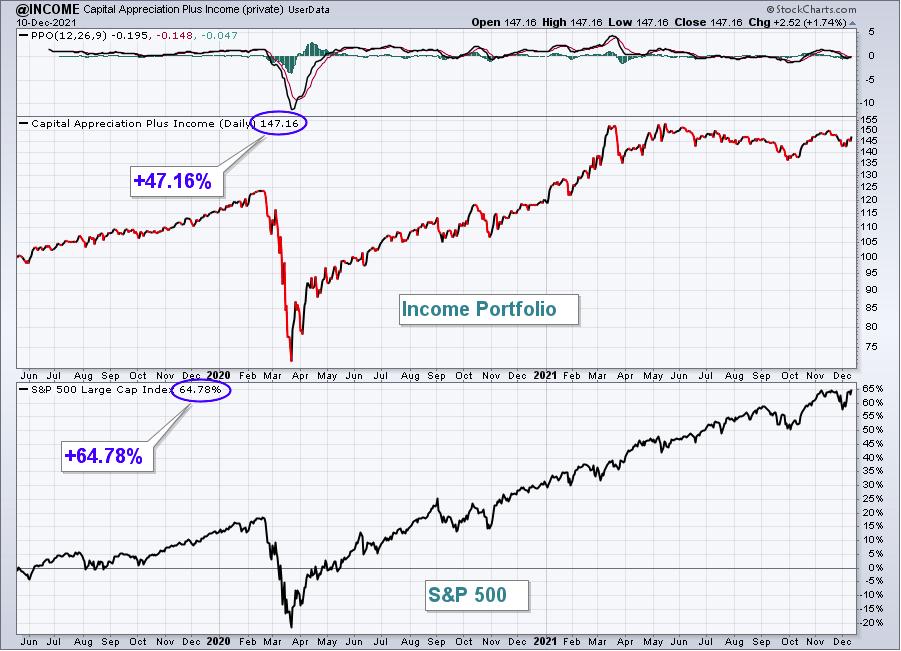
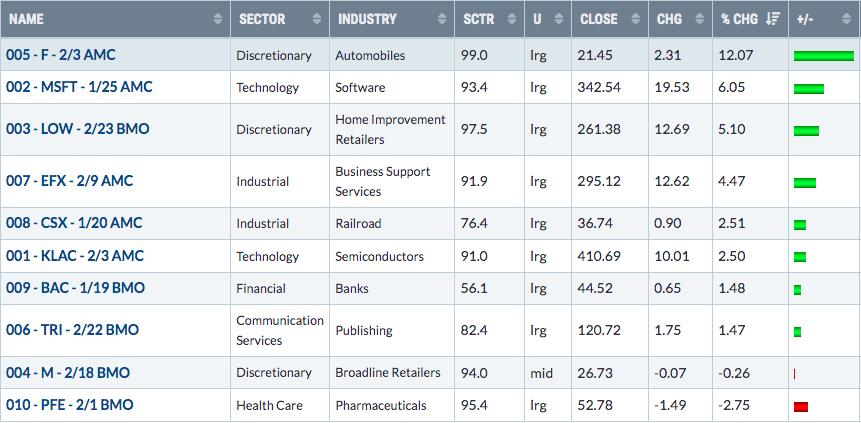
Here are how the Income portfolio component stocks performed last week:
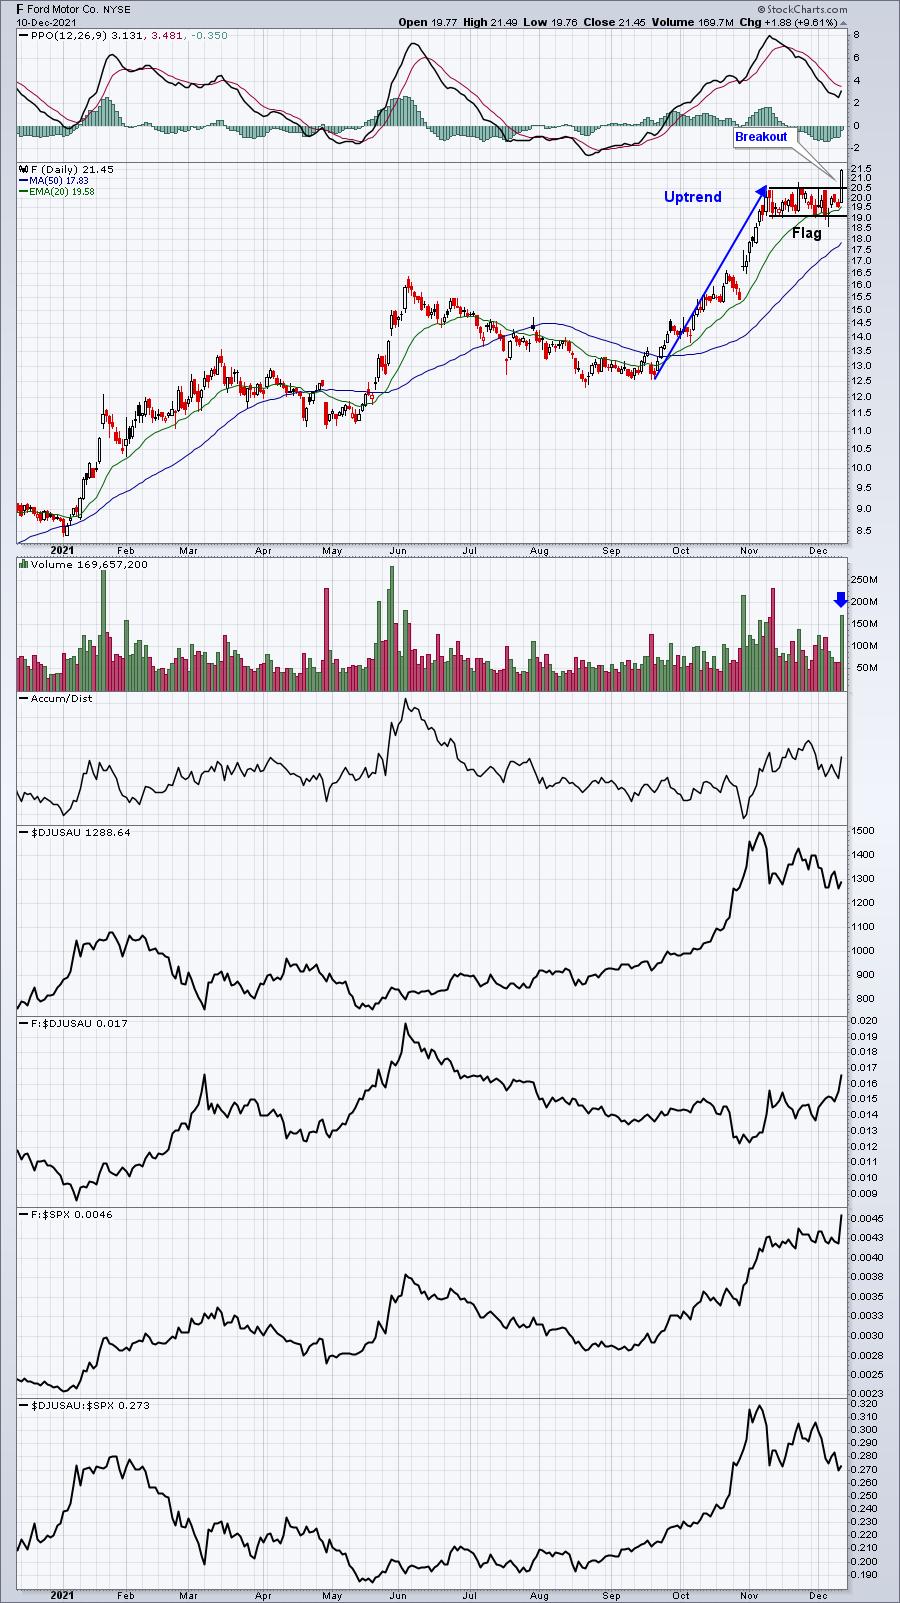
F made a big breakout on Friday, which could lead to further short-term gains:
Strong AD Portfolio:
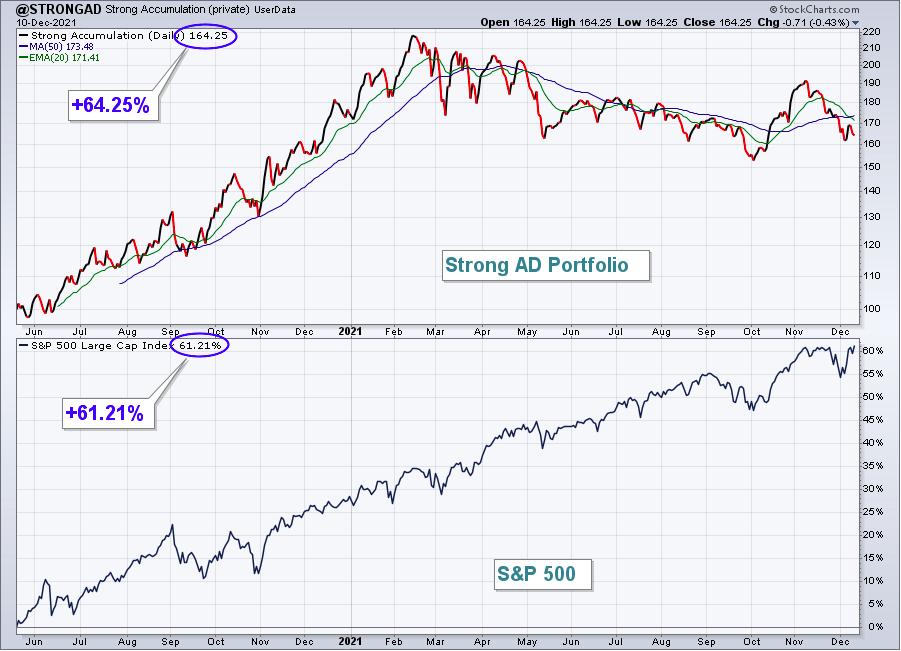
The Strong AD Portfolio climbed 1.65%, trailing the S&P 500. Here's the updated inception-to-date chart of the portfolio:
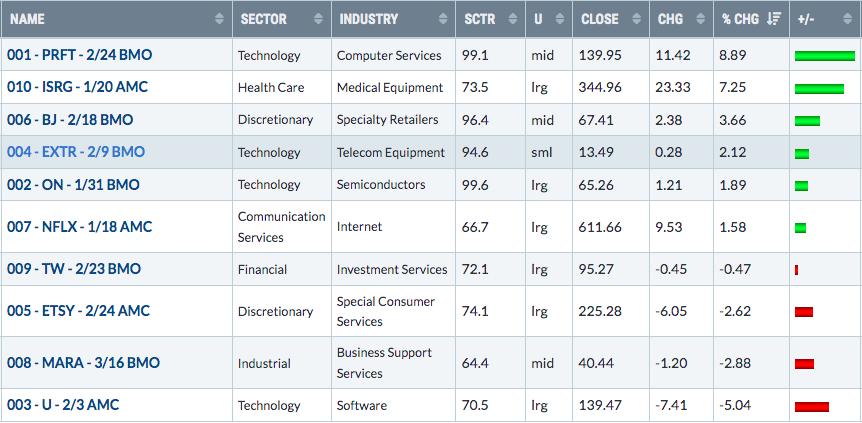
Here are how the Strong AD portfolio component stocks performed last week:
EXTR printed a candle on Friday that could lead to further short-term selling. We approach these portfolios as buy and hold (for the entire quarter), so we pay no attention to short-term signals. But trading these stocks is an option for those who want to trade. I don't own EXTR, but if I did, I'd seriously have considered selling on Friday afternoon and trying to buy back in cheaper. The reason is the bearish engulfing candle that printed with a negative divergence in place. Trading is all about risk management and I do believe the short-term risk on EXTR just increased based on Friday's development. Here's the visual:
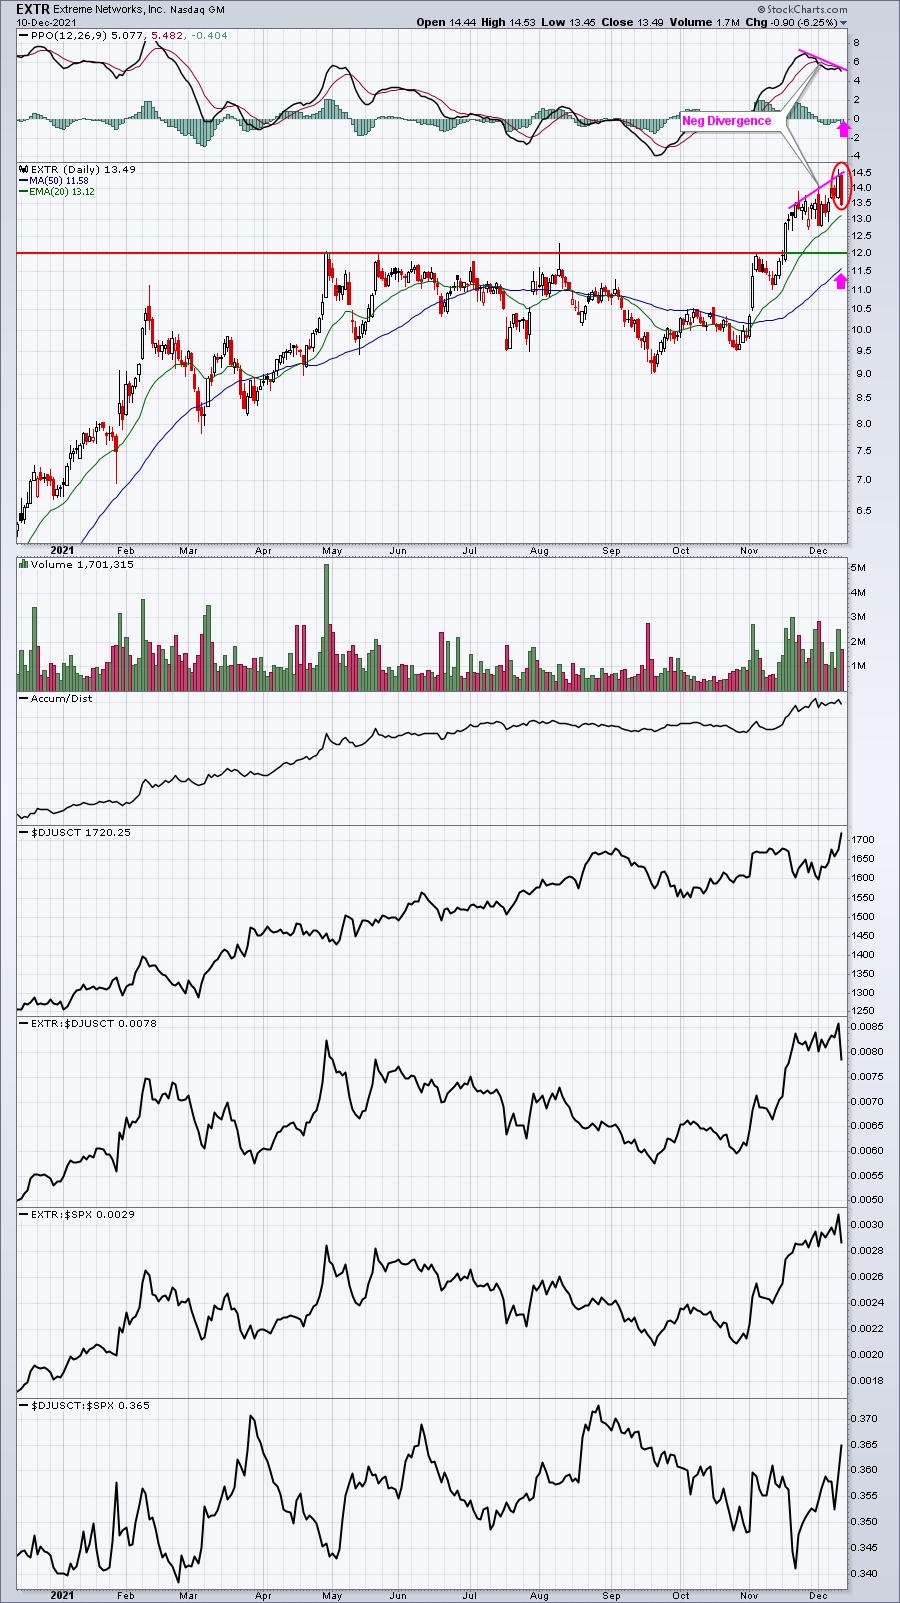
I see the "potential" of a drop to the 11.50-12.00 area. It certainly doesn't guarantee us that it will occur. But the risk has increased for further short-term selling.
Earnings Reaction Portfolio:
The Earnings Reaction Portfolio 0.42%, underperforming the S&P 500 by a wide margin. Here's the updated inception-to-date chart of the portfolio:
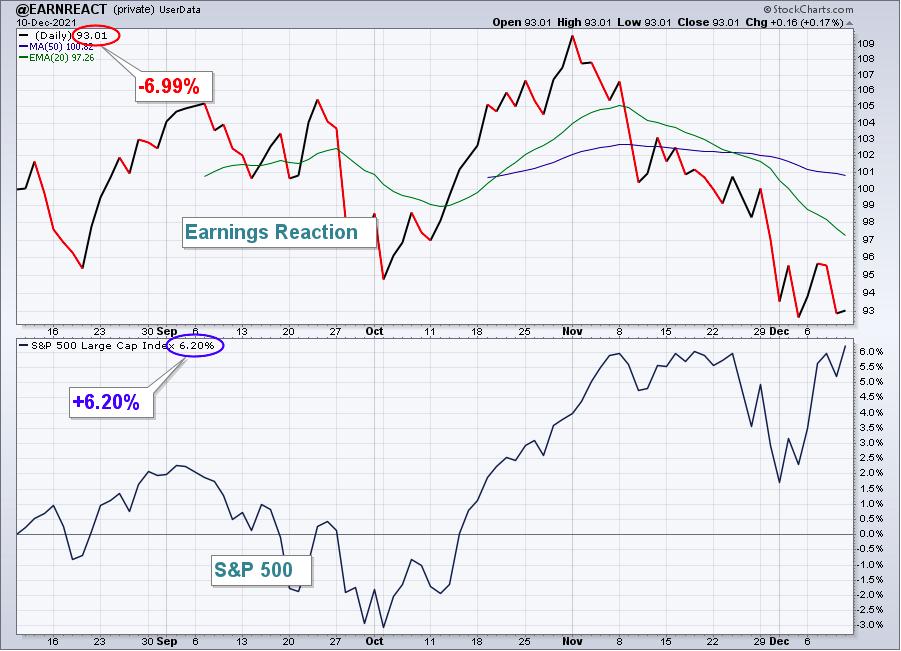
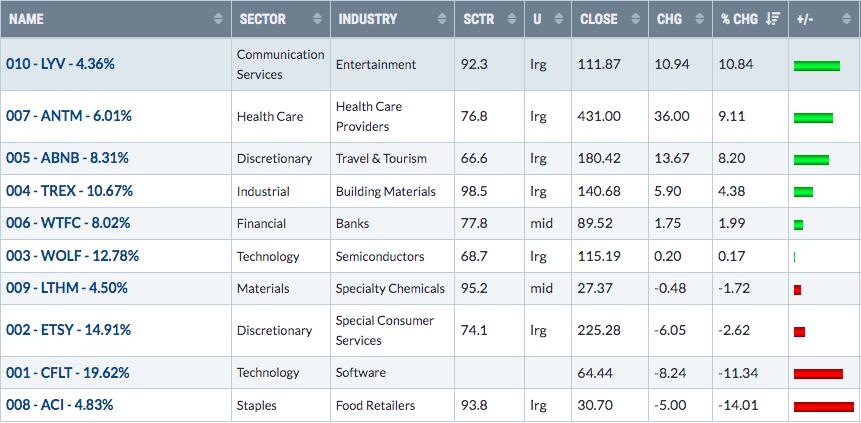
Here are how the Earnings Reaction portfolio component stocks performed last week:
Summary
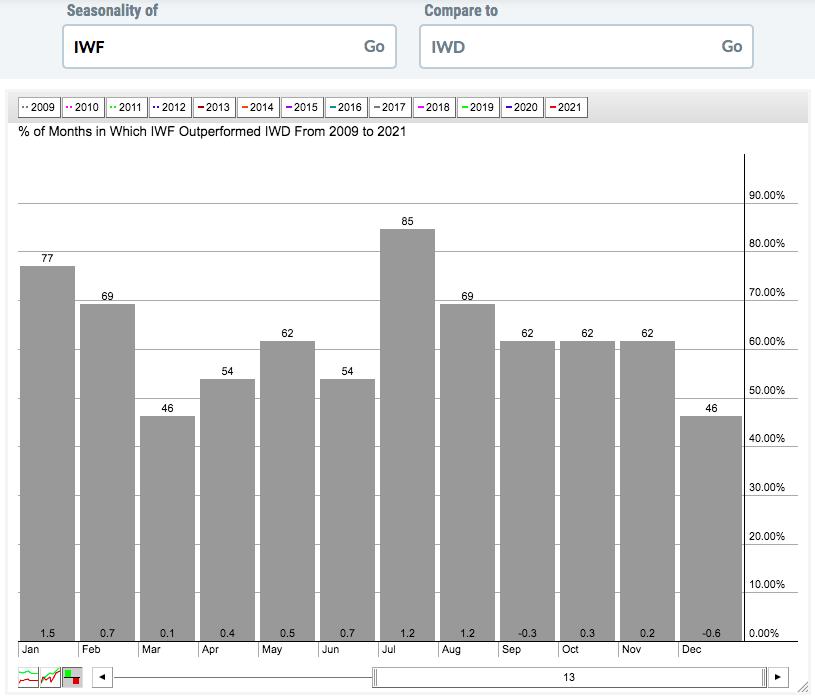
Our goal with our portfolios is always to outperform the benchmark S&P 500. In a secular bull market, the tendency is for growth stocks to outperform value stocks over time. Growth stocks will be associated with volatility as they can't boast stability of earnings. Their valuations are driven by future growth, future growth rates, and interest rates. Whenever the future assumptions of these three come under attack, growth stocks will get beaten up. When they beat estimates and/or raise guidance, we tend to see growth stocks crush value stocks. To help illustrate this, let's look at the seasonal chart for the large cap growth stocks (IWF) vs. the large cap value stocks (IWD) over the past 13 years - since the bear market bottom in 2009:
A few points here:
- The two best relative months for the IWF has been July and January, the first months of calendar quarters when most large cap companies report earnings
- The two worst relative months have been December (current month) and September (few earnings reported in the third month of calendar quarters)
- Relative performance for 1st calendar months - Jan, Apr, Jul, Oct: +3.4%
- Relative performance for 2nd calendar months - Feb, May, Aug, Nov: +2.6%
- Relative performance for 3rd calendar months - Mar, Jun, Sep, Dec: -0.1%
I tend to track both Cathie Wood's ARK funds (ARKK in particular) and the Innovator IBD 50 Fund (FFTY) as they are both very growth-oriented, similar to our portfolios. When they're outperforming the S&P 500, I would expect to do the same. But when they're not, that is going to mean our portfolios are facing tremendous headwinds. Here is a chart of how the ARKK, FFTY, and our Model Portfolio have performed relative to the S&P 500 over the past 2 years:
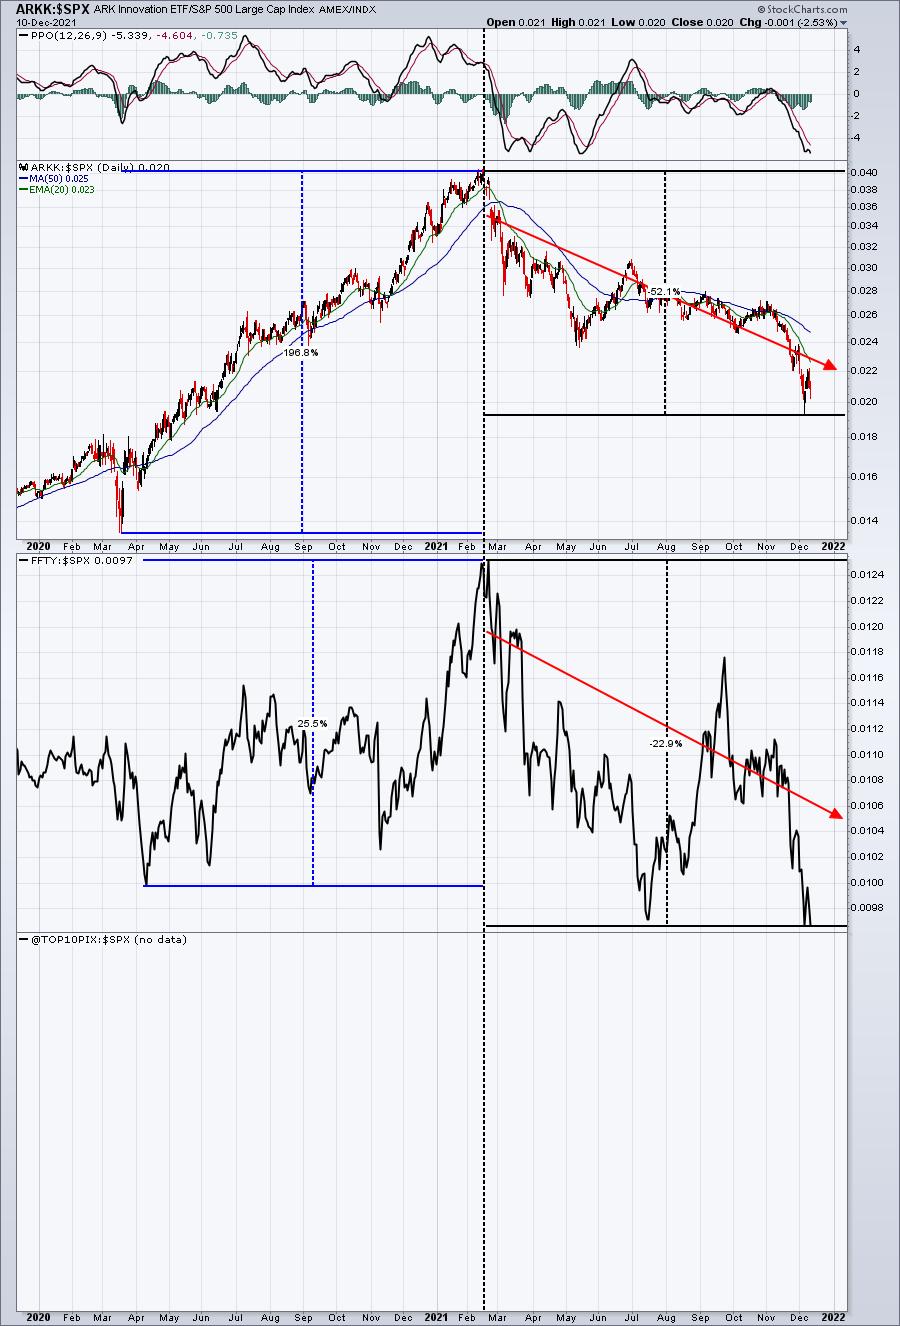
Over the past two years, our Model Portfolio has done better than both the ARKK and FFTY, which we're really proud of, because the ARKK and FFTY have both been excellent growth ETFs over the past few years. But I believe the chart above shows the difficulty that 2021 has presented. For growth stocks, it all started in February 2021, which is when the inflationary concerns first began. I could see these challenges continuing through April to June 2022, which is when I expect to see inflationary pressures subside substantially. If you haven't had a chance yet, you should check out my Trading Places blog article from yesterday, which provides my reasoning for the subsiding inflationary pressure. CLICK HERE to read the article.
Model ETF Portfolio
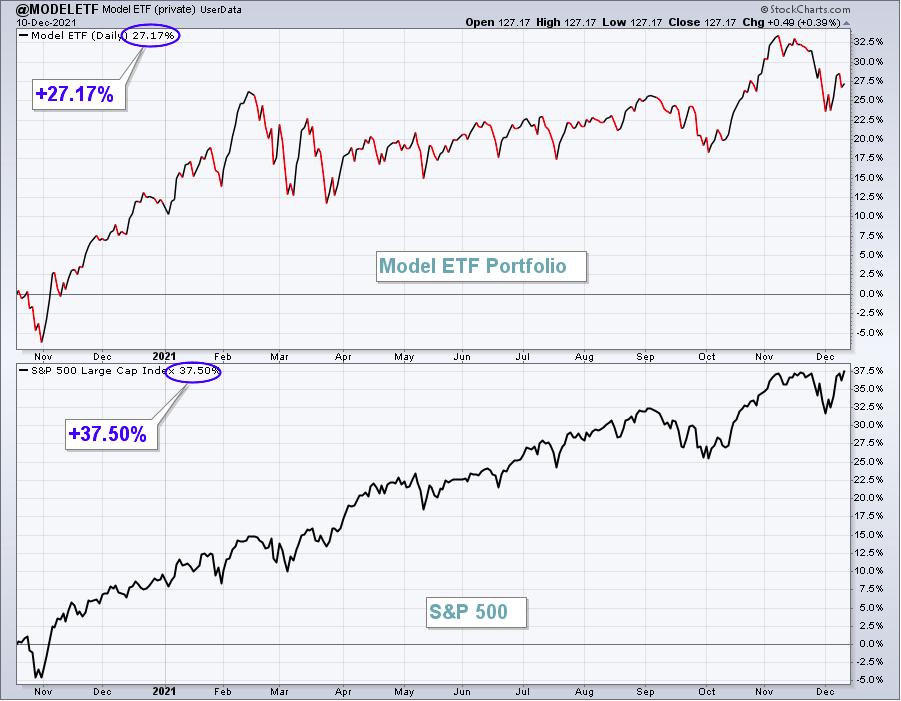
Our Model ETF Portfolio gained 2.80%, which fell short of the S&P 500's gain.
Here's the updated inception-to-date chart of the Model ETF Portfolio:
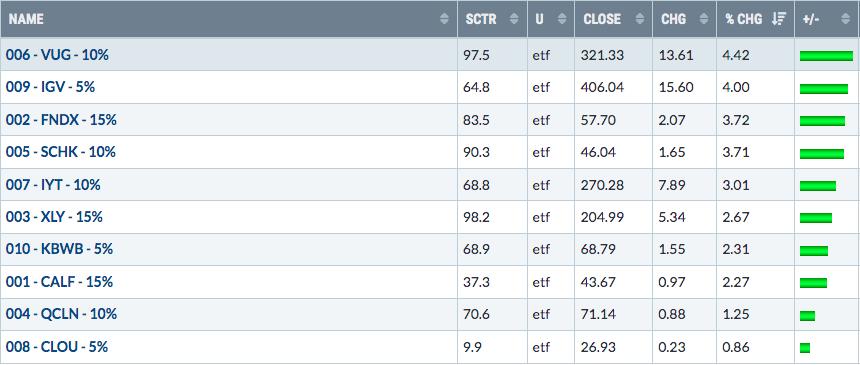
Here are how the Model ETF Portfolio component ETFs performed last week:
Happy trading!
Tom Bowley, Chief Market Strategist
EarningsBeats.com
"Better timing. Better trades."