
EB Weekly Portfolio Report - Sunday, January 9, 2022
Fall Special - Revisited!
In connection with our third annual Market Vision event - Market Vision 2022 - we've decided to bring back our best membership deal ever! You can extend your membership for 1, 2, or 3 years, with up to one year of free service depending on the length of your renewal. For more details, you can CLICK HERE. But hurry, this special offer will only last through Monday, January 10th at midnight!
We're providing this special as a thank you to our loyal members and to commemorate our third annual Market Vision event. For those of you on a trial membership, the annual renewal and free bonus service will be added to the end of your free trial period. In other words, you won't lose the balance of your free 30-day trial period if you decide to extend now.
Market Vision 2022
We had a tremendous session yesterday with the following speakers from StockCharts.com joining me:
- Grayson Roze, Vice President of Operations
- David Keller, Chief Market Strategist and Host of The Final Bar
- Bill Shelby, Lead Software Engineer
It was 5 hours of excellent stock market analysis, education, and 2022 forecasts. The recording is now available on our website, so feel free to review it at your leisure! After you log in to EarningsBeats.com, click on this LINK and you'll find it at the top of our webinar archives.
Upcoming Earnings Reports
According to Zacks.com, the following companies will be reporting earnings this week and each is a component of one of our portfolios:
Monday, January 10: None
Tuesday, January 11: None
Wednesday, January 12: None
Thursday, January 13: None
Friday, January 14: None
PLEASE NOTE: The above companies were provided after scanning the Zacks Earnings Calendar. My research is limited to what Zacks provides and I also can make a mistake from time to time, so please check for earnings dates for all companies that you own. We do hold our portfolio stocks through one earnings report, but every EarningsBeats.com member must make his/her own investing/trading decisions about holding stocks into earnings reports as it's the most volatile (risky) time to own a stock.
Portfolio Rules and Objectives
Here are the common traits and objectives of our portfolios:
- There are 10 leading stocks from up to 10 leading industries in each portfolio (at the time of selection). Generally, there will only be one stock per industry group, but there could be exceptions.
- They are held for an entire 90-day period, with no stops in place. We strive for consistency, transparency, and simplicity in our portfolios. EB.com members may hold these stocks for the entire 90 days, trade them, use stops, etc., but for purposes of our calculation, we will make no exceptions to our "buy and hold for three months" strategy.
- Every stock will generally be held through ONE earnings report
- The expectation is that relative winners will carry the portfolio to outperformance
- They were all entered into as of the close on Friday, November 19th; members may choose to try to time better entries, but EB.com "purchased" as of November 19th's closing price
- Primary objective is to outperform the benchmark S&P 500
Here are several considerations for EB members:
- I would expect the Strong AD and Aggressive portfolios to be the riskiest, followed by the Model portfolio, and then the Income portfolio
- The Strong AD portfolio will be selected from a combination of rising accumulation/distribution lines and SCTRs above 70 at the time of selection. It is the only portfolio that does NOT require a revenue and EPS beat in its most recent quarterly earnings report
- The Income portfolio stocks will all pay dividends, with the expected average dividend yield to be at least 1.0%
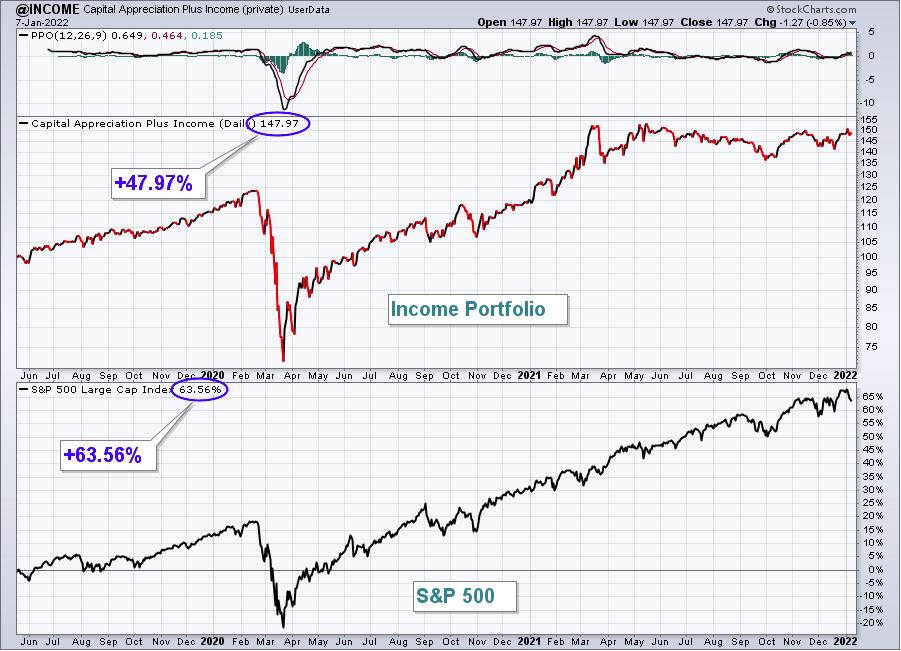
- Drawdowns (losses) should be much milder on the Income portfolio, with more volatility expected on the other three; please review inception-to-date charts below to gain an idea of the volatility associated with each
- I believe the larger drawdown on the Income portfolio at the beginning of the pandemic was an anomaly, occurring as many defensive, higher-yielding companies uncharacteristically underperformed during a market decline.
- Large drawdowns in the February through May 2021 period were due to the rapid rotation from growth stocks to value stocks; each quarter, our portfolios are based on themes and there is never a guarantee that our analysis and beliefs will be proven correct
- You should consider owning or trading these stocks in whatever manner is most comfortable for you; while we will buy all 10 stocks in the manner identified above, feel free to trade certain stocks or wait for pullbacks if the stocks are overbought
- We have no idea what risk each member is willing or able to take. We are not registered investment advisors so be sure you understand the risk you take. Please consult your financial advisor.
- EarningsBeats.com shareholders/employees may own all or some of the portfolio stocks from time to time.
Weekly Snapshot
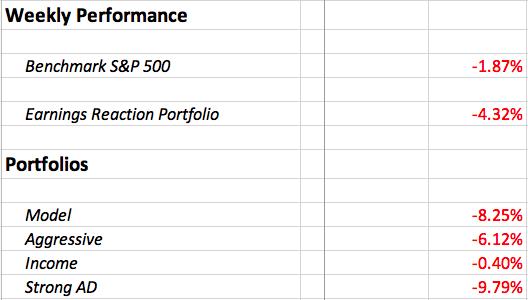
Here's a weekly recap:
Weekly Summary
Benchmark S&P 500:
The S&P 500 held up fairly well last week, masking some initial selling in a group that has practically held up the entire market on its broad shoulders - the large cap growth area ($DJUSGL). I'm seeing signs that large cap growth could be primed for a tumble in Q1 2022. If I'm correct, then the S&P 500 is likely to suffer its worst drawdown in quite some time. The chart below highlights the NASDAQ 100 index ($NDX) closing beneath its 20-week EMA for the first time in a long time. The continuing negative divergence (rising prices with a falling weekly PPO) is not a good look here as the 20-week EMA breaks down:
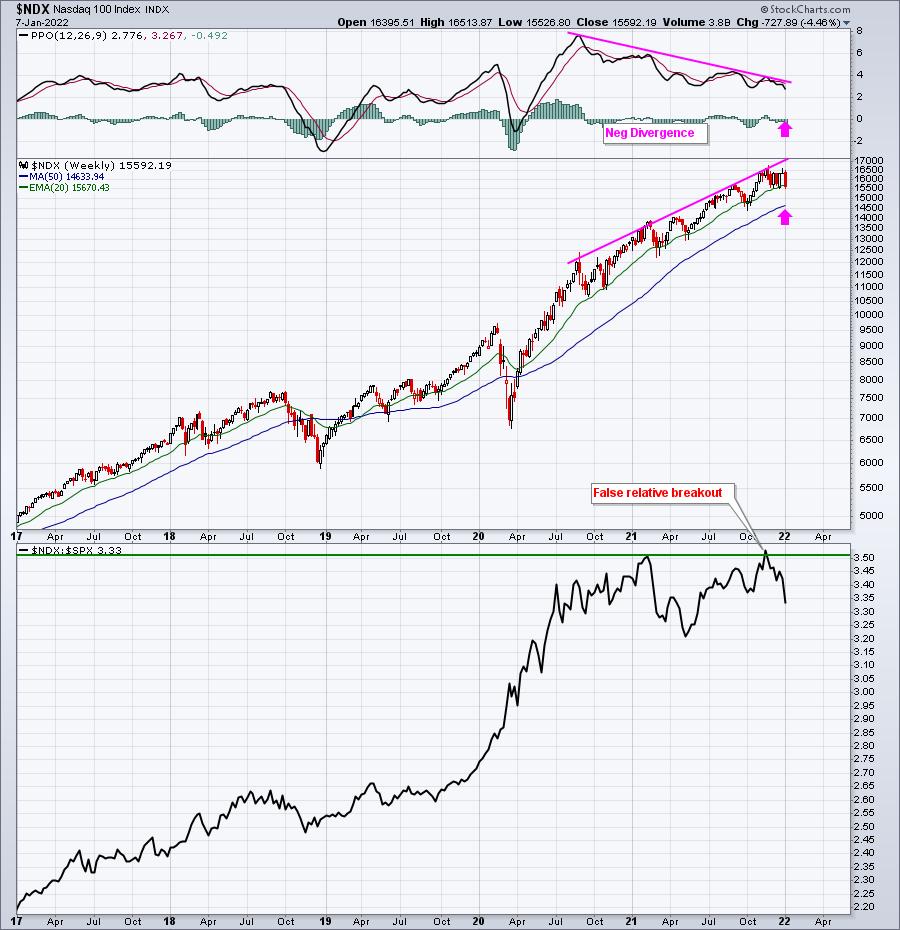
The worrisome part here is that you can see the level of outperformance by the NDX in 2020 when interest rates fell precipitously. As the 10-year treasury yield ($TNX) breaks out to its highest level since before the pandemic, it could be the catalyst to drive the large cap growth stocks significantly lower. While that would impact the S&P 500 negatively, it would impact the NDX much, much more.
Model Portfolio:
The Model Portfolio dropped 8.25%, badly lagging the S&P 500. Here's the updated inception-to-date chart of the portfolio:
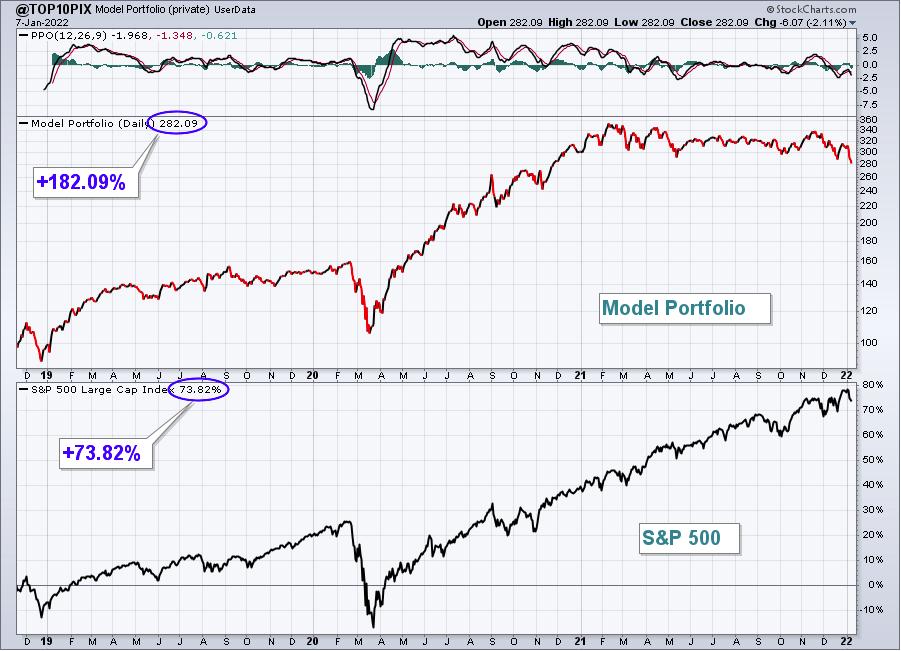
Here are how the Model portfolio component stocks performed last week:
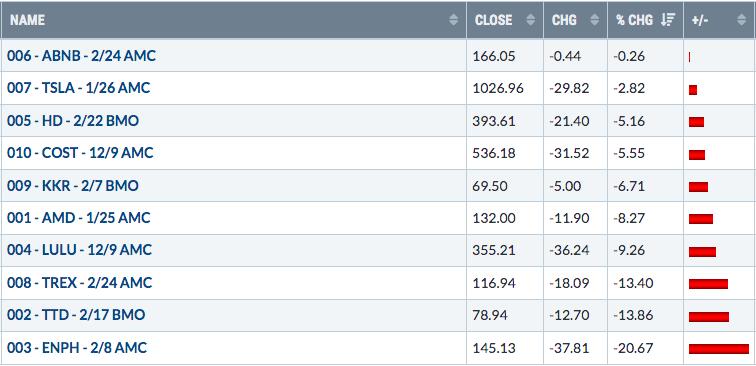
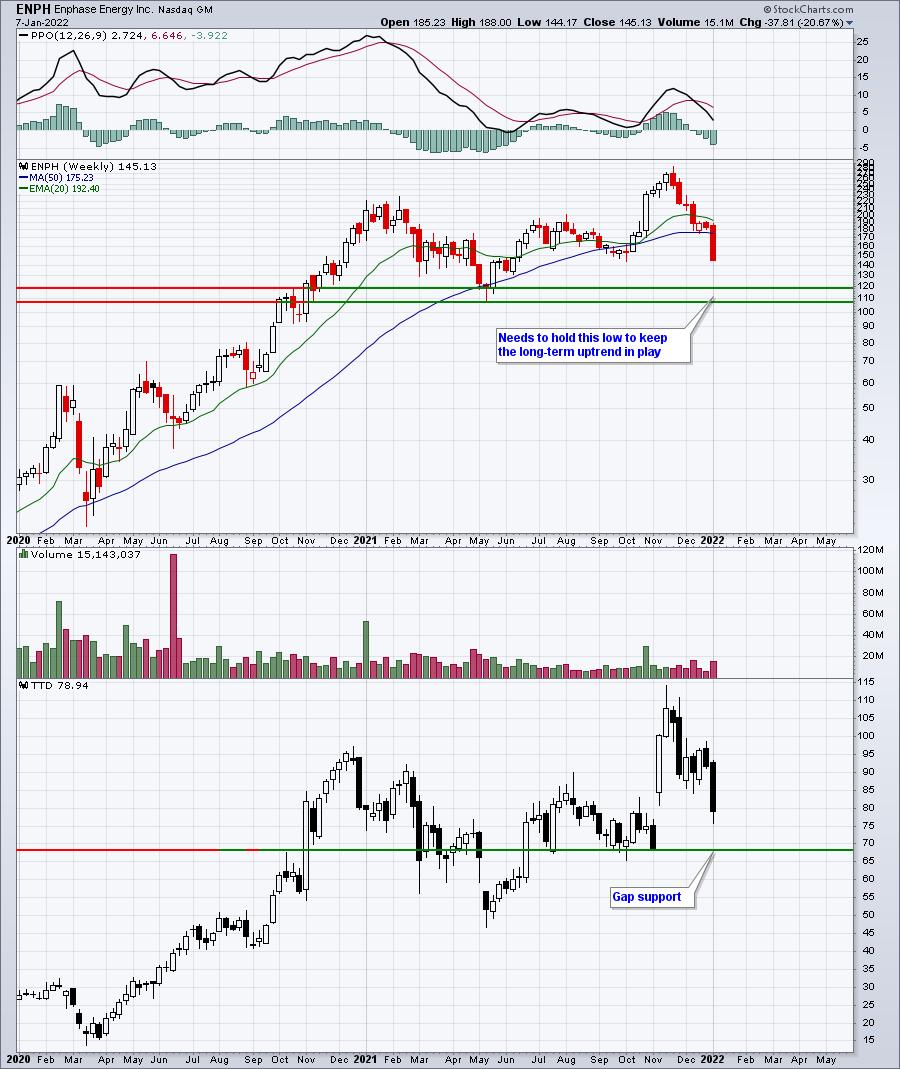
Now that we're seeing many breakdowns in the growth stocks that permeate our portfolios, it's probably a good idea to refer to weekly charts to find potential bottoms as growth stocks remain under pressure. Here is a quick look at both ENPH and TTD:
Aggressive Portfolio:
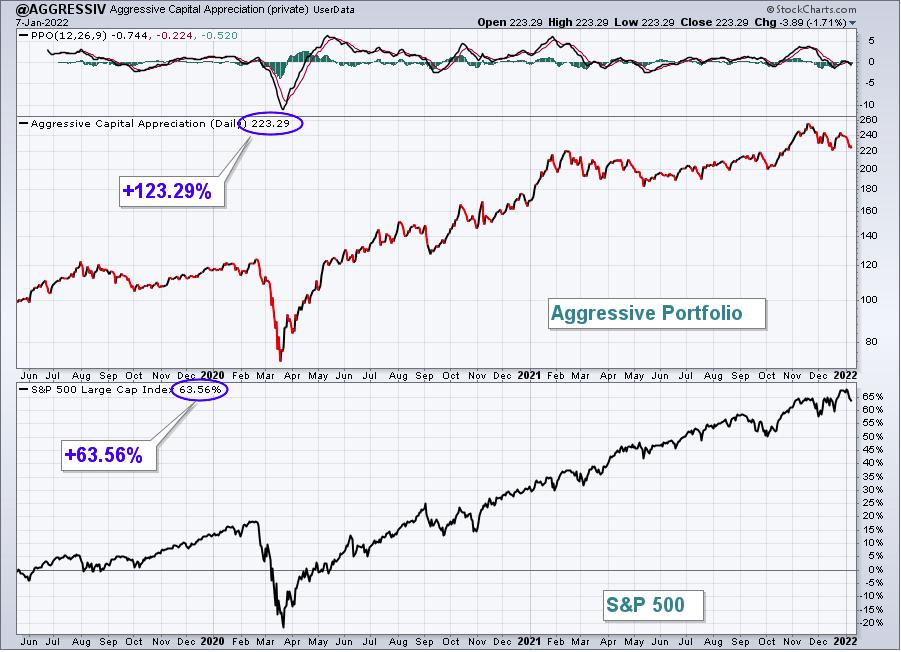
The Aggressive Portfolio fell 6.12% last week, also trailing the S&P 500. Here's the updated inception-to-date chart of the portfolio:
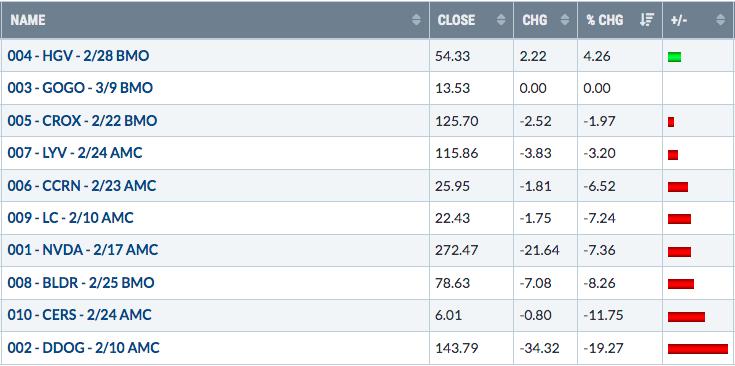
Here are how the Aggressive portfolio component stocks performed last week:
Again, let's take a look at a longer-term weekly chart to identify key areas of support for DDOG and CERS:
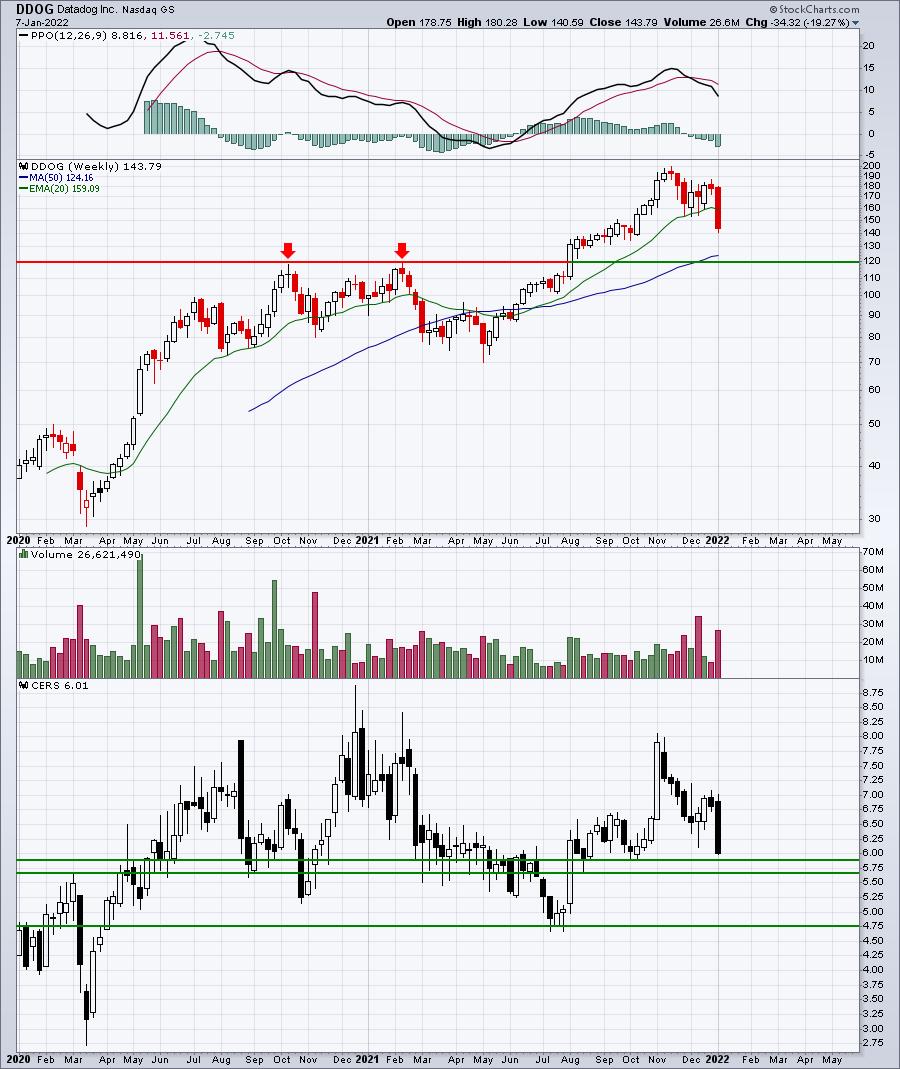
CERS, in particular, needs to hold price support that it's rapidly approaching. If it doesn't, another steep decline to 4.75 is entirely possible.
Income Portfolio:
The Income Portfolio shrank just 0.40% last week, outperforming the S&P 500. Here's the updated inception-to-date chart of the portfolio:
Here are how the Income portfolio component stocks performed last week:
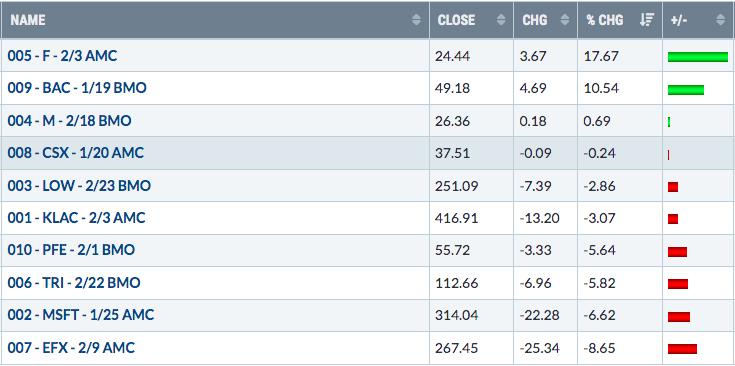
F had an excellent week and actually set its all-time high, which we have to go back a couple decades to find:
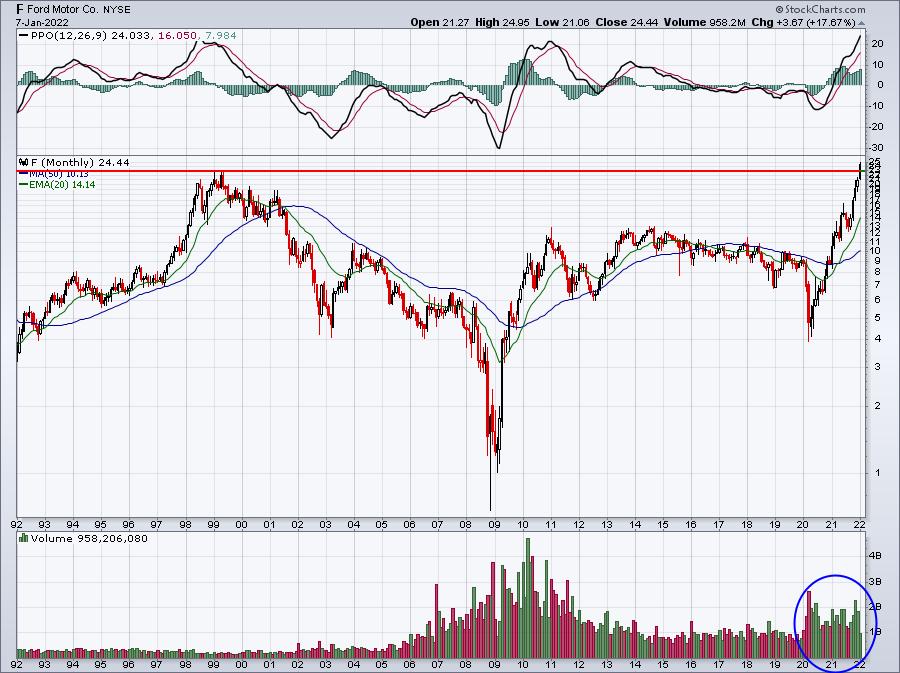
Volume has been pouring into F the past couple years. It certainly appears that accumulation has taken place given the rise and the volume.
Strong AD Portfolio:
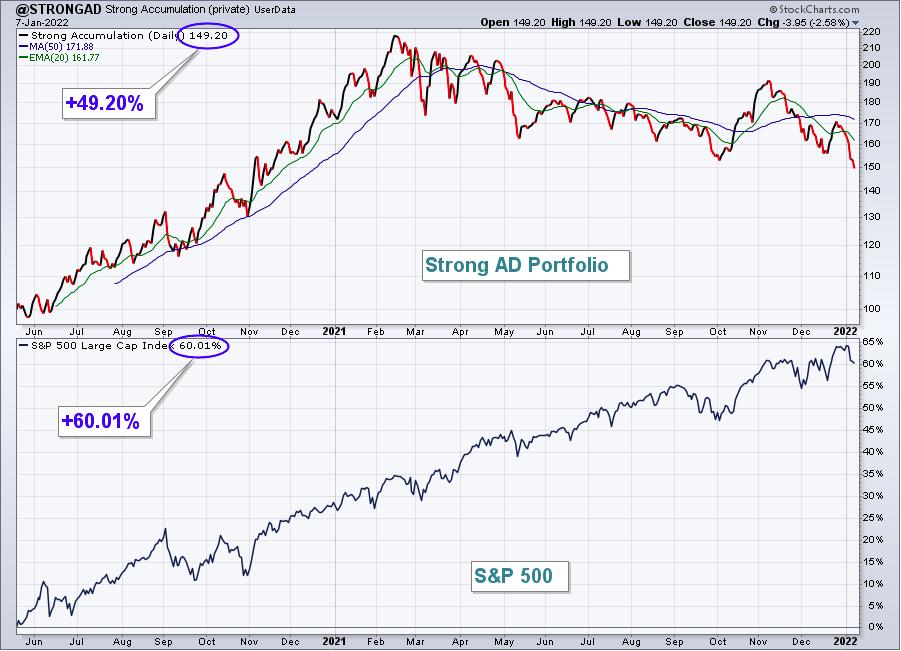
The Strong AD Portfolio lost 9.79% last week, significantly underperforming the S&P 500. Here's the updated inception-to-date chart of the portfolio:
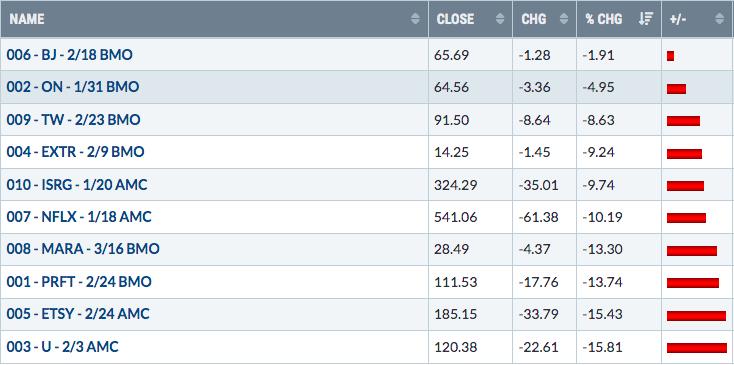
Here are how the Strong AD portfolio component stocks performed last week:
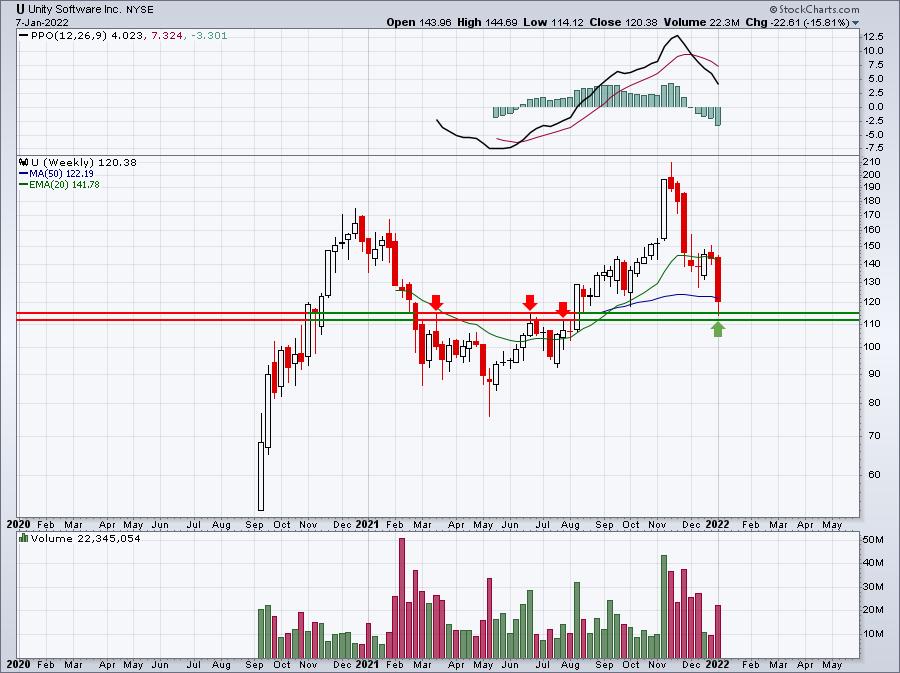
U has only been public since September 2020 and it's quite volatile. Failure to hold price support in the 112-115 area could result in much further selling:
Earnings Reaction Portfolio:
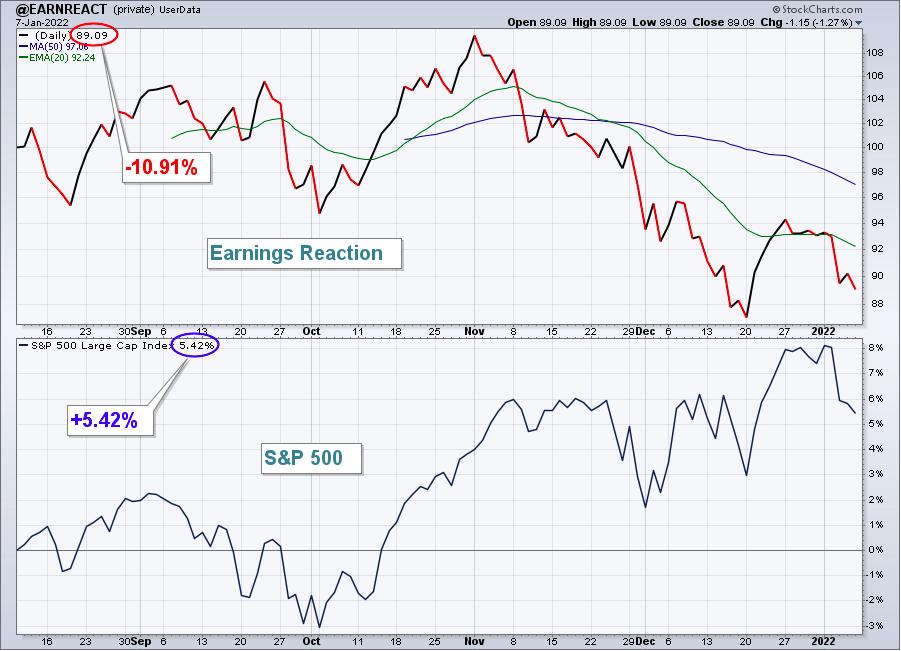
The Earnings Reaction Portfolio fell 4.32% last week, better than our other growth-related portfolios, but still performed well below that of the S&P 500. Here's the updated inception-to-date chart of the portfolio:
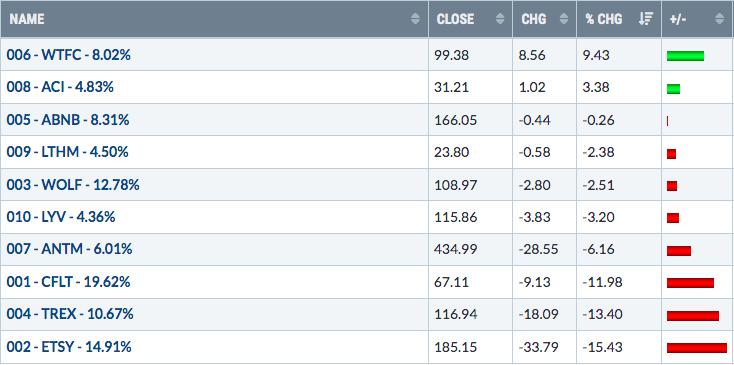
Here are how the Earnings Reaction portfolio component stocks performed last week:
Summary
We hosted our Market Vision 2022 event yesterday and I'll admit I've turned quite bearish near-term. Core CPI is very likely to move higher the next 3 months, at a minimum. With higher inflation is the idea of higher interest rates. Both higher inflation and higher interest rates can wreak havoc on growth stocks. I believe that's why growth stocks have been tumbling - similar to the February to May 2021 period. We concentrate our portfolios in growth stocks, because this area is what typically leads a secular bull market higher over time. That will explain the weak performance as I don't believe we own poor companies. Rather, indiscriminate selling of growth stocks has put tremendous pressure on our portfolios, as well as other growth-related ETFs and mutual funds. I'm not looking for a resurgence in growth stocks until perhaps Q2, possibly even Q3 in 2022. This will continue to be a very difficult market environment until then.
Model ETF Portfolio
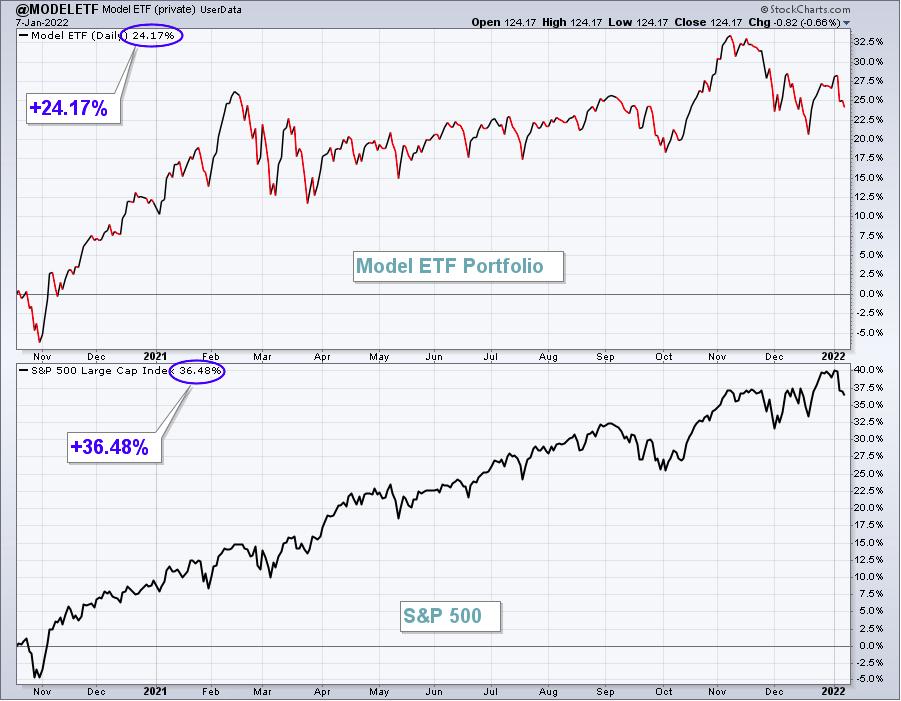
Our Model ETF Portfolio dropped 1.93% last week, essentially on par with the benchmark S&P 500.
Here's the updated inception-to-date chart of the Model ETF Portfolio:
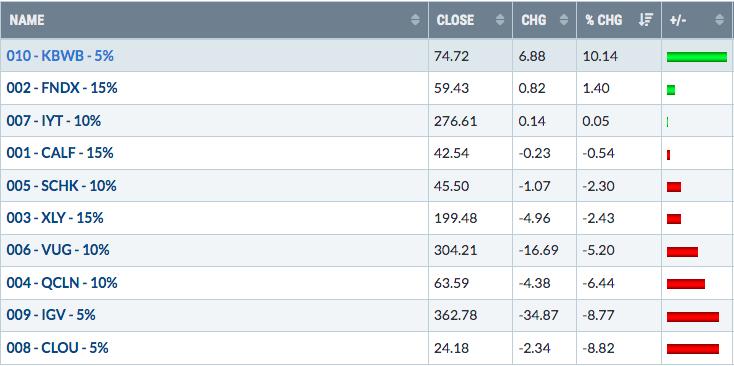
Here are how the Model ETF Portfolio component ETFs performed last week:
Happy trading!
Tom Bowley, Chief Market Strategist
EarningsBeats.com
"Better timing. Better trades."