
EB Weekly Portfolio Report - Sunday, January 16, 2022
Events This Week
We have a full slate of webinars this week, as follows:
- Monday, January 17th, 4:30pm ET, "Q1 Earnings: Sneak Preview"
- Tuesday, January 18th, 7:30pm ET, "January Max Pain" (time was moved from 4:30pm ET - I plan to feature at least a couple of our portfolio stocks as Max Pain trading candidates)
- Wednesday, January 19th, 5:30pm ET, "Model ETF Portfolio"
I hope you're able to join me!
Upcoming Earnings Reports
According to Zacks.com, the following companies will be reporting earnings this week and each is a component of one of our portfolios:
Monday, January 17: None - Market Closed.
Tuesday, January 18: None
Wednesday, January 19: BAC
Thursday, January 20: NFLX, ISRG, CSX
Friday, January 21: None
PLEASE NOTE: The above companies were provided after scanning the Zacks Earnings Calendar. My research is limited to what Zacks provides and I also can make a mistake from time to time, so please check for earnings dates for all companies that you own. We do hold our portfolio stocks through one earnings report, but every EarningsBeats.com member must make his/her own investing/trading decisions about holding stocks into earnings reports as it's the most volatile (risky) time to own a stock.
Portfolio Rules and Objectives
Here are the common traits and objectives of our portfolios:
- There are 10 leading stocks from up to 10 leading industries in each portfolio (at the time of selection). Generally, there will only be one stock per industry group, but there could be exceptions.
- They are held for an entire 90-day period, with no stops in place. We strive for consistency, transparency, and simplicity in our portfolios. EB.com members may hold these stocks for the entire 90 days, trade them, use stops, etc., but for purposes of our calculation, we will make no exceptions to our "buy and hold for three months" strategy.
- Every stock will generally be held through ONE earnings report
- The expectation is that relative winners will carry the portfolio to outperformance
- They were all entered into as of the close on Friday, November 19th; members may choose to try to time better entries, but EB.com "purchased" as of November 19th's closing price
- Primary objective is to outperform the benchmark S&P 500
Here are several considerations for EB members:
- I would expect the Strong AD and Aggressive portfolios to be the riskiest, followed by the Model portfolio, and then the Income portfolio
- The Strong AD portfolio will be selected from a combination of rising accumulation/distribution lines and SCTRs above 70 at the time of selection. It is the only portfolio that does NOT require a revenue and EPS beat in its most recent quarterly earnings report
- The Income portfolio stocks will all pay dividends, with the expected average dividend yield to be at least 1.0%
- Drawdowns (losses) should be much milder on the Income portfolio, with more volatility expected on the other three; please review inception-to-date charts below to gain an idea of the volatility associated with each
- I believe the larger drawdown on the Income portfolio at the beginning of the pandemic was an anomaly, occurring as many defensive, higher-yielding companies uncharacteristically underperformed during a market decline.
- Large drawdowns in the February through May 2021 period were due to the rapid rotation from growth stocks to value stocks; each quarter, our portfolios are based on themes and there is never a guarantee that our analysis and beliefs will be proven correct
- You should consider owning or trading these stocks in whatever manner is most comfortable for you; while we will buy all 10 stocks in the manner identified above, feel free to trade certain stocks or wait for pullbacks if the stocks are overbought
- We have no idea what risk each member is willing or able to take. We are not registered investment advisors so be sure you understand the risk you take. Please consult your financial advisor.
- EarningsBeats.com shareholders/employees may own all or some of the portfolio stocks from time to time.
Weekly Snapshot
Here's a weekly recap:
Weekly Summary
Benchmark S&P 500:
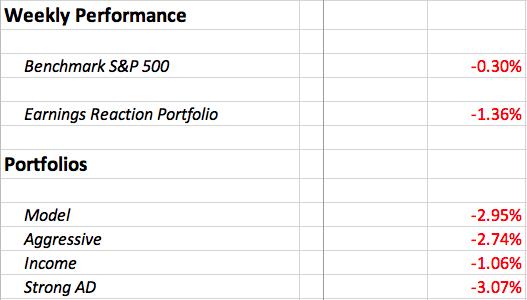
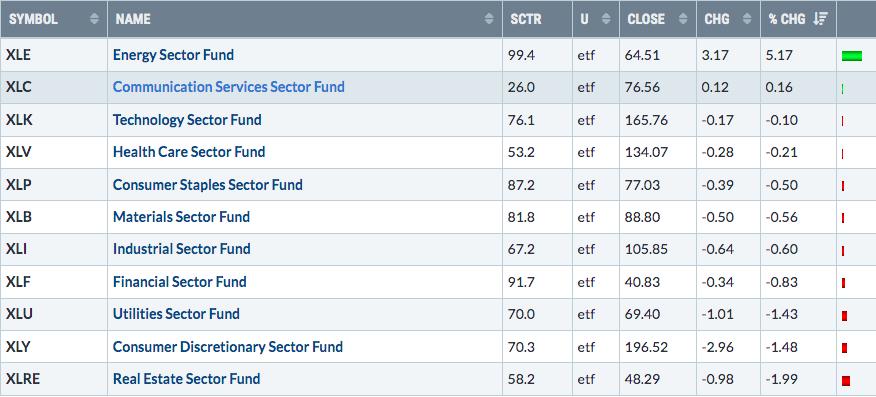
The S&P 500 dropped slightly last week, losing 0.30%. But rotation, overall, put further pressure on growth areas of the market. Here's a recap of sector performance last week, highlighted by a surge in energy names (XLE):
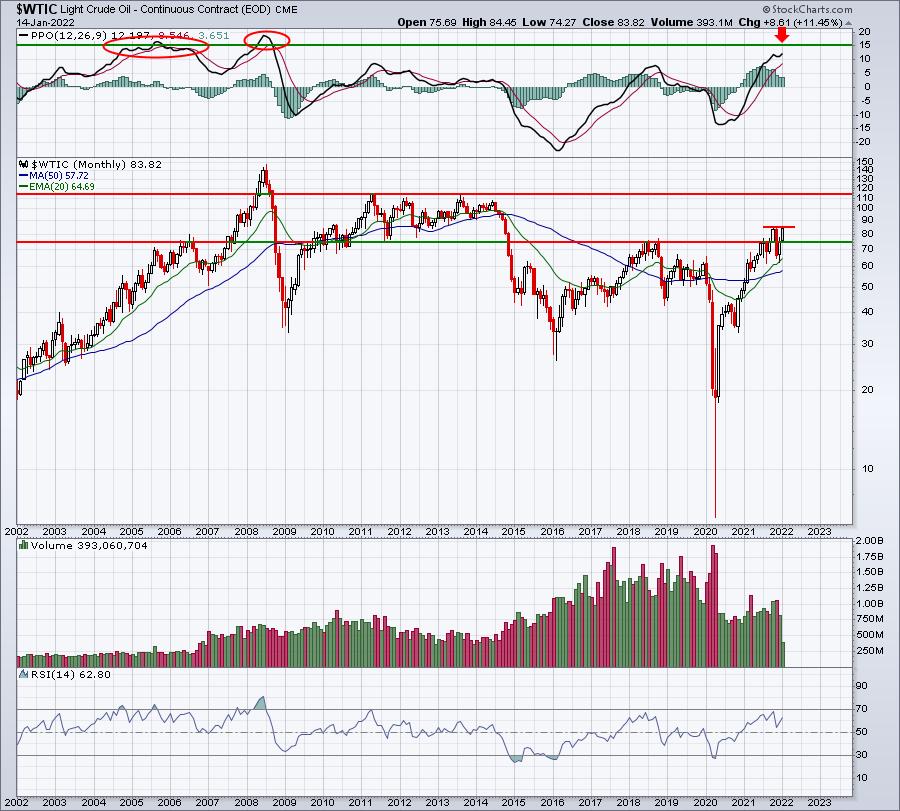
Crude oil ($WTIC, +6.24%) had a huge week and is challenging the multi-year high near $85 set back in October 2021:
Technology (XLK, -0.10%) appears to have performed fairly well, but most areas of technology actually suffered further. Check this out:
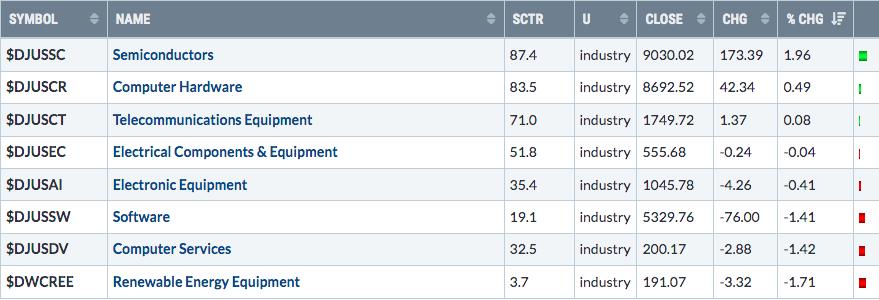
Semiconductors ($DJUSSC, +1.96%) were strong and masked weakness in renewable energy ($DWCREE, -1.71%), computer services ($DJUSCR, -1.42%), and software ($DJUSSW, -1.41%). The 1-month weakness in the DWCREE and DJUSSW could result in options-related gains as we approach options-expiration Friday this week. We'll see.
Model Portfolio:
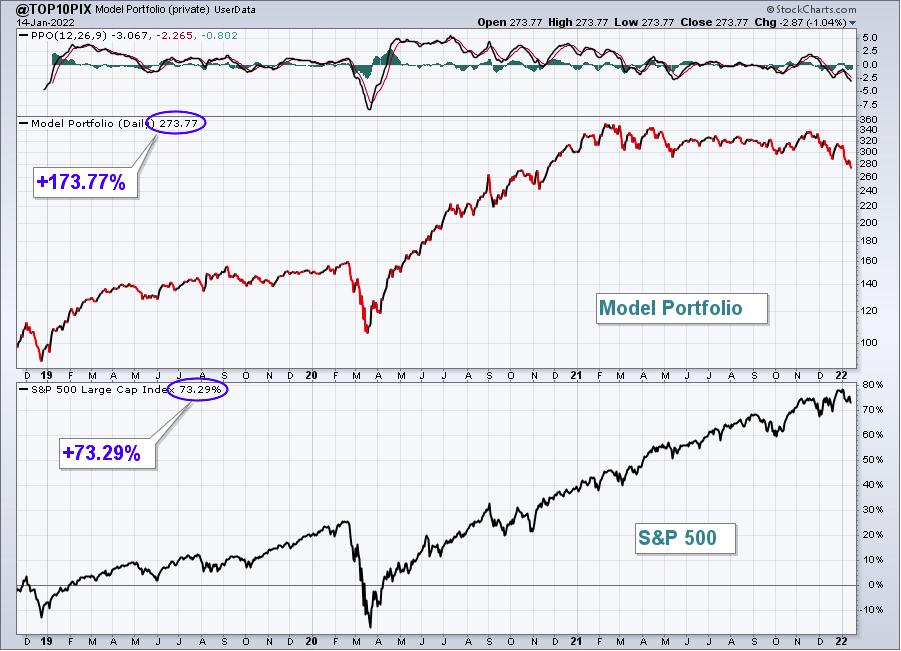
The Model Portfolio dropped 2.95%, trailing the S&P 500. Here's the updated inception-to-date chart of the portfolio:
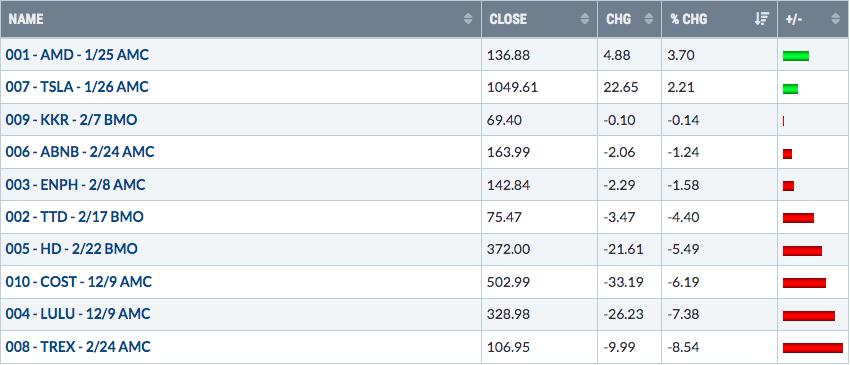
Here are how the Model portfolio component stocks performed last week:
Aggressive Portfolio:
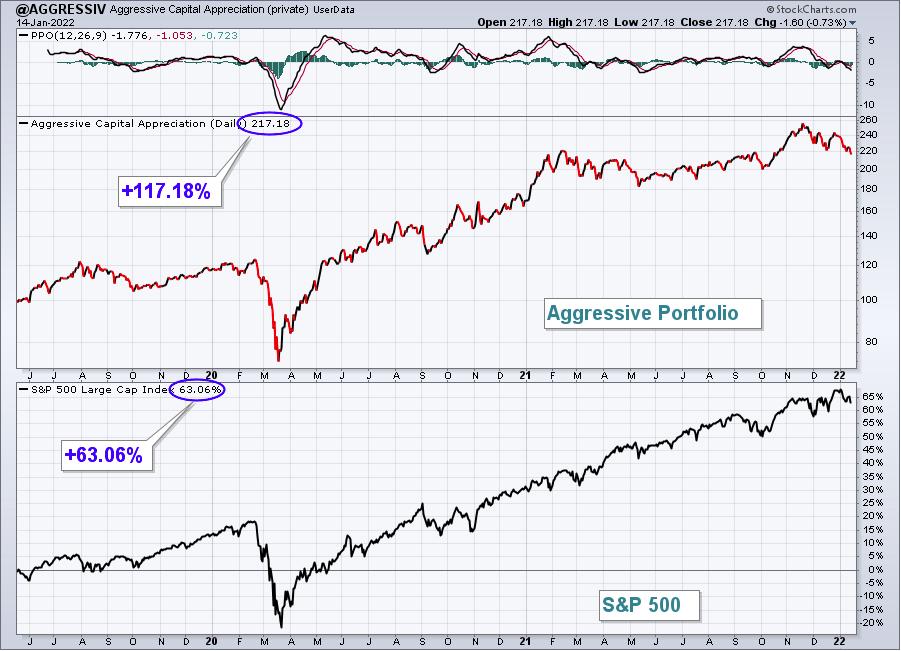
The Aggressive Portfolio fell 2.74% last week, also lagging the S&P 500. Here's the updated inception-to-date chart of the portfolio:
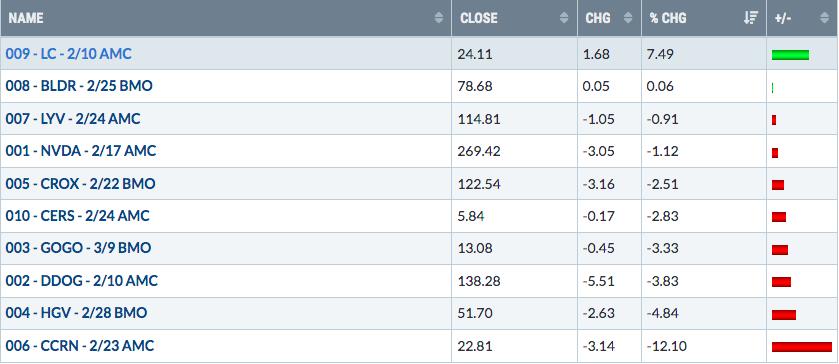
Here are how the Aggressive portfolio component stocks performed last week:
Income Portfolio:
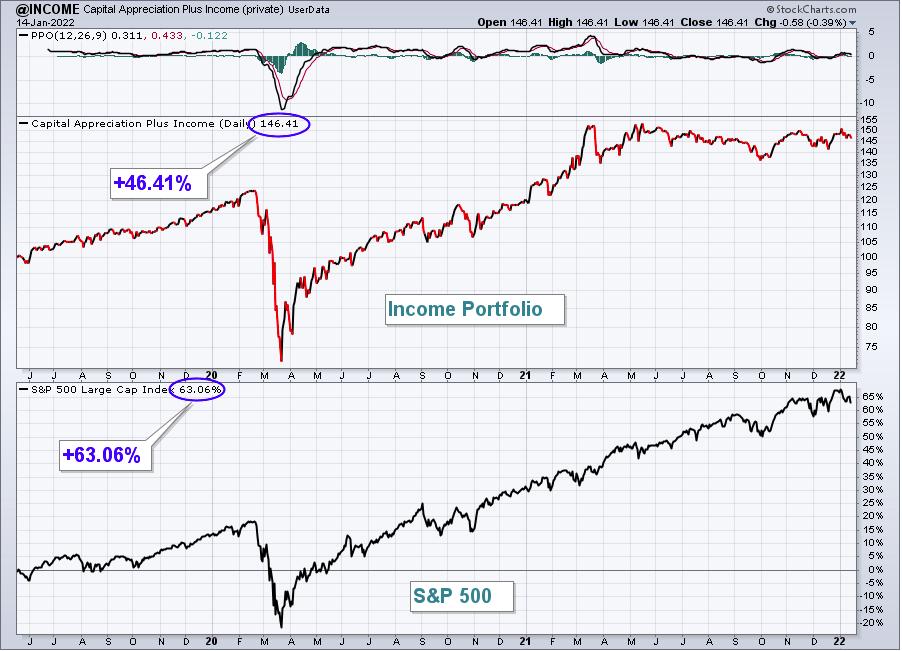
The Income Portfolio shrank just 1.06% last week, holding up fairly well vs. the S&P 500. Here's the updated inception-to-date chart of the portfolio:
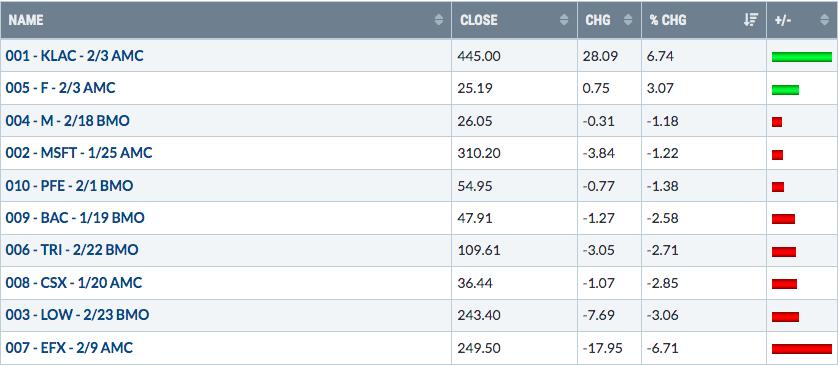
Here are how the Income portfolio component stocks performed last week:
Strong AD Portfolio:
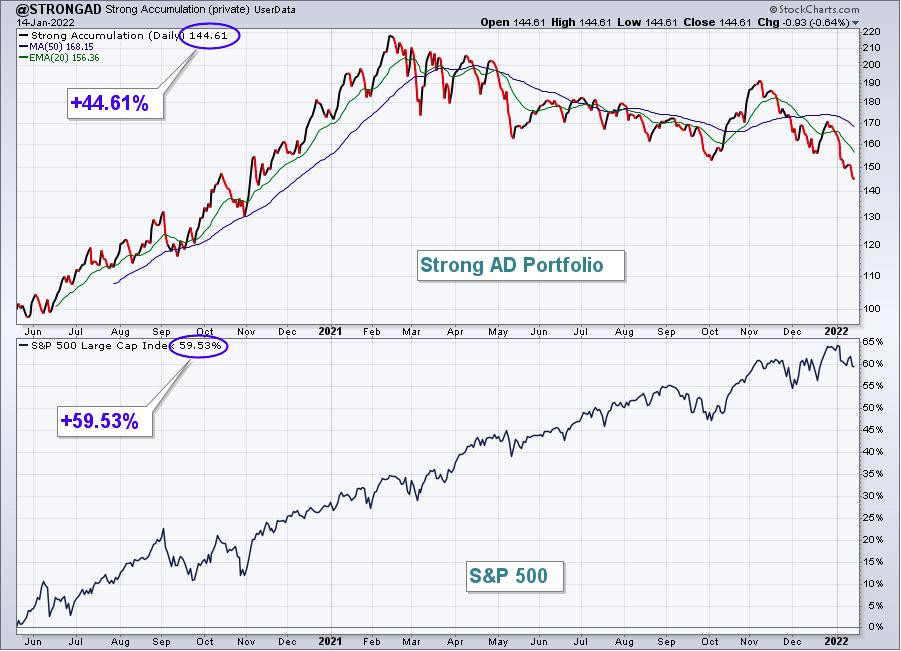
The Strong AD Portfolio lost 3.07% last week, again dropping on a relative basis vs. the benchmark. Here's the updated inception-to-date chart of the portfolio:
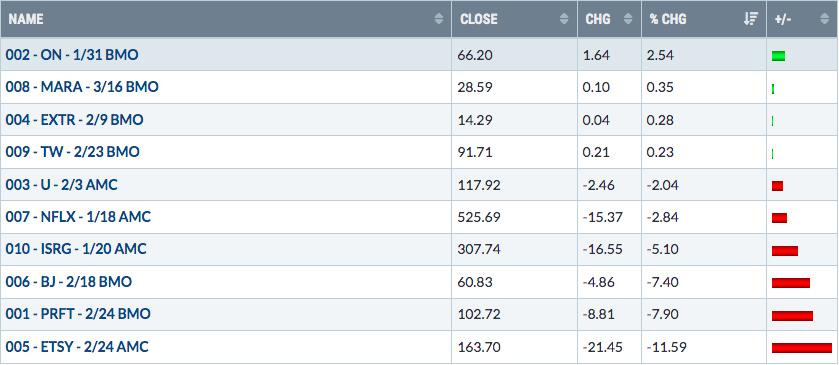
Here are how the Strong AD portfolio component stocks performed last week:
Earnings Reaction Portfolio:
The Earnings Reaction Portfolio fell 1.36%, trailing the S&P 500. Here's the updated inception-to-date chart of the portfolio:
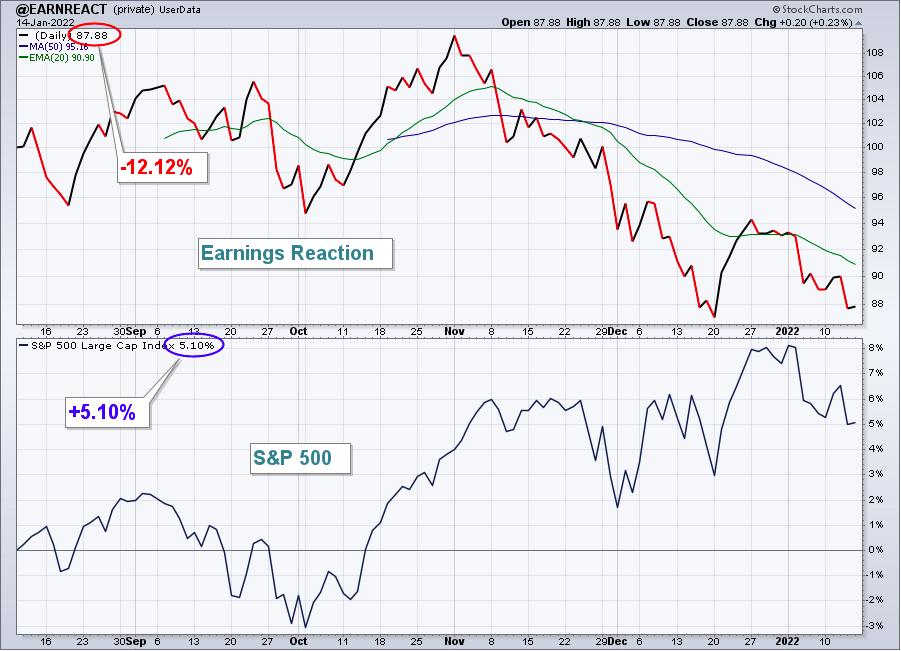
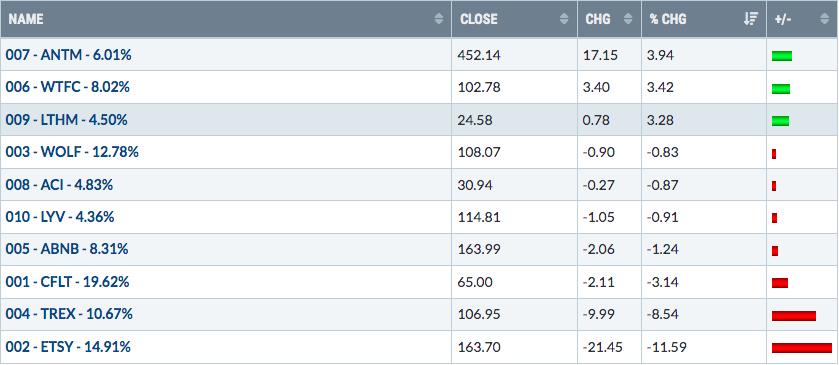
Here are how the Earnings Reaction portfolio component stocks performed last week:
Summary
This quarter has been, unfortunately, very similar to our February 19-May 19, 2021 quarter as growth stocks have mostly been shunned. We always compare our portfolios to the benchmark S&P 500, because, over time, our objective is to outperform this index. The pandemic-related rotation has been severe, however, resulting in very uneven performance. 2020 favored growth stocks and our portfolios did extremely well. 2021 (and into early 2022) has favored value stocks, so I thought I'd take the time to provide you returns since December 31, 2019 of our portfolios, along with several other key indices and ETFs to help you understand what we've been facing over the past year:
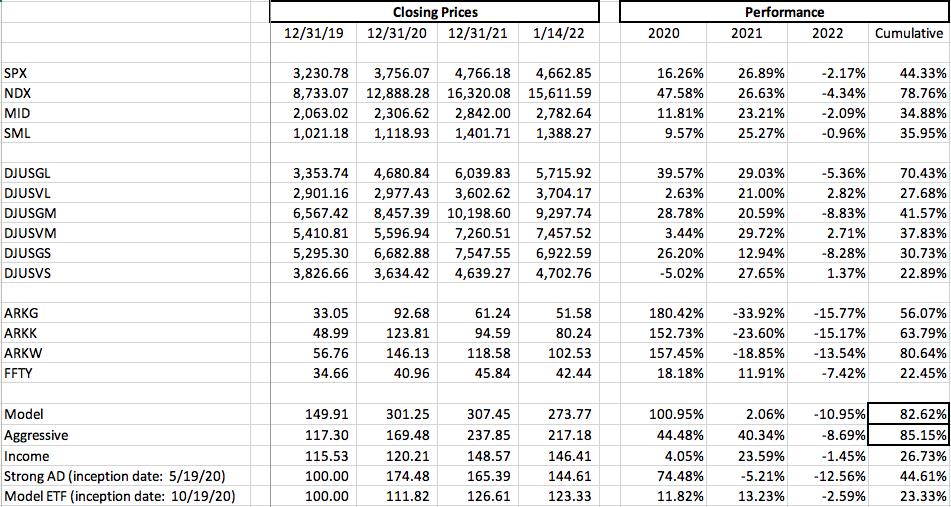
I've broken the above into 4 groups. The first group highlights the major index performance. The second group highlights the growth vs. value performance among large, mid, and small caps. The third group represents well-known growth ETFs. The fourth group highlights our portfolio performance. As you study these performance numbers, I think it becomes quite clear that the rotation between growth and value has a tremendous bearing on our results. Our Income and Model ETF portfolios are not as dependent on growth, especially our Income portfolio. But the others have shown significant outperformance when growth stocks are in favor, while the opposite is true during periods of value outperformance. We're off to a rough start in 2022 in our portfolios (other than Income), but the significant variance in growth and value stock performance helps to explain why.
Let me be very clear that I believe we're in a secular bull market that will last many years, but we'll go through periods where market themes will favor our portfolios and other times when they won't. We make our "theme" decisions once per quarter on February 19th, May 19th, August 19th, and November 19th. The reasoning behind these four dates is that most of earnings season is completed at this time. Given the secular bull market, we will generally favor growth stocks, knowing that we're subject to whipsaw market action. If there's one thing that I'm extremely proud of, it's the fact that our Model and Aggressive Portfolios have outperformed ALL other indices and ETFs reflected above over the cumulative period from January 1, 2020 through January 14, 2022. It's been a CRAZY period with a trade war, 100-year pandemic, surging inflation, and severe volatility and rotation. Yet we've managed to navigate it all. I do see the market behaving much more normally and rationally later in 2022, but we'll need to deal with more first, and possibly second, quarter rotation. It's the cards we've been dealt.
One last thing. Maybe this will help you in your investing and/or trading of our portfolio stocks. Here's a historical breakdown throughout the calendar year that highlights the relative performance of the S&P 500 Growth ETF (SPYG) vs. the S&P 500 Value ETF (SPYV):
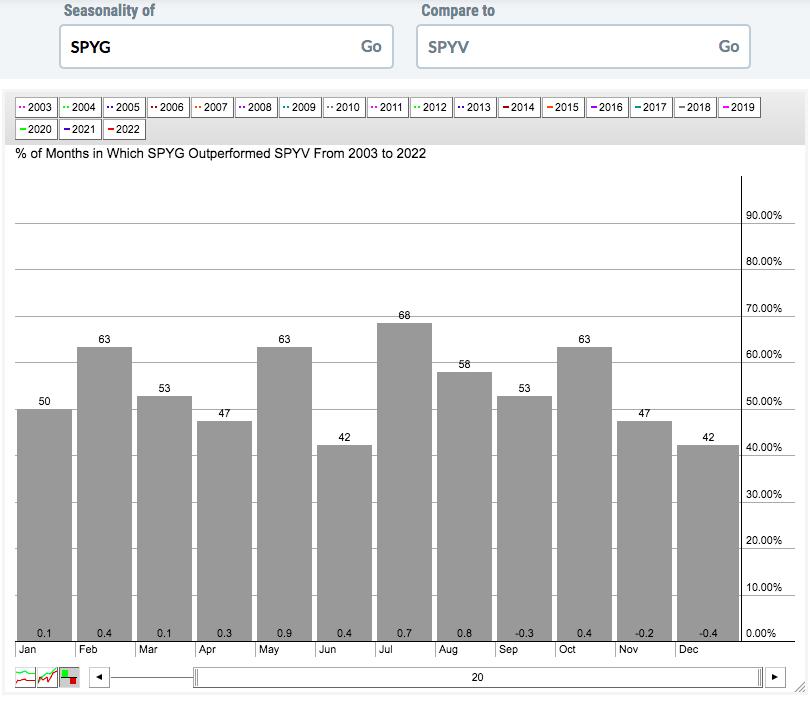
If you add the average growth outperformance (vs. value) for the first months of each calendar quarter (Jan, Apr, Jul, and Oct), and then do the same for the second months, and then the third months, it results in the following average outperformance:
- First calendar month of quarter (Jan, Apr, Jul, Oct): +0.8%
- Second calendar month of quarter (Feb, May, Aug, Nov): +1.9%
- Third calendar month of quarter (Mar, Jun, Sep, Dec): -0.2%
This analysis tells us that the second calendar month of each quarter tends to favor growth stocks significantly (we're heading into February in a couple weeks), while the third month (less earnings reports, quiet months) provides headwinds for growth stocks.
A second way to analyze the above seasonal pattern is to simply break it down by quarter as follows:
- 1st quarter (Jan through Mar): +0.6%
- 2nd quarter (Apr through Jun): +1.6%
- 3rd quarter (Jul through Sep): +1.2%
- 4th quarter (Oct through Dec): -0.2%
I find it VERY interesting that growth stocks tend to do best during most of the "Go Away in May" months from May through October. The media tells us to go away, while Wall Street buys growth stocks hand over fist. Nice (sarcasm)!
Anyhow, I hope this additional information provided helps you to better understand our portfolio design philosophy (growth stocks outperform over time) and why our portfolios have not performed better throughout much of 2021 and into the start of 2022. I see much better days ahead, but patience will be required as the current nasty rotation into more defensive and value-oriented investments continues.
Model ETF Portfolio
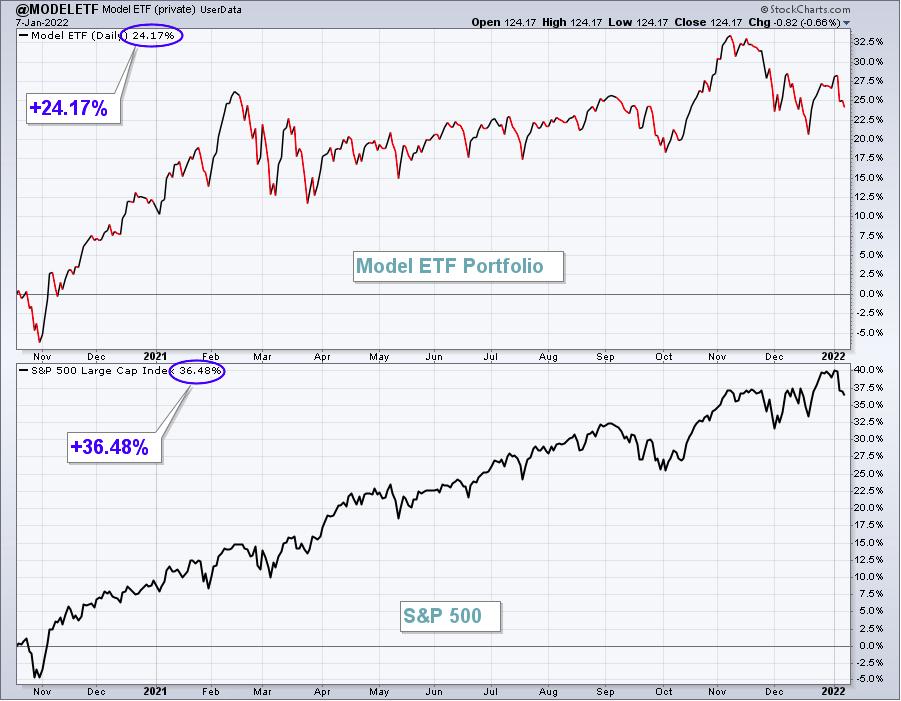
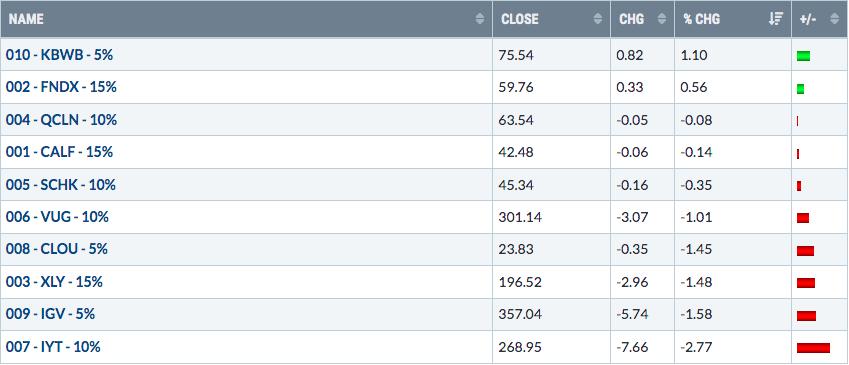
Our Model ETF Portfolio dropped 0.67% last week, lagging the benchmark S&P 500 slightly.
Here's the updated inception-to-date chart of the Model ETF Portfolio:
Here are how the Model ETF Portfolio component ETFs performed last week:
Happy trading!
Tom Bowley, Chief Market Strategist
EarningsBeats.com
"Better timing. Better trades."