
EB Weekly Portfolio Report - Sunday, February 13, 2022
Portfolio ChartLists Update
Earnings dates again had to be changed on several of our portfolio stocks. They've been corrected on all of our portfolios based on the latest earnings dates reflected on StockCharts.com. Just beware that if you're relying on the earnings dates reflected next to the ticker symbol in our ChartLists, you will need to re-download our portfolio ChartLists to ensure you have the latest dates provided by StockCharts.com. If the earnings dates are critical to your trading strategies, I would confirm all earnings dates with other sources like Zacks.com.
Upcoming Earnings Reports
According to Zacks.com, the following companies will be reporting earnings this week and each is a component of one of our portfolios:
Monday, February 14: None
Tuesday, February 15: ABNB
Wednesday, February 16: TTD, NVDA, CROX
Thursday, February 17: LTHM (e)
Friday, February 18: None
PLEASE NOTE: Any company above designated with "(e)" means that it's included in our Earnings Reaction Portfolio, which is a portfolio that we do not officially track at EarningsBeats.com. Still, we wanted to make sure you were aware of the upcoming earnings dates for those stocks as well. The above companies were provided using earnings dates provided by StockCharts.com. My research is limited to what StockCharts.com provides and I also can make a mistake from time to time, so please double check for earnings dates for all companies that you own from a reputable source like Zacks.com. We do hold our portfolio stocks through one earnings report, but every EarningsBeats.com member must make his/her own investing/trading decisions about holding stocks into earnings reports as it's the most volatile (risky) time to own a stock.
Portfolio Rules and Objectives
Here are the common traits and objectives of our portfolios:
- There are 10 leading stocks from up to 10 leading industries in each portfolio (at the time of selection). Generally, there will only be one stock per industry group, but there could be exceptions.
- They are held for an entire 90-day period, with no stops in place. We strive for consistency, transparency, and simplicity in our portfolios. EB.com members may hold these stocks for the entire 90 days, trade them, use stops, etc., but for purposes of our calculation, we will make no exceptions to our "buy and hold for three months" strategy.
- Every stock will generally be held through ONE earnings report
- The expectation is that relative winners will carry the portfolio to outperformance
- They were all entered into as of the close on Friday, November 19th; members may choose to try to time better entries, but EB.com "purchased" as of November 19th's closing price
- Primary objective is to outperform the benchmark S&P 500
Here are several considerations for EB members:
- I would expect the Strong AD and Aggressive portfolios to be the riskiest, followed by the Model portfolio, and then the Income portfolio
- The Strong AD portfolio will be selected from a combination of rising accumulation/distribution lines and SCTRs above 70 at the time of selection. It is the only portfolio that does NOT require a revenue and EPS beat in its most recent quarterly earnings report
- The Income portfolio stocks will all pay dividends, with the expected average dividend yield to be at least 1.0%
- Drawdowns (losses) should be much milder on the Income portfolio, with more volatility expected on the other three; please review inception-to-date charts below to gain an idea of the volatility associated with each
- I believe the larger drawdown on the Income portfolio at the beginning of the pandemic was an anomaly, occurring as many defensive, higher-yielding companies uncharacteristically underperformed during a market decline.
- Large drawdowns in the February through May 2021 period were due to the rapid rotation from growth stocks to value stocks; each quarter, our portfolios are based on themes and there is never a guarantee that our analysis and beliefs will be proven correct
- You should consider owning or trading these stocks in whatever manner is most comfortable for you; while we will buy all 10 stocks in the manner identified above, feel free to trade certain stocks or wait for pullbacks if the stocks are overbought
- We have no idea what risk each member is willing or able to take. We are not registered investment advisors so be sure you understand the risk you take. Please consult your financial advisor.
- EarningsBeats.com shareholders/employees may own all or some of the portfolio stocks from time to time.
Weekly Snapshot
Here's a weekly recap:
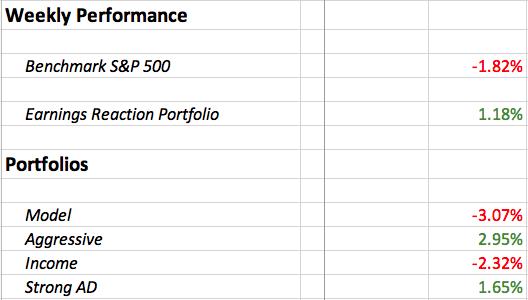
Weekly Summary
Benchmark S&P 500:
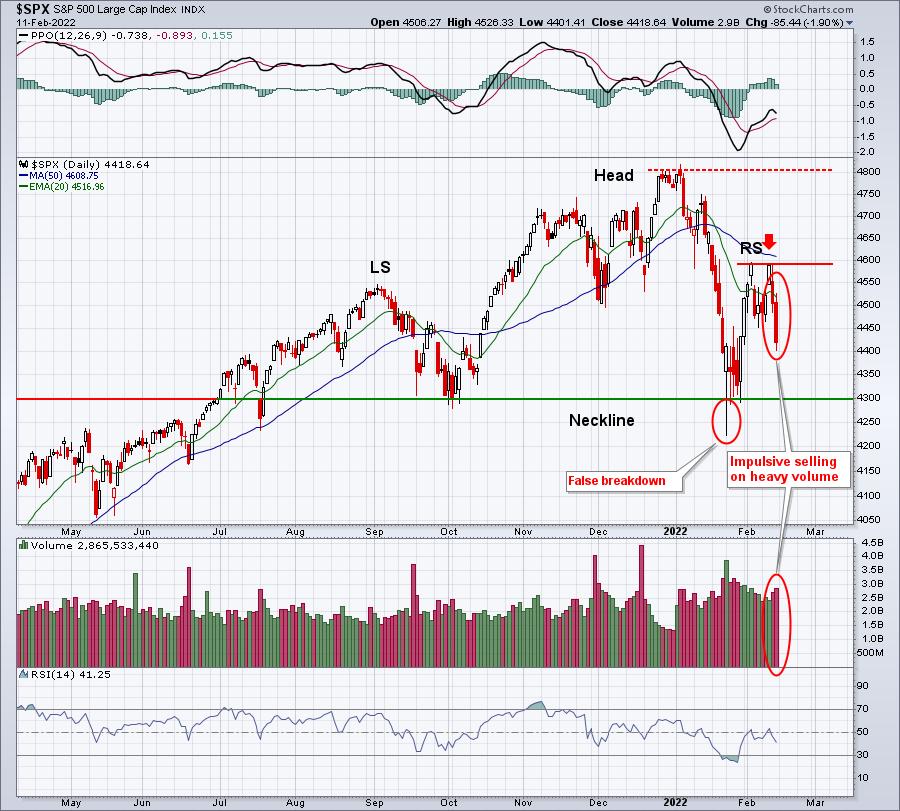
On the surface, the S&P 500 fell 1.82%, which may just seem like a bit of profit taking. However, it was the level from where it fell from and the make up of the fall that was particularly bearish. Failure occurred under the 50-day SMA and the right shoulder of the bearish head & shoulders pattern now appears complete:
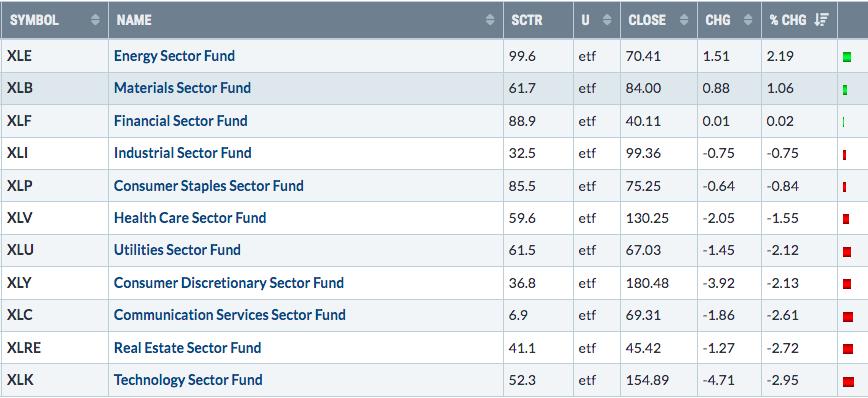
Growth stocks were hit hard, especially large cap growth stocks. While energy (XLE), materials (XLB), and financials (XLF) held up fairly well, the market wasn't so kind to the key aggressive sectors. Check out the weekly sector performance:
Within technology, every industry group struggled last week, except renewable energy ($DWCREE):
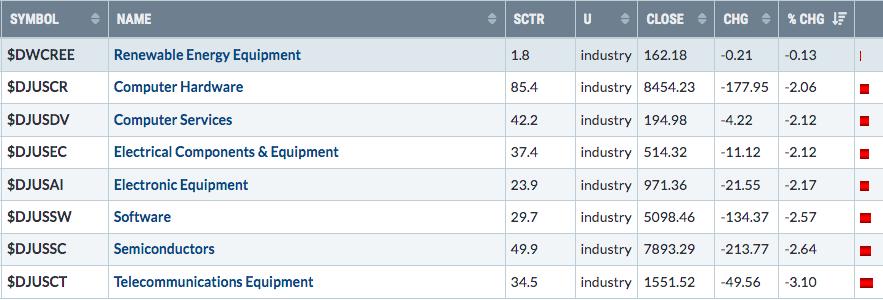
Keep in mind that most of these industries were up comfortably through Wednesday of last week. It was the massive selling on Thursday and Friday that completely reshaped the market.
Model Portfolio:
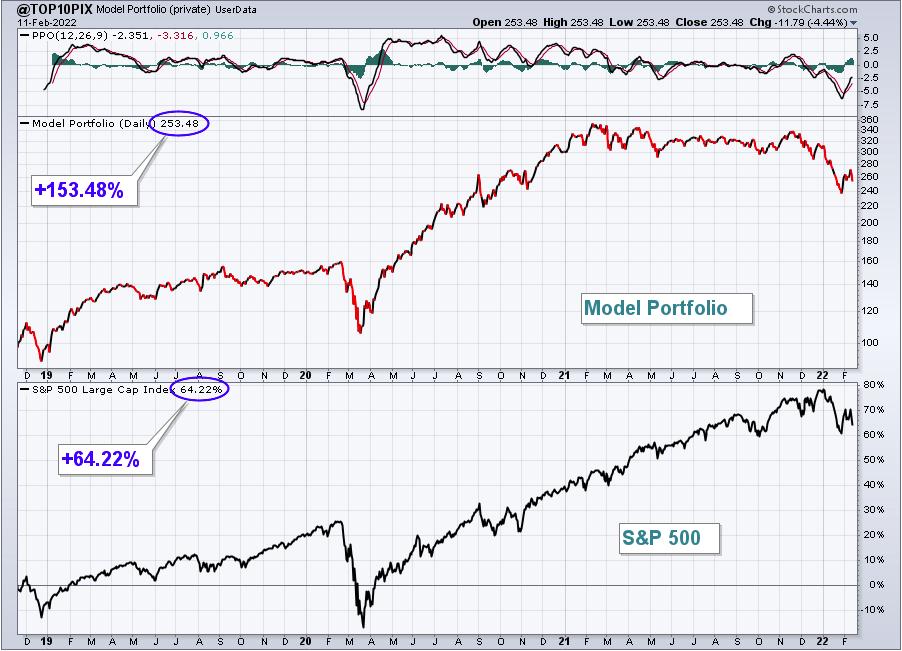
The Model Portfolio fell 3.07%, underperforming the S&P 500. Here's the updated inception-to-date chart of the portfolio:
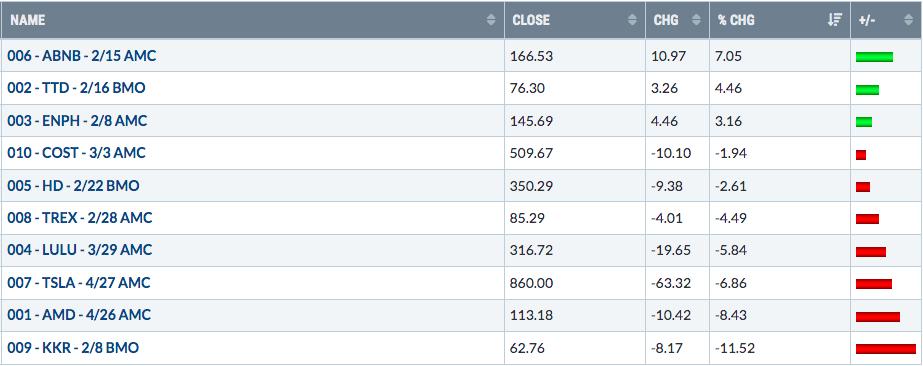
Here are how the Model portfolio component stocks performed last week:
Aggressive Portfolio:
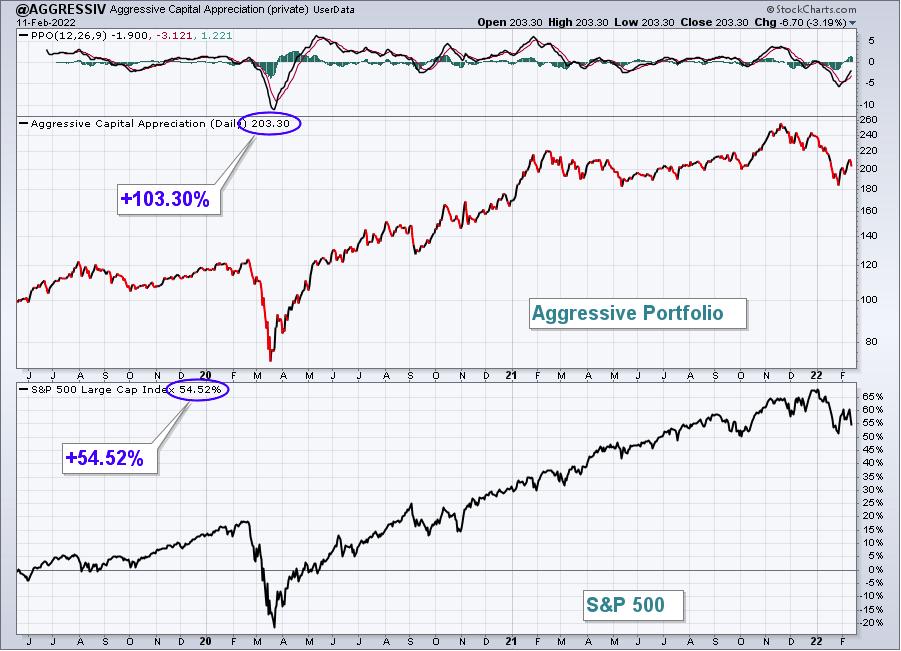
The Aggressive Portfolio jumped 2.95%, easily outdistancing the benchmark S&P 500. Here's the updated inception-to-date chart of the portfolio:
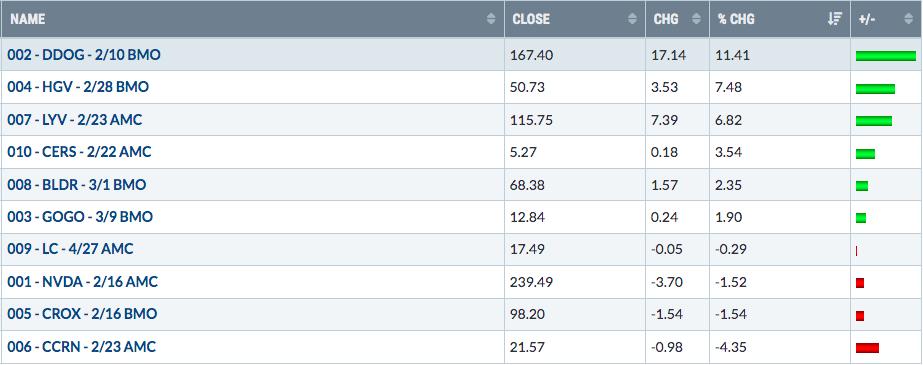
Here are how the Aggressive portfolio component stocks performed last week:
Income Portfolio:
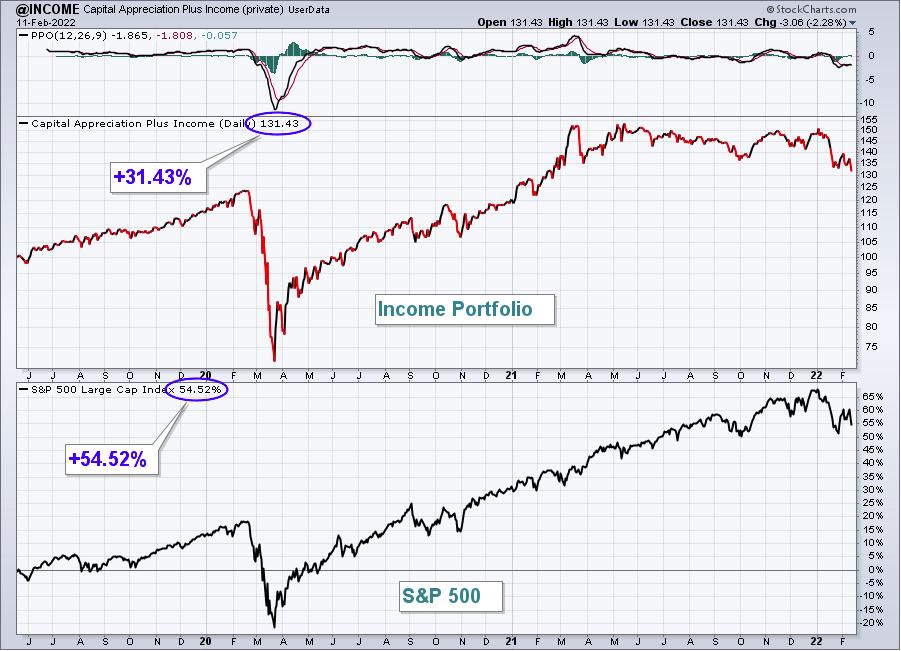
The Income Portfolio fell 2.32%, trailing the S&P 500 last week. Here's the updated inception-to-date chart of the portfolio:
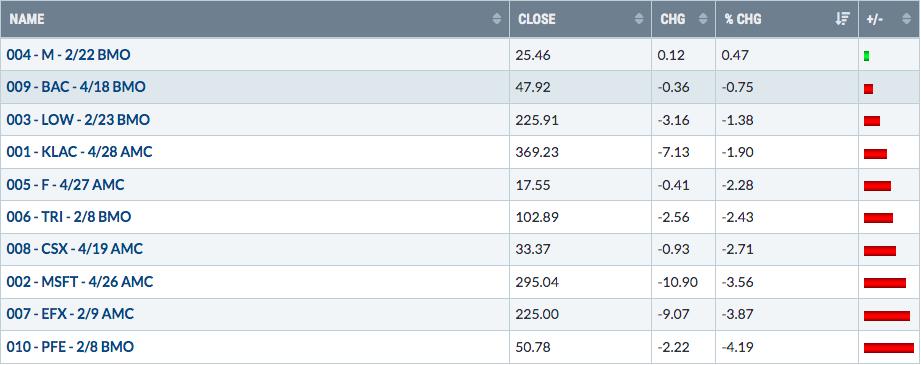
Here are how the Income portfolio component stocks performed last week:
Strong AD Portfolio:
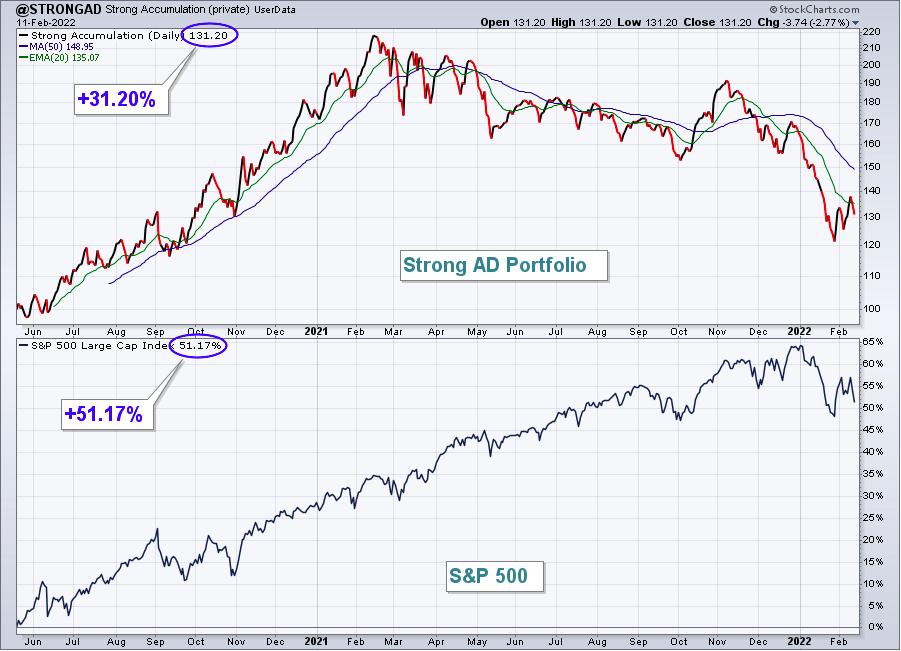
The Strong AD Portfolio climbed 1.65%, beating the S&P 500. Here's the updated inception-to-date chart of the portfolio:
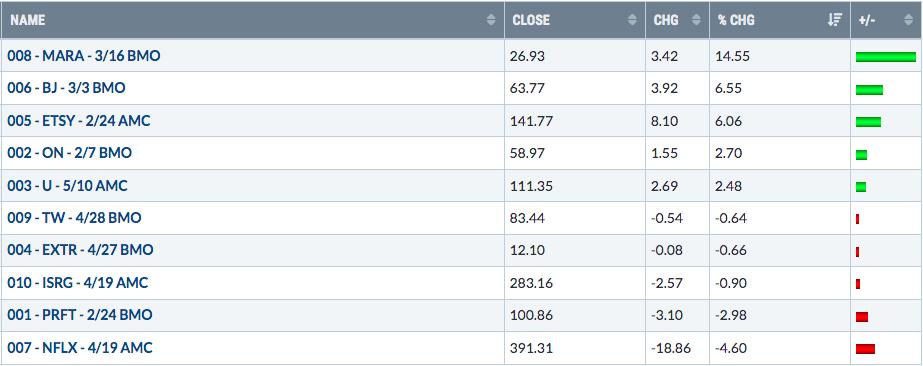
Here are how the Strong AD portfolio component stocks performed last week:
Earnings Reaction Portfolio:
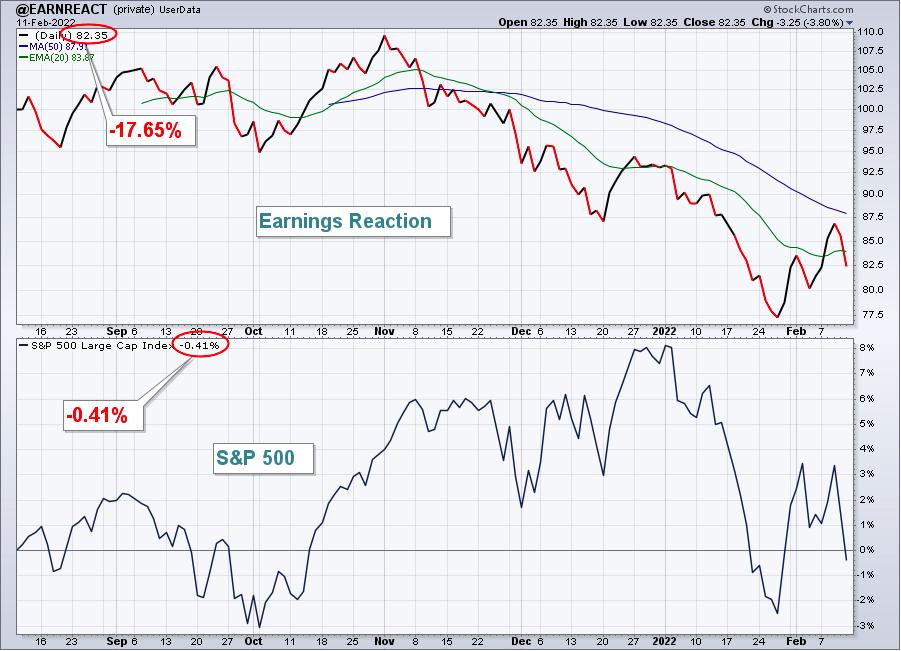
The Earnings Reaction Portfolio gained 1.18%, outperforming the S&P 500. Here's the updated inception-to-date chart of the portfolio:
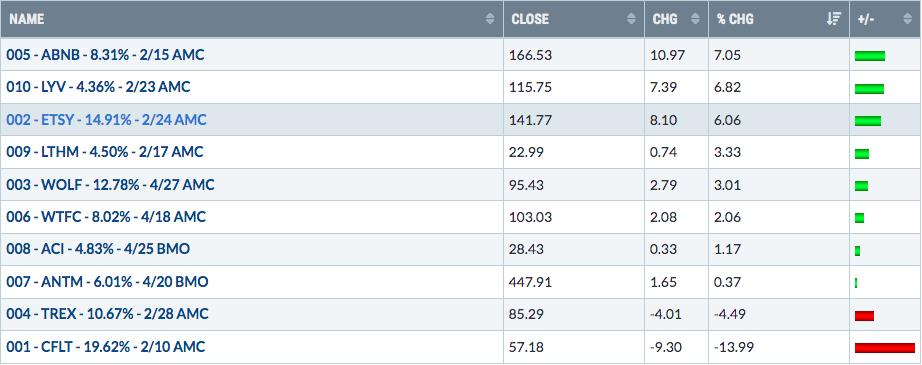
Here are how the Earnings Reaction portfolio component stocks performed last week:
Summary
The cyclical bear market is well underway, I'm convinced of that. For me to even consider thinking that this is just a correction, I'd need to see the S&P 500 close back above its 50-day SMA, which is roughly 4600. We will bounce along the way. Because the moves lower are impulsive and intense, we'll also see swift snapback recoveries from time to time. I'd be extremely careful chasing those moves. I'm perfectly fine right now with a long trade here or there, but an emphasis to the downside.
While much of the selling in growth stocks did little to sway the S&P 500 or NASDAQ, things have changed in February as we've already seen the most rotation AWAY from large cap growth ($DJUSGL) than at any point over the past year. This is a relative chart that I plan to feature in the EB Digest newsletter tomorrow morning and I think it sums up the big problem that our major indices face over the next several weeks:
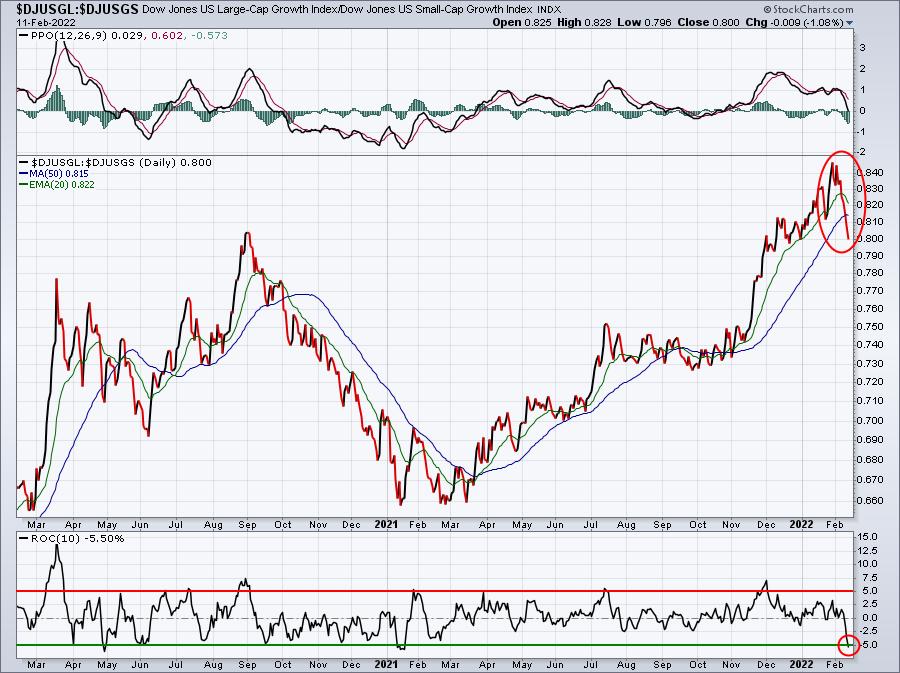
The relative weakness in large cap growth will take a considerable toll on the S&P 500 and NASDAQ, because these stocks are heavily weighted in those key indices. Stocks like AAPL, MSFT, GOOGL, TSLA, FB, NVDA, and ADBE are breaking down or have already broken down. Energy (XLE) and financials (XLF) do not have enough weighting in our key indices to make a difference. The growth stocks mentioned, however, could result in SIGNIFICANT technical damage to the major indices. We need to remain extremely cautious as this cyclical bear market gains a greater foothold.
Model ETF Portfolio
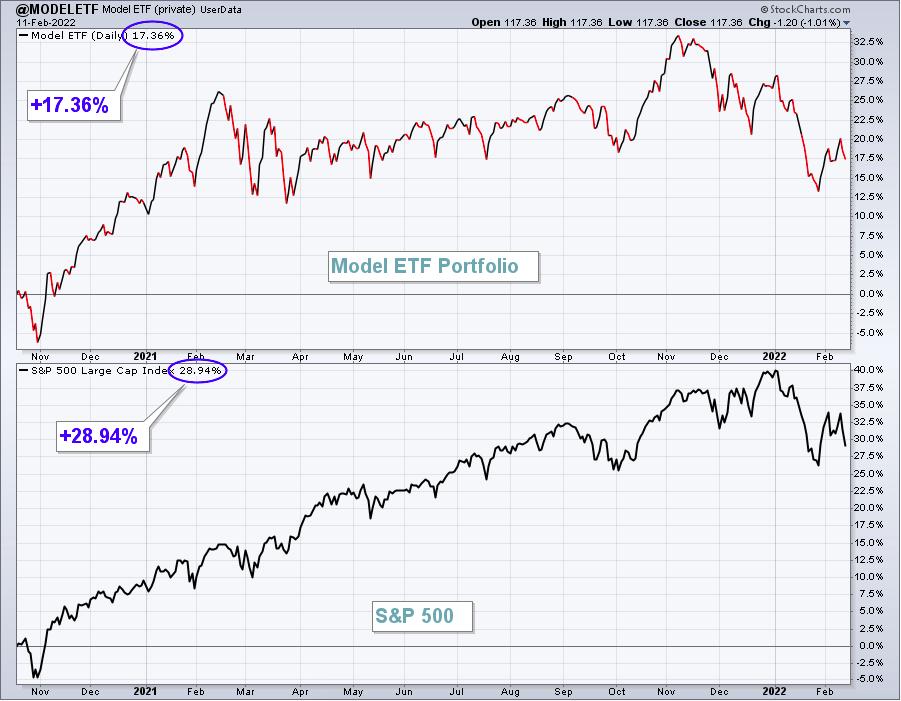
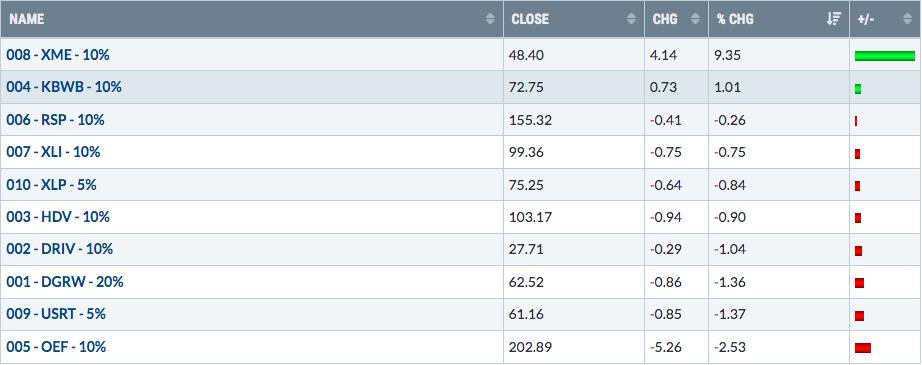
Our Model ETF Portfolio gained 0.08% last week, easily outperforming the benchmark S&P 500.
Here's the updated inception-to-date chart of the Model ETF Portfolio:
Here are how the Model ETF Portfolio component ETFs performed last week:
Happy trading!
Tom Bowley, Chief Market Strategist
EarningsBeats.com
"Better timing. Better trades."