
EB Weekly Portfolio Report - Sunday, February 27, 2022
Upcoming Earnings Reports
According to Zacks.com, the following companies will be reporting earnings this week and each is a component of one of our portfolios:
Monday, February 28: None
Tuesday, March 1: None
Wednesday, March 2: None
Thursday, March 3: TD
Friday, March 4: None
PLEASE NOTE: The above companies were provided using earnings dates provided by StockCharts.com. My research is limited to what StockCharts.com provides and I also can make a mistake from time to time, so please double check for earnings dates for all companies that you own from a reputable source like Zacks.com. We do hold our portfolio stocks through one earnings report, but every EarningsBeats.com member must make his/her own investing/trading decisions about holding stocks into earnings reports as it's the most volatile (risky) time to own a stock.
Portfolio Rules and Objectives
Here are the common traits and objectives of our portfolios:
- There are 10 leading stocks from up to 10 leading industries in each portfolio (at the time of selection). Generally, there will only be one stock per industry group, but there could be exceptions.
- They are held for an entire 90-day period, with no stops in place. We strive for consistency, transparency, and simplicity in our portfolios. EB.com members may hold these stocks for the entire 90 days, trade them, use stops, etc., but for purposes of our calculation, we will make no exceptions to our "buy and hold for three months" strategy.
- Every stock will generally be held through ONE earnings report
- The expectation is that relative winners will carry the portfolio to outperformance
- They were all entered into as of the close on Friday, February 18th; members may choose to try to time better entries, but EB.com "purchased" as of February 18th's closing prices
- Primary objective is to outperform the benchmark S&P 500 over time; quarter-to-quarter performance can be extremely volatile, especially if significant rotation takes place intra-quarter
Here are several considerations for EB members:
- I would expect the Aggressive, Strong AD, and Earnings Reactions portfolios to be the riskiest, followed by the Model portfolio, and then the Income portfolio
- The Strong AD portfolio will be selected from a combination of rising accumulation/distribution lines and SCTRs above 70 at the time of selection. The Earnings Reactions portfolio is based on strong accumulation the day after its quarterly earnings are released and solid relative strength (vs. its peers). These are the only two portfolios that do NOT require revenue and EPS beats in their most recent quarterly earnings reports
- The Income portfolio stocks will all pay dividends, with the expected average dividend yield to be at least 1.0%
- Drawdowns (losses) should be much milder on the Income portfolio, with more volatility expected on the other four; please review inception-to-date charts below to gain an idea of the volatility associated with each
- I believe the larger drawdown on the Income portfolio at the beginning of the pandemic was an anomaly, occurring as many defensive, higher-yielding companies uncharacteristically underperformed during a market decline.
- Large drawdowns in the February through May 2021 and the November 2021 to February 2022 periods were due to the rapid rotation from growth stocks to value stocks; each quarter, our portfolios are based on themes and there is never a guarantee that our analysis and beliefs will be proven correct
- You should consider owning or trading these stocks in whatever manner is most comfortable for you; while we will buy all 10 stocks in the manner identified above, feel free to trade certain stocks or wait for pullbacks if the stocks are overbought
- We have no idea what risk each member is willing or able to take. We are not registered investment advisors so be sure you understand the risk you take. Please consult your financial advisor.
- EarningsBeats.com shareholders/employees may own all or some of the portfolio stocks from time to time.
Weekly Snapshot
Here's a weekly recap:
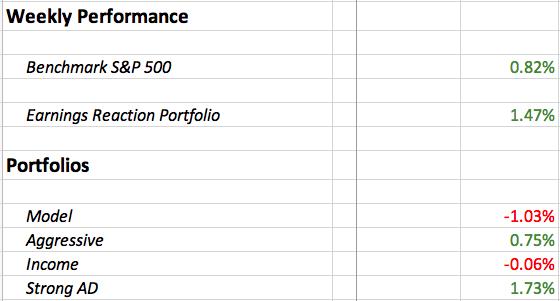
Weekly Summary
Benchmark S&P 500:
Wow, it was a crazy week! On Thursday, February 17th, the S&P 500 closed at 4380.26. On Friday, just 8 days later, we saw the S&P 500 close at 4384.65, 4 points higher. Pretty boring, right? Well, except for the 266-point decline, followed by the 270-point recovery! That's 6% down and 6% up. When we see the Volatility Index ($VIX) in the 30s, this is the type of market behavior we should expect. If you can time the ups and downs perfectly, you can make a years' worth of return in a week. But if your timing is bad....
On Friday morning, I sent out a Special Report. If you haven't read it, you probably should. Cyclical bear markets can be brutal with the big selloffs followed by big, but false, rallies. It's too early to tell if this is a false rally, but I believe it will turn out to be that. After all the back and forth last week, did you see the weekly sector leaderboard? Check this out:
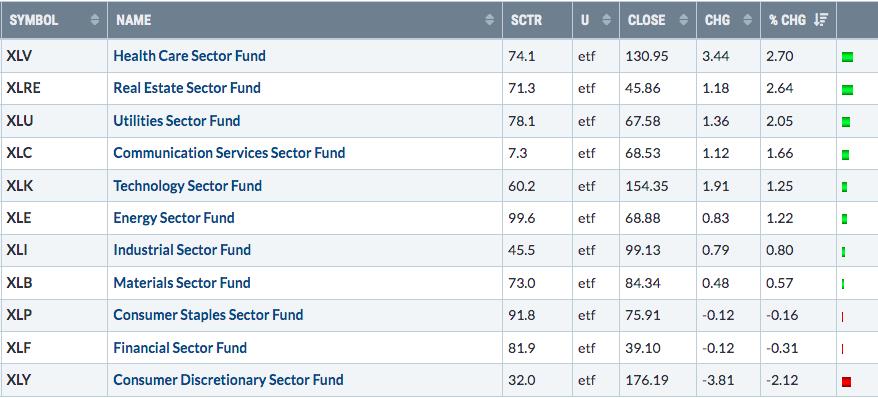
Leadership from health care (XLV), real estate (XLRE), and utilities (XLU) - three defensive groups. If the end of the selling arrived, someone forgot to send Wall Street the memo. Listen, I have no problem with anyone buying key growth stocks during the selling, because timing the EXACT bottom is never easy. Building positions systematically during a cyclical bear market makes a ton of sense to me. No one is going to announce when the last seller is here, though we will try at EB.
Model Portfolio:
The Model Portfolio fell 1.03%, trailing the benchmark S&P 500. Here's the updated inception-to-date chart of the portfolio:
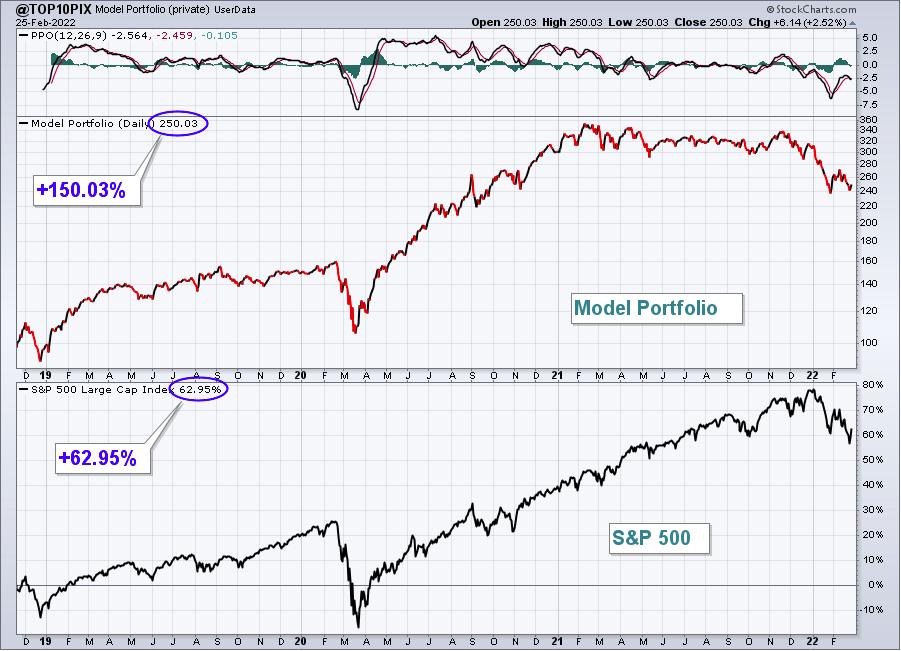
Here are how the Model portfolio component stocks performed last week:
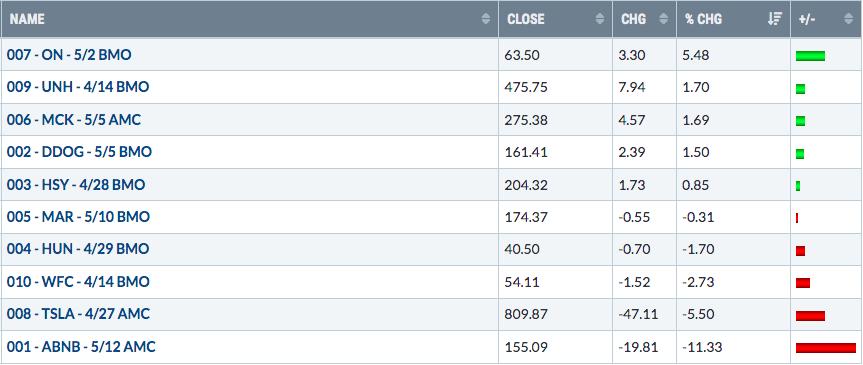
ABNB was hit hardest in the Model Portfolio last week and, while it's likely to remain extremely volatile in the short-term, I'd watch major price support near the 130 level:
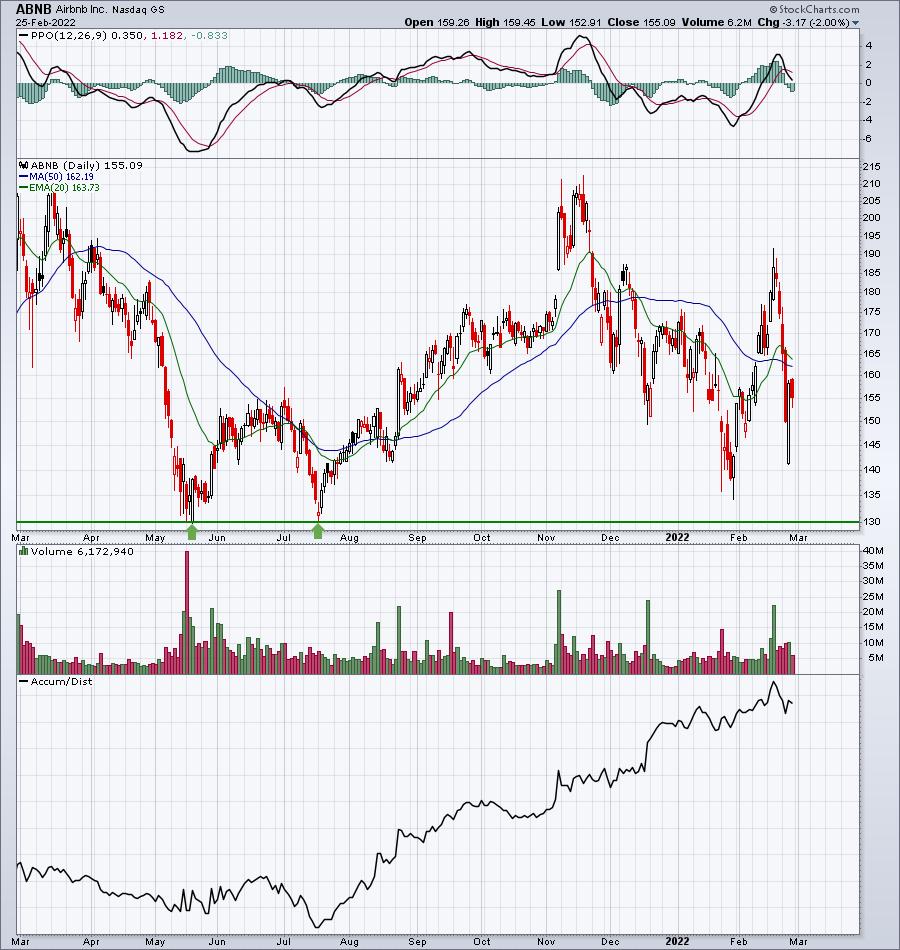
One big positive for ABNB is the still-strong AD line that suggests to me that Wall Street is more than happy to accumulate on weakness. That should bode well for ABNB in time.
Aggressive Portfolio:
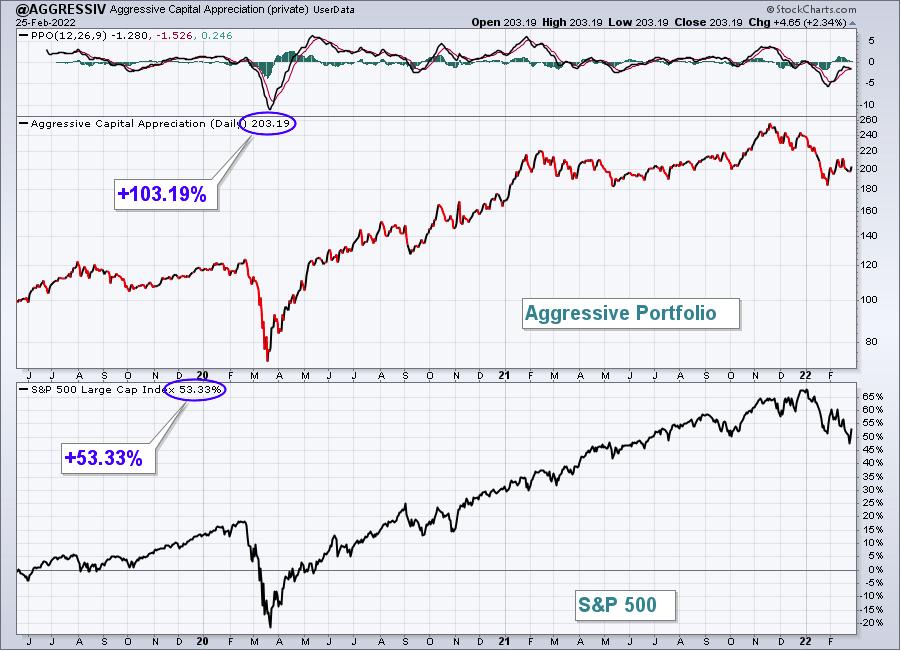
The Aggressive Portfolio gained 0.75%, essentially tracking the S&P 500 last week. Here's the updated inception-to-date chart of the portfolio:
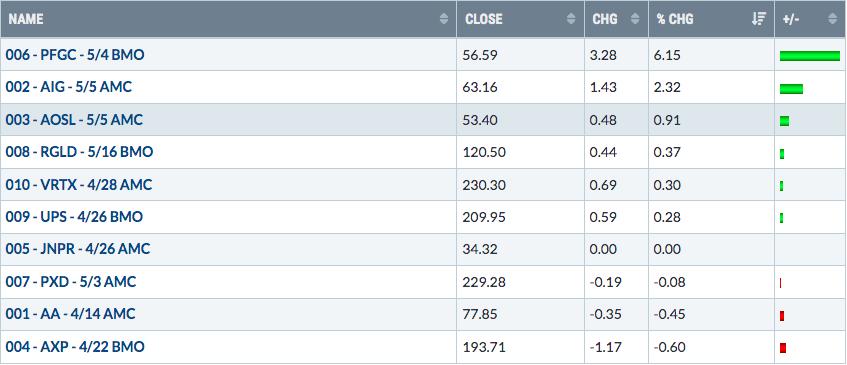
Here are how the Aggressive portfolio component stocks performed last week:
PFGC, a consumer staple stock, bounced beautifully after nearing its rising 20-day EMA:
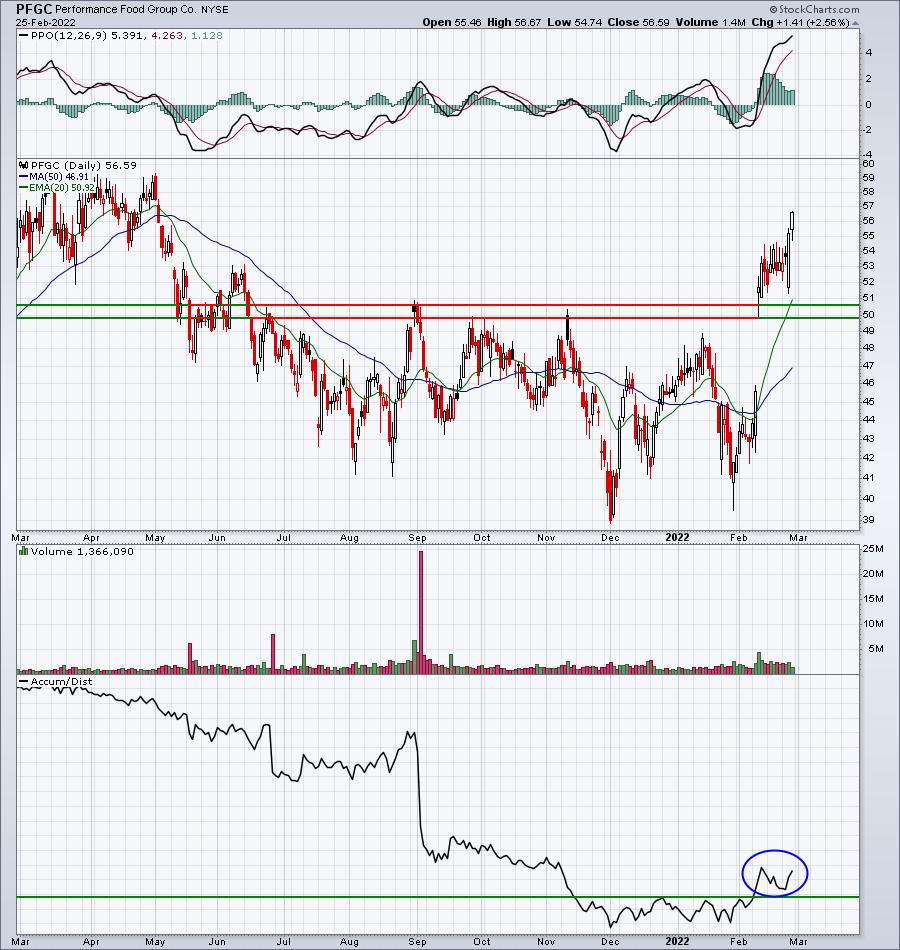
The AD line is improving significantly as price action has surged. I see higher prices ahead, with potential 20-day EMA tests along the way.
Income Portfolio:
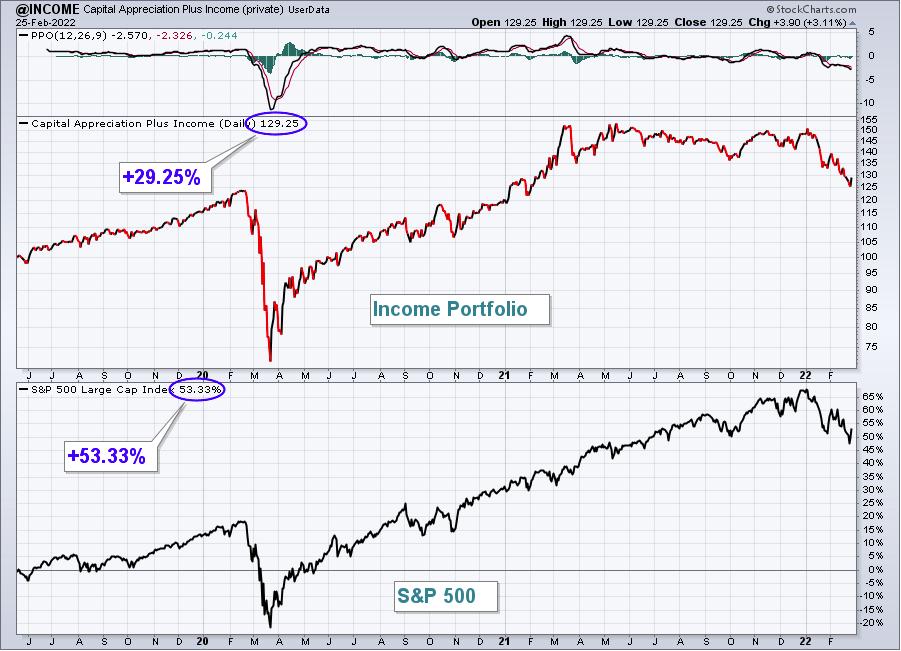
The Income Portfolio dropped 0.06%, failing to keep pace with the S&P 500. Here's the updated inception-to-date chart of the portfolio:
Here are how the Income portfolio component stocks performed last week:
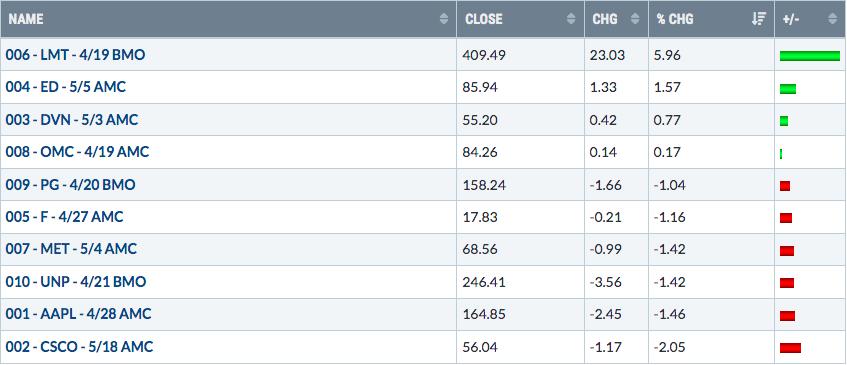
Defense stocks ($DJUSDN) have surged over the past two months on both an absolute and relative basis and that's certainly aided stocks like Lockheed Martin (LMT), which had another big week last week:
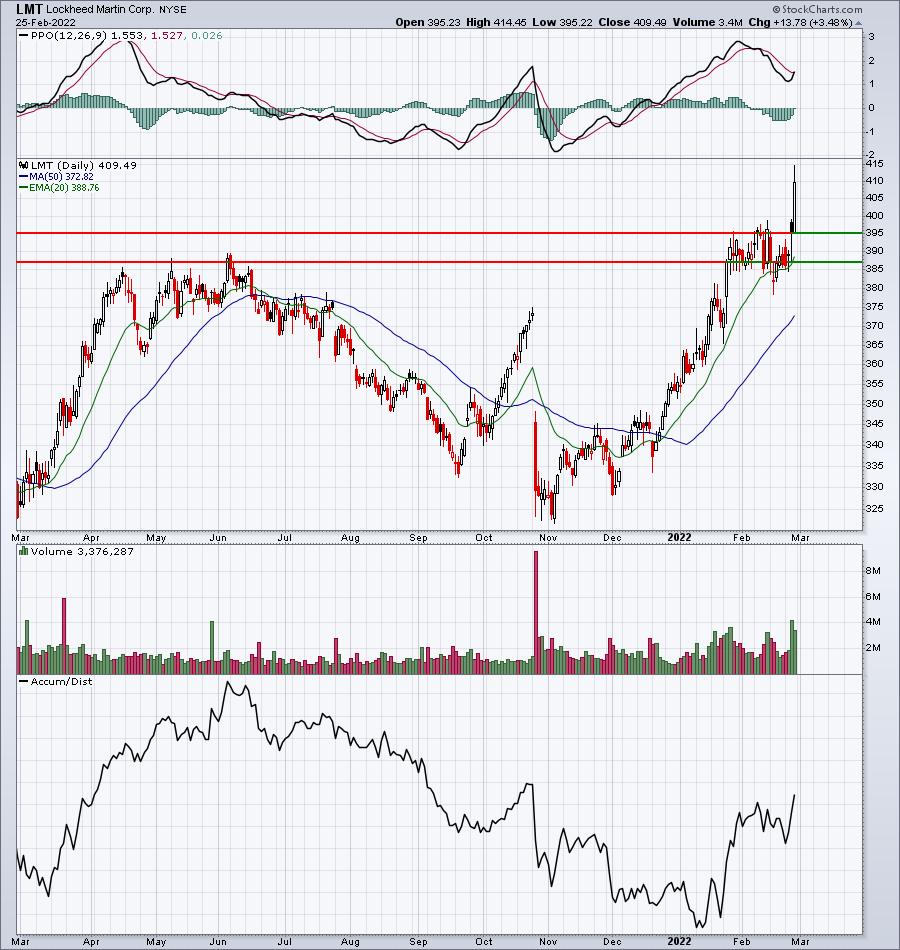
The Russia-Ukraine conflict is likely putting the defense group in the spotlight right now, but fundamentally-strong earnings reports are not hurting either. LMT would most definitely benefit from a rising defense budget amidst the current Russian conflict and current technical indicators support higher prices as well.
Strong AD Portfolio:
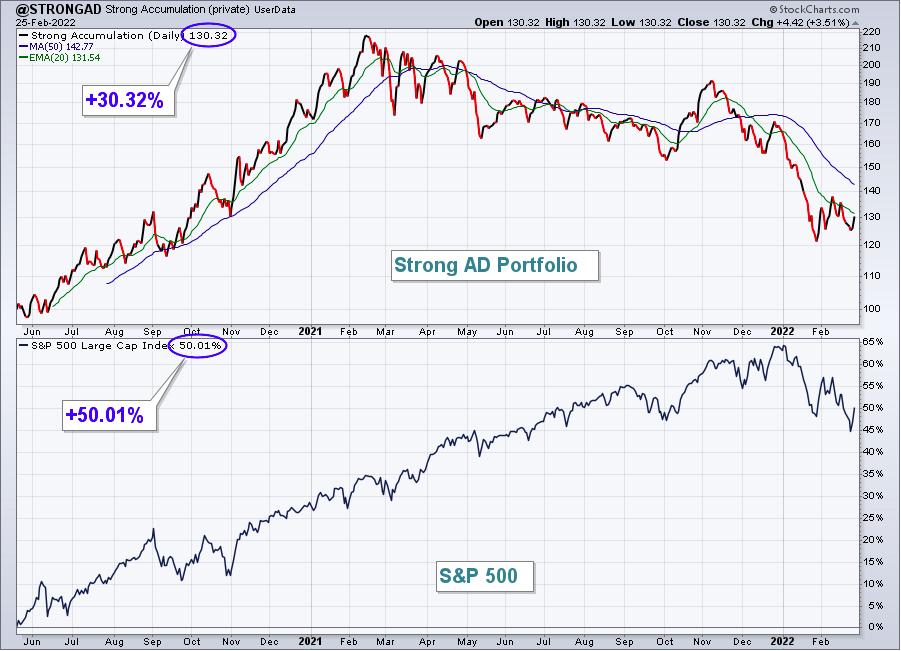
The Strong AD Portfolio jumped 1.73%, outdistancing the S&P 500 last week. Here's the updated inception-to-date chart of the portfolio:
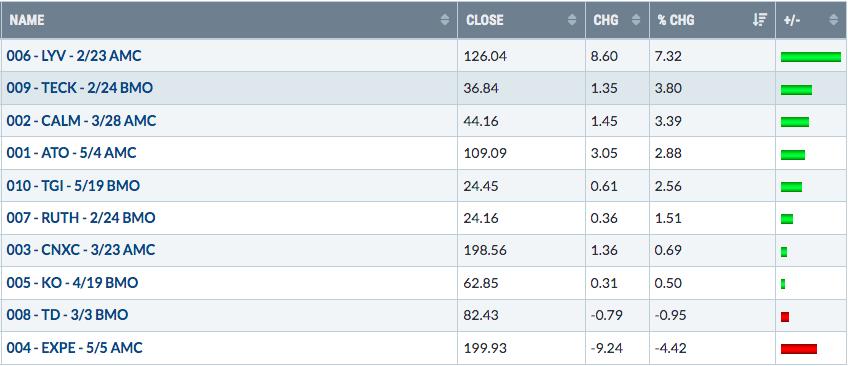
Here are how the Strong AD portfolio component stocks performed last week:
Big earnings, big volume, and a big breakout lifted LYV last week:
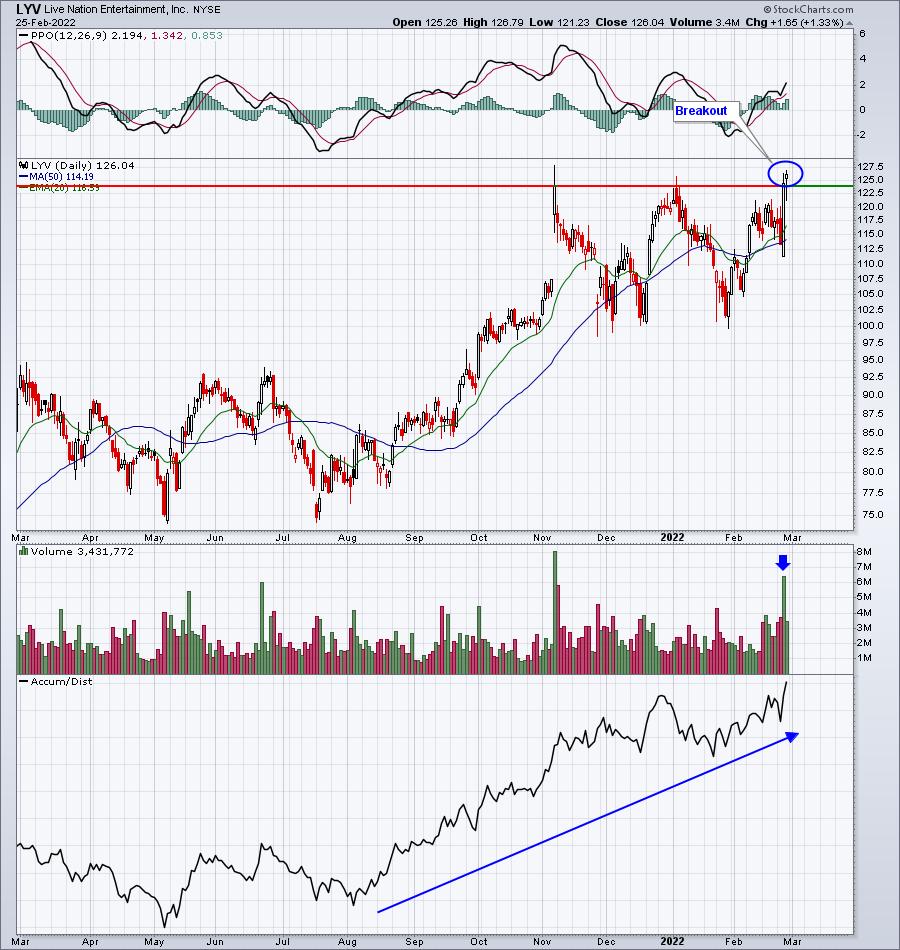
That's a massive hollow candle on very heavy volume after LYV reported quarterly results last week. LYV missed its earnings estimate, but easily sailed past quarterly revenue estimates. After gapping lower following its results, LYV surged higher to a fresh all-time high close. There is still overhead resistance in the form of a prior intraday high from November 2021 and, given the potential market volatility ahead, I wouldn't be surprised to see LYV struggle as its growth prospects will be limited while the stock market considers higher interest rates.
Earnings Reaction Portfolio:
The Earnings Reaction Portfolio climbed 1.47%, also outpacing the benchmark S&P 500. Here's the updated inception-to-date chart of the portfolio:
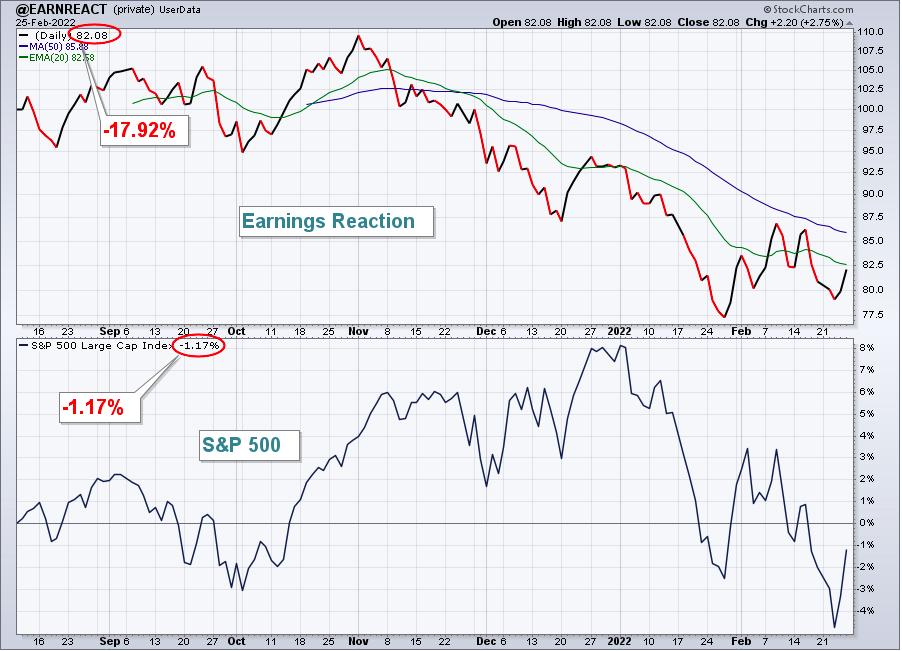
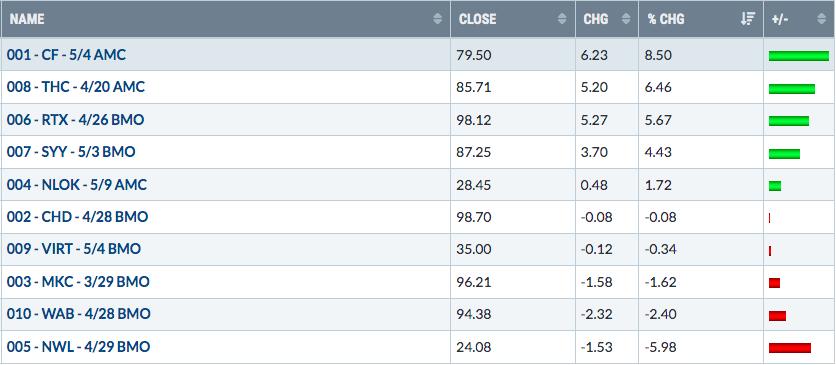
Here are how the Earnings Reaction portfolio component stocks performed last week:
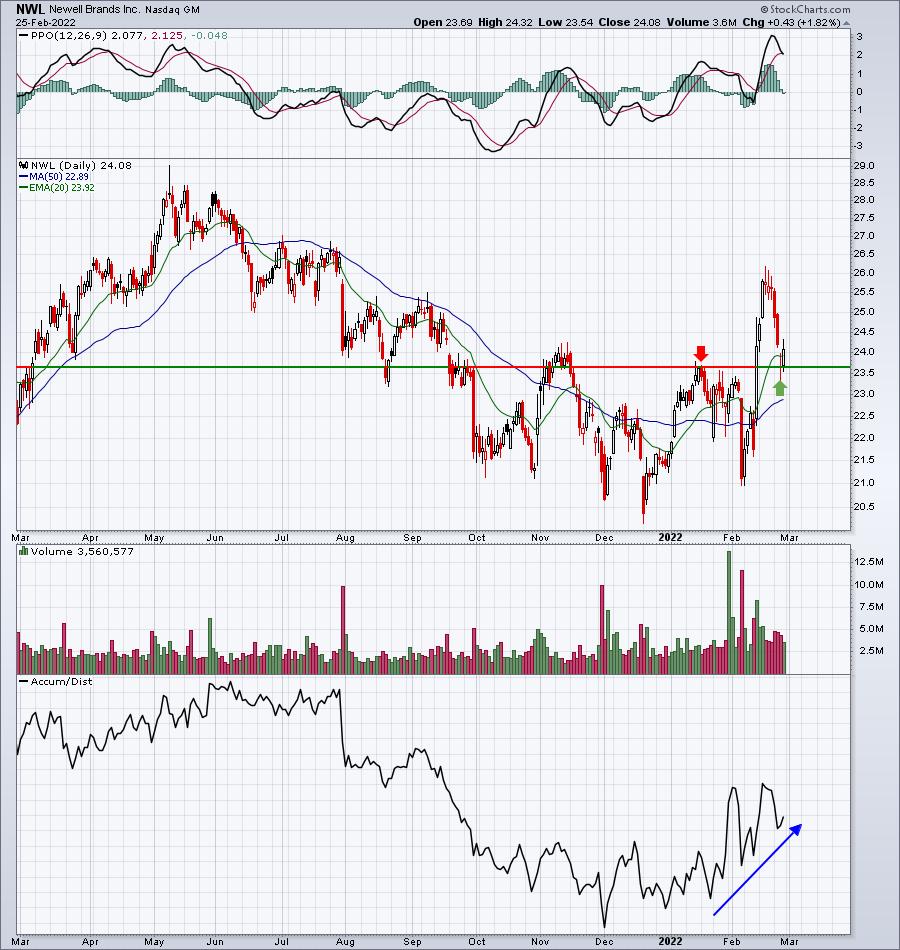
NWL would seem to be poised for a short-term recovery after testing the level of its recent breakout and dropping briefly beneath its rising 20-day EMA:
Summary
It was a very nice recovery and perhaps the bottom is in. I don't believe so, but I'm certainly not always right. The strength in defensive sectors last week to drive prices higher wasn't the most encouraging sign of a bottom, but I've seen stranger things happen.
Next week features the last trading day of the calendar month (Monday is February 28th), then we have the first few days of March, which typically is a bullish period historically. Will it matter? Maybe. Maybe not. March 1st through March 5th has produced annualized returns of +41.02% since 1950. But it does have down periods as well. So while the historical trend would point to additional strength this week, there are never any guarantees.
Personally, I plan to use any strength to build positions in inverse index ETFs (eg, QID, SDS, etc). This strategy, however, is not appropriate for everyone. I would simply say to remain quite cautious given the current market environment as the odds point to further weakness ahead before a more meaningful and sustainable rally can occur - just my two cents.
Model ETF Portfolio
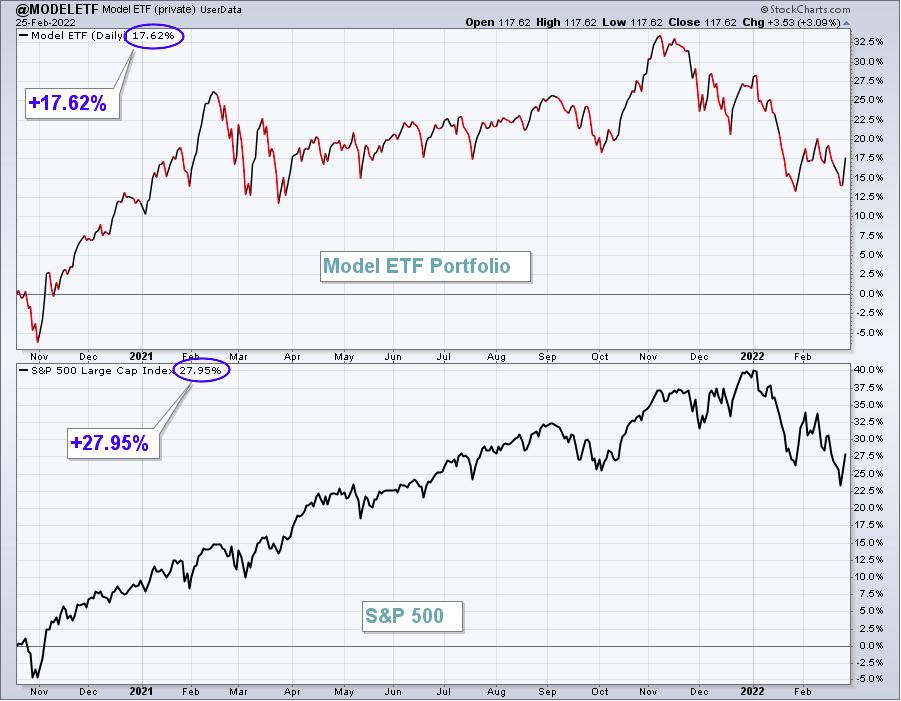
Our Model ETF Portfolio gained 0.73% last week, underperforming the S&P 500 by a very slim margin.
Here's the updated inception-to-date chart of the Model ETF Portfolio:
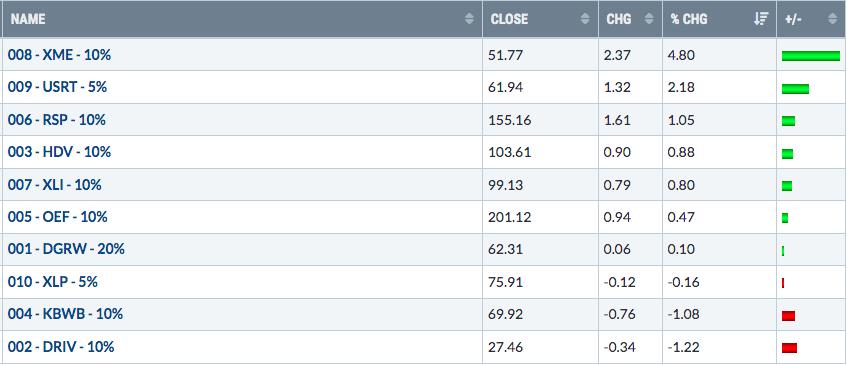
Here are how the Model ETF Portfolio component ETFs performed last week:
Happy trading!
Tom Bowley, Chief Market Strategist
EarningsBeats.com
"Better timing. Better trades."