
EB Weekly Portfolio Report - Sunday, March 25, 2022
Upcoming Earnings Reports
According to Zacks.com, the following companies will be reporting earnings this week and each is a component of one of our portfolios:
Monday, March 28: None
Tuesday, March 29: MKC, CALM
Wednesday, March 30: None
Thursday, March 31: None
Friday, April 1: None
PLEASE NOTE: The above companies were provided using earnings dates provided by StockCharts.com. My research is limited to what StockCharts.com provides and I also can make a mistake from time to time, so please double check for earnings dates for all companies that you own from a reputable source like Zacks.com. We do hold our portfolio stocks through one earnings report, but every EarningsBeats.com member must make his/her own investing/trading decisions about holding stocks into earnings reports as it's the most volatile (risky) time to own a stock.
Portfolio Rules and Objectives
Here are the common traits and objectives of our portfolios:
- There are 10 leading stocks from up to 10 leading industries in each portfolio (at the time of selection). Generally, there will only be one stock per industry group, but there could be exceptions.
- They are held for an entire 90-day period, with no stops in place. We strive for consistency, transparency, and simplicity in our portfolios. EB.com members may hold these stocks for the entire 90 days, trade them, use stops, etc., but for purposes of our calculation, we will make no exceptions to our "buy and hold for three months" strategy.
- Every stock will generally be held through ONE earnings report
- The expectation is that relative winners will carry the portfolio to outperformance
- They were all entered into as of the close on Friday, February 18th; members may choose to try to time better entries, but EB.com "purchased" as of February 18th's closing prices
- Primary objective is to outperform the benchmark S&P 500 over time; quarter-to-quarter performance can be extremely volatile, especially if significant rotation takes place intra-quarter
Here are several considerations for EB members:
- I would expect the Aggressive, Strong AD, and Earnings Reactions portfolios to be the riskiest, followed by the Model portfolio, and then the Income portfolio
- The Strong AD portfolio will be selected from a combination of rising accumulation/distribution lines and SCTRs above 70 at the time of selection. The Earnings Reactions portfolio is based on strong accumulation the day after its quarterly earnings are released and solid relative strength (vs. its peers). These are the only two portfolios that do NOT require revenue and EPS beats in their most recent quarterly earnings reports
- The Income portfolio stocks will all pay dividends, with the expected average dividend yield to be at least 1.0%
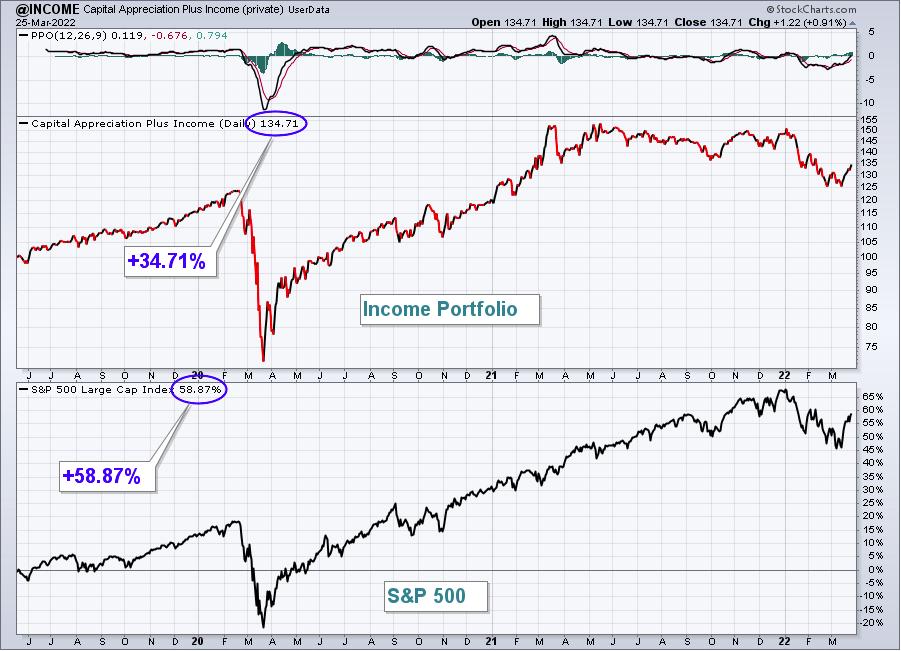
- Drawdowns (losses) should be much milder on the Income portfolio, with more volatility expected on the other four; please review inception-to-date charts below to gain an idea of the volatility associated with each
- I believe the larger drawdown on the Income portfolio at the beginning of the pandemic was an anomaly, occurring as many defensive, higher-yielding companies uncharacteristically underperformed during a market decline.
- Large drawdowns in the February through May 2021 and the November 2021 to February 2022 periods were due to the rapid rotation from growth stocks to value stocks; each quarter, our portfolios are based on themes and there is never a guarantee that our analysis and beliefs will be proven correct
- You should consider owning or trading these stocks in whatever manner is most comfortable for you; while we will buy all 10 stocks in the manner identified above, feel free to trade certain stocks or wait for pullbacks if the stocks are overbought
- We have no idea what risk each member is willing or able to take. We are not registered investment advisors so be sure you understand the risk you take. Please consult your financial advisor.
- EarningsBeats.com shareholders/employees may own all or some of the portfolio stocks from time to time.
Weekly Snapshot
Here's a weekly recap:
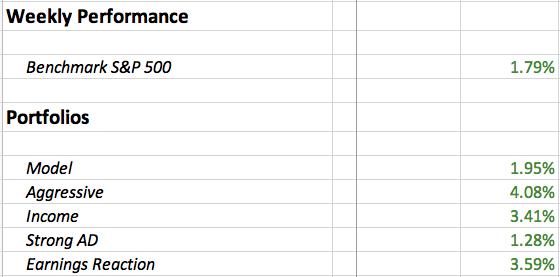
Weekly Summary
Benchmark S&P 500:
With max pain in the rear view mirror, the benchmark S&P 500 displayed bull market resiliency and pushed to fresh new highs, moving closer and closer to a MAJOR overhead price resistance level - one where we saw a double top in early February. This level marks major resistance as downtrends consist of lower highs and lower lows. If the S&P 500 clears 4600 on a closing basis, it will have ended that downtrend:
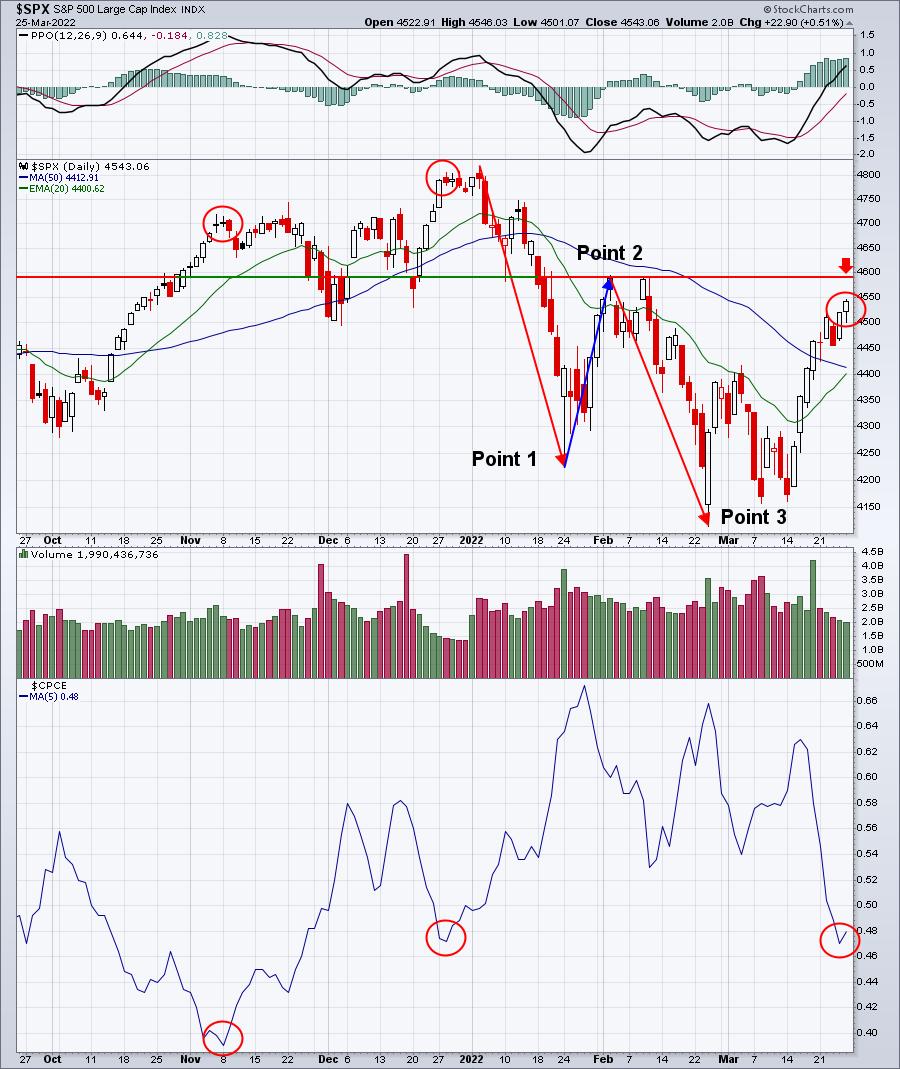
This was a chart I featured in my ChartWatchers article this weekend, "Is This Bear Market Rally Ending? These 2 Charts Will Tell Us". It highlights the bullishness in the options world as the 5-day moving average of the equity-only put call ratio ($CPCE) has fallen to a level where we've seen recent market tops form. You can also see the double top from February close to that 4600 level. The red arrow illustrates the level that the bulls need to negotiate in order to reverse the current 2022 downtrend in play.
Model Portfolio:
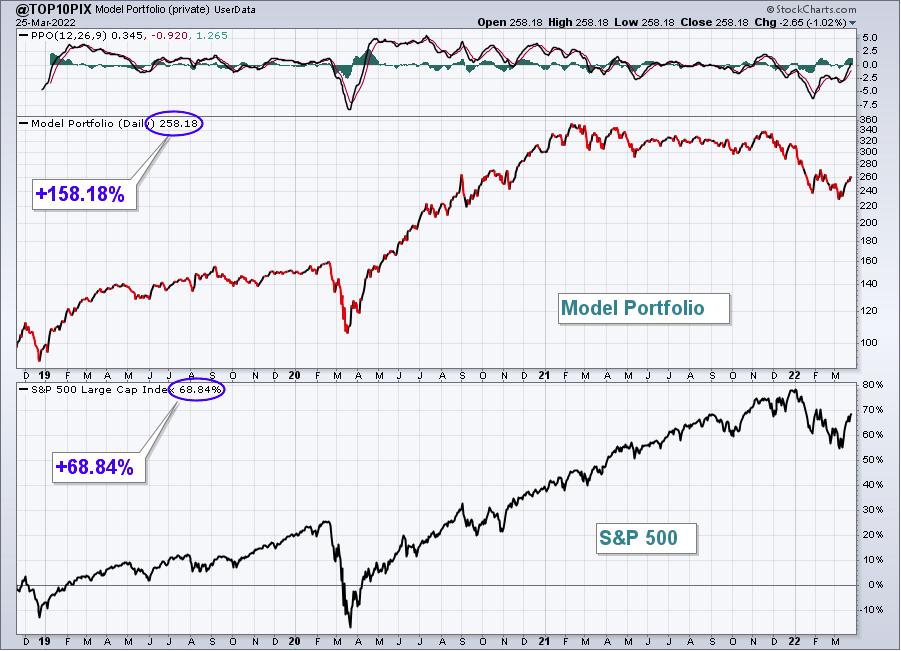
The Model Portfolio gained 1.95%, slightly outperforming the S&P 500 last week. Here's the updated inception-to-date chart of the portfolio:
Here are how the Model portfolio component stocks performed last week:
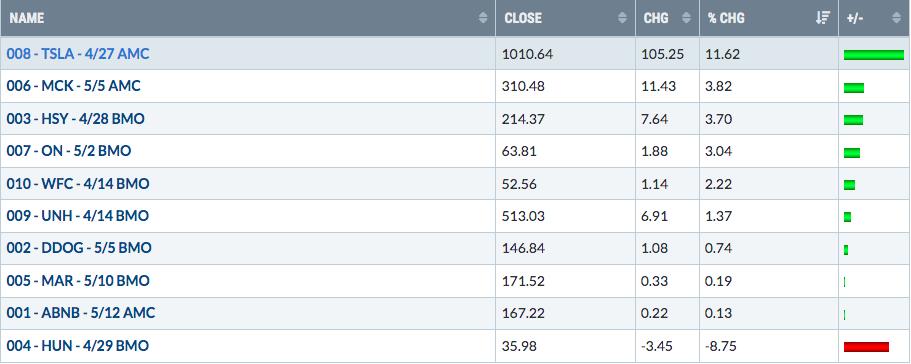
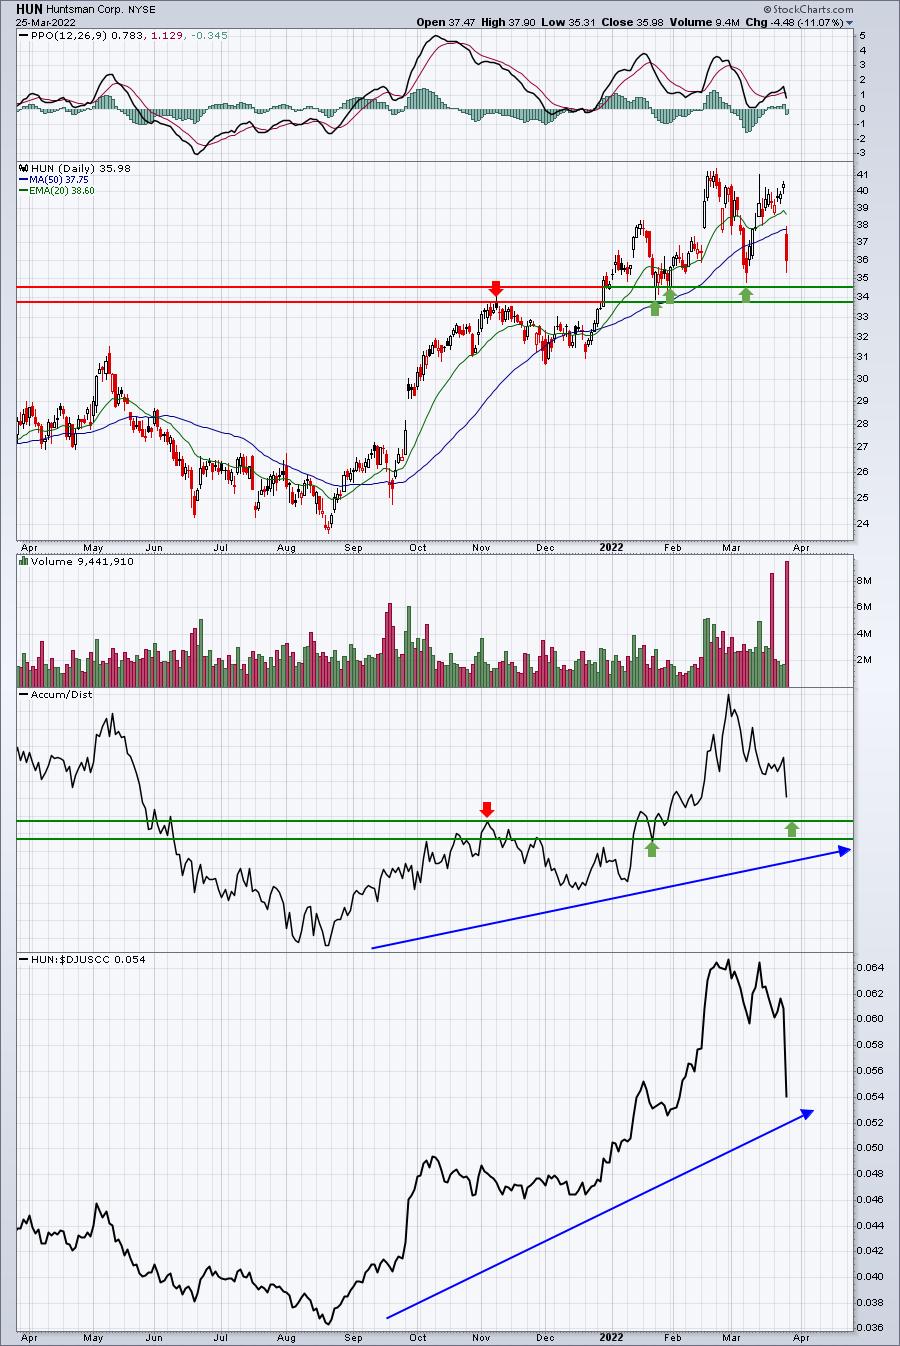
HUN had a rough Friday, losing 11.07%, after activist investor Starboard Value LP failed in its attempt to overhaul the board of Huntsman. The chart, despite Friday's setback, still remains quite favorable, though there is still some downside technically:
Aggressive Portfolio:
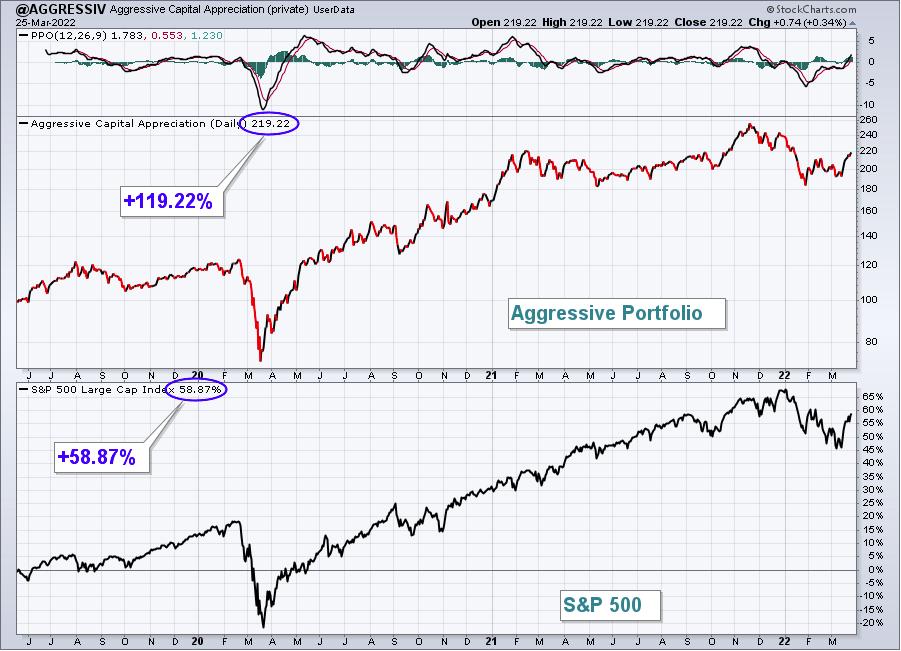
The Aggressive Portfolio surged 4.08% last week, easily outperforming the S&P 500. Here's the updated inception-to-date chart of the portfolio:
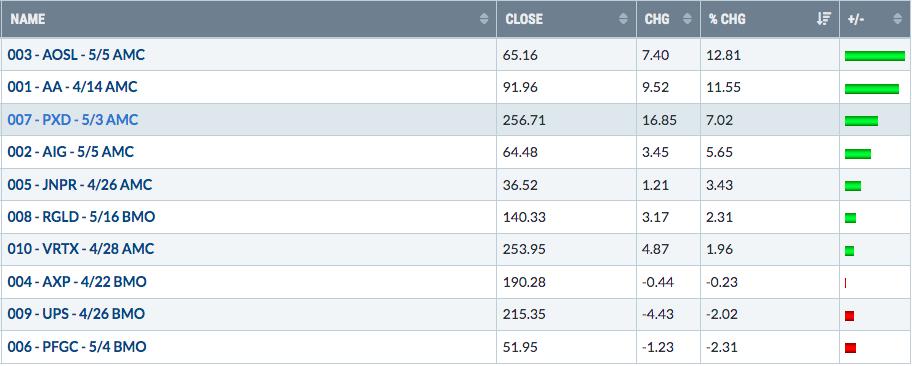
Here are how the Aggressive portfolio component stocks performed last week:
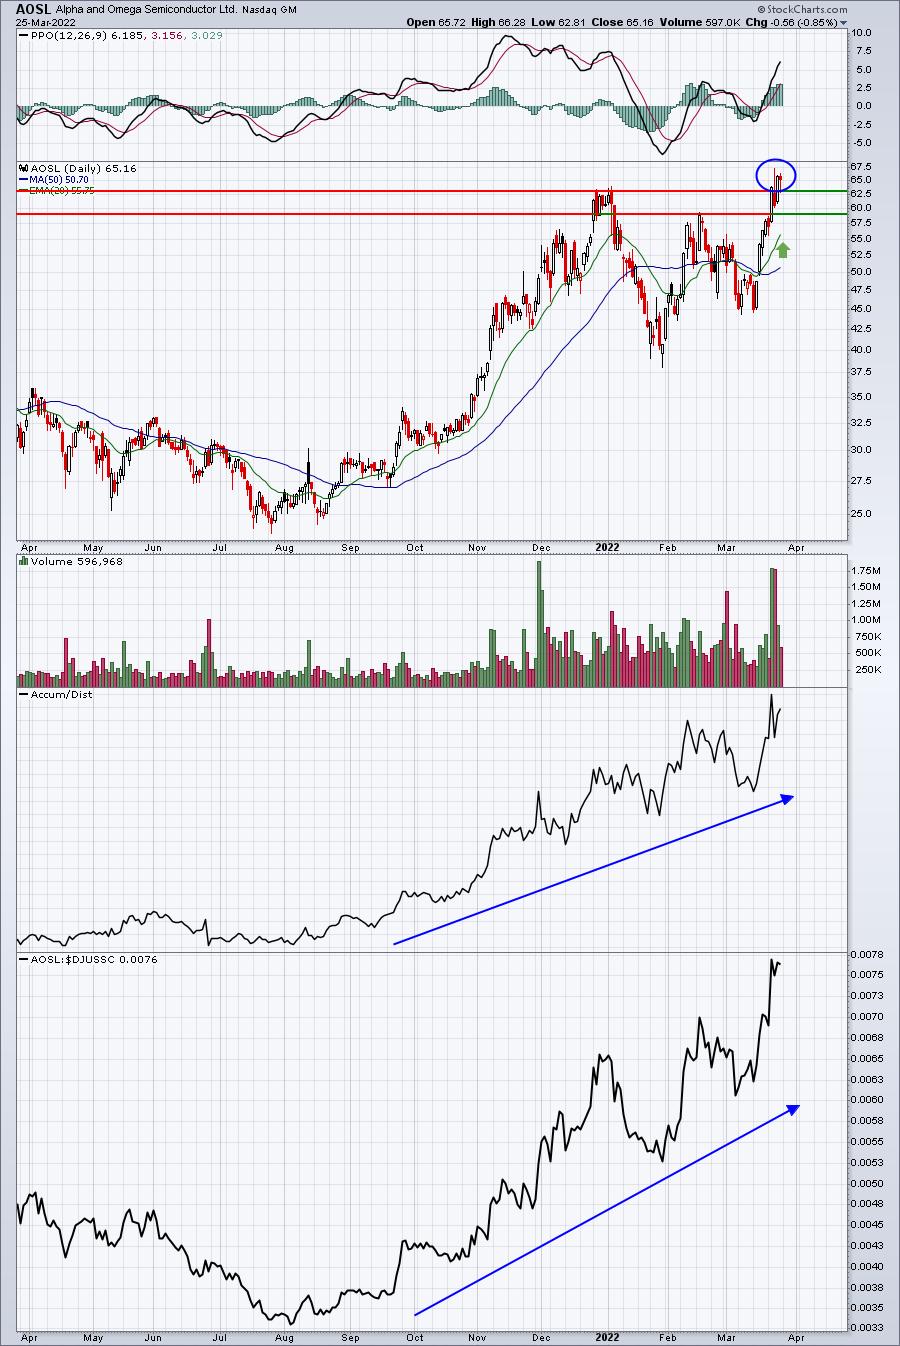
AOSL broke out again last week and continues to show excellent relative strength vs. its semiconductor ($DJUSSC) peers:
Income Portfolio:
The Income Portfolio spiked 3.41% last week, outdistancing the S&P 500. Here's the updated inception-to-date chart of the portfolio:
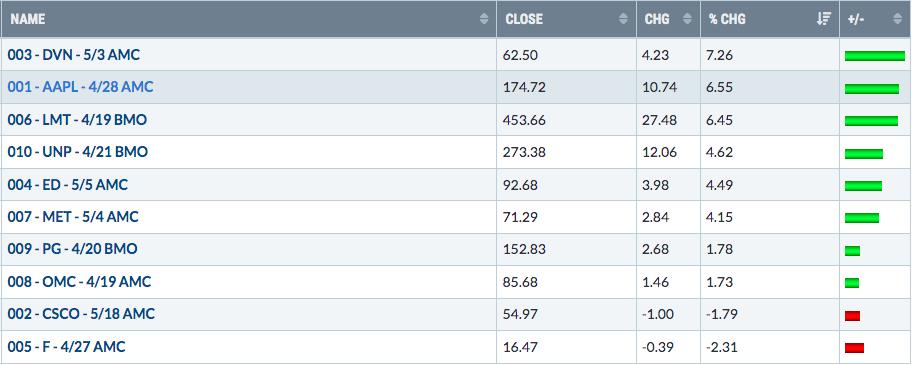
Here are how the Income portfolio component stocks performed last week:
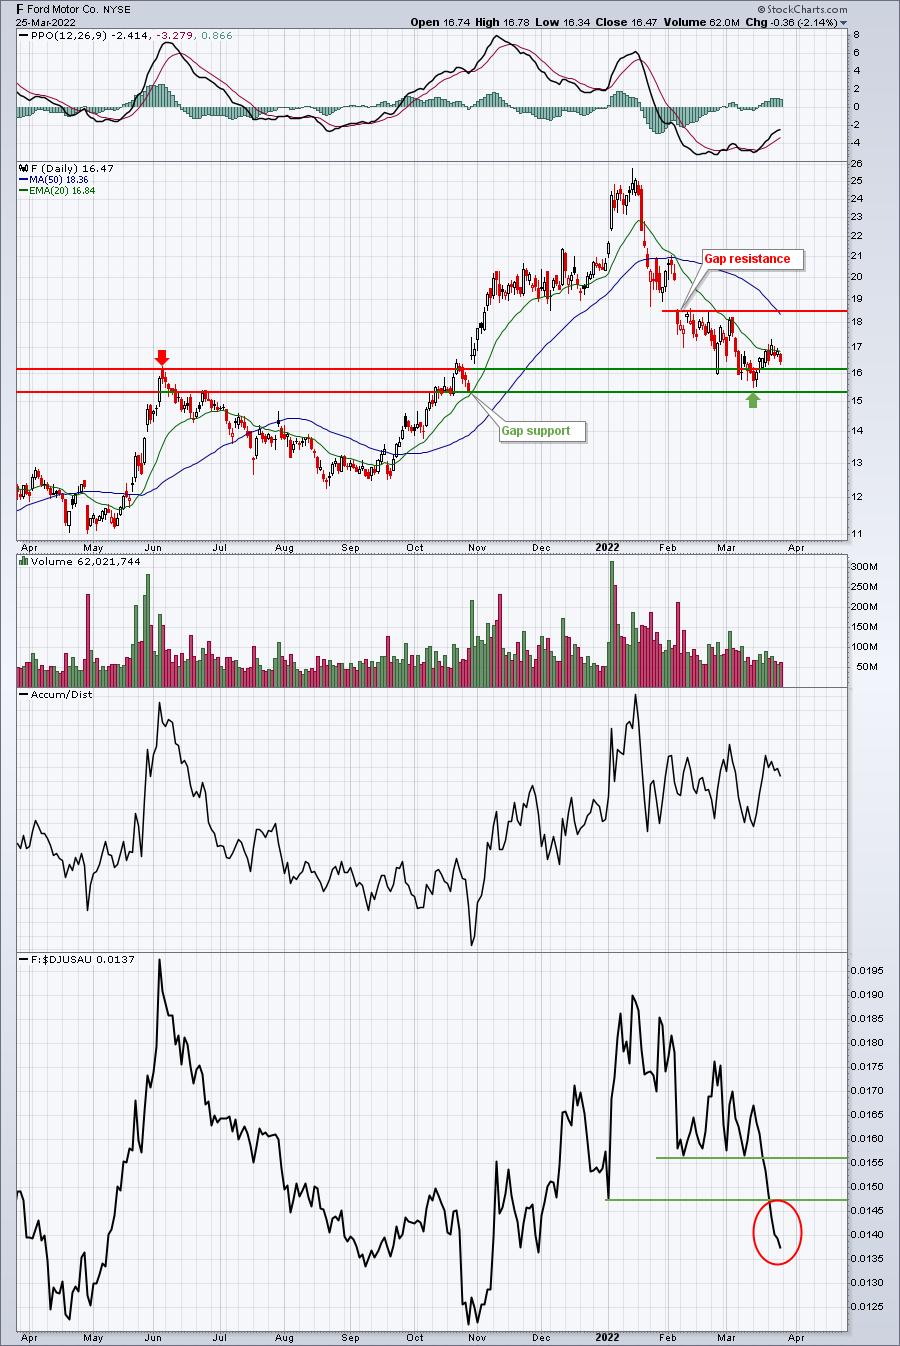
F has seen its relative strength erode throughout 2022 and is now at a 2022 low. It would seem that any trip to test its 50-day SMA and/or gap resistance would represent an opportunity to cut losses for those having lost confidence in the automaker:
Strong AD Portfolio:
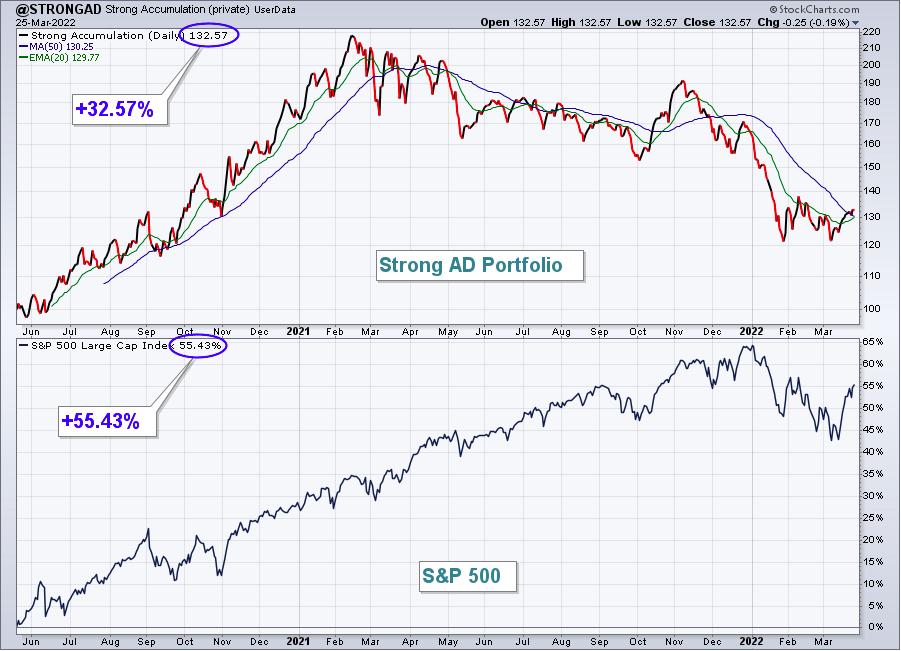
The Strong AD Portfolio climbed 1.28% last week, but did underperform the S&P 500. Here's the updated inception-to-date chart of the portfolio:
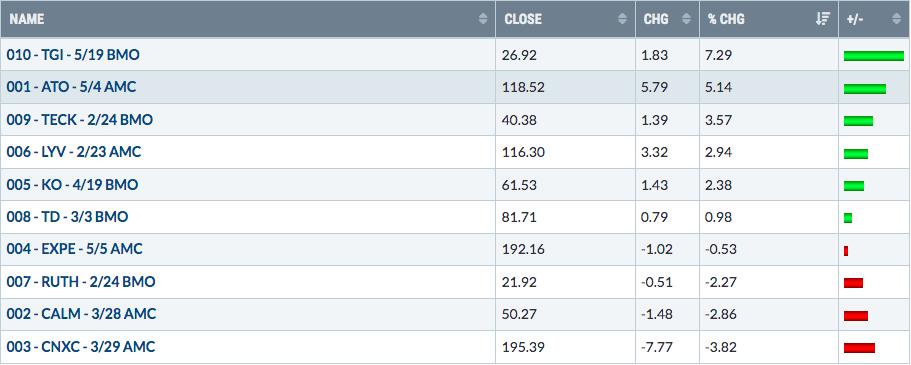
Here are how the Strong AD portfolio component stocks performed last week:
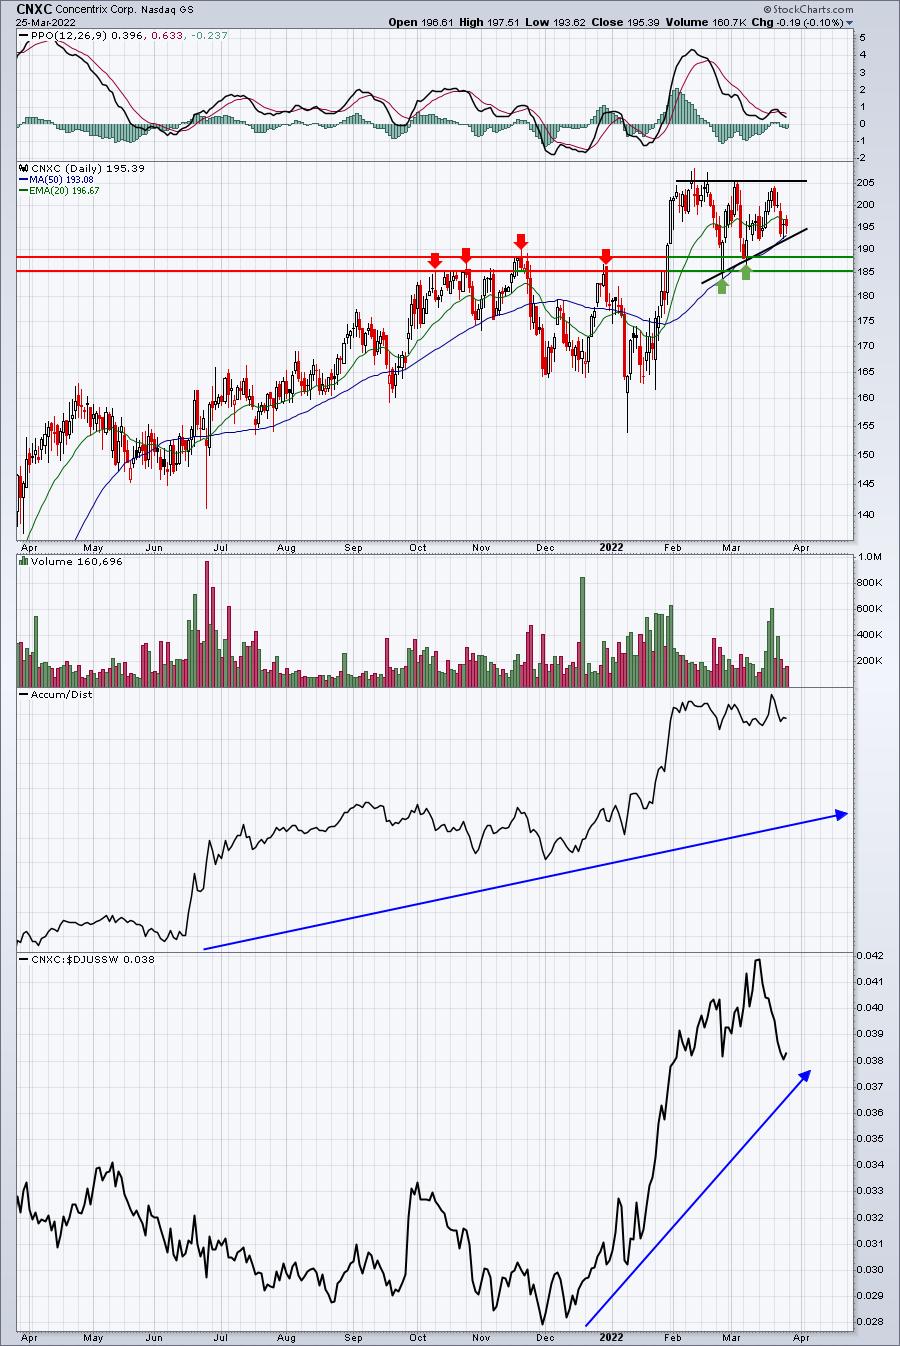
CNXC has run into short-term difficulties as it consolidates in what appears to be a bullish ascending triangle pattern:
Earnings Reaction Portfolio:
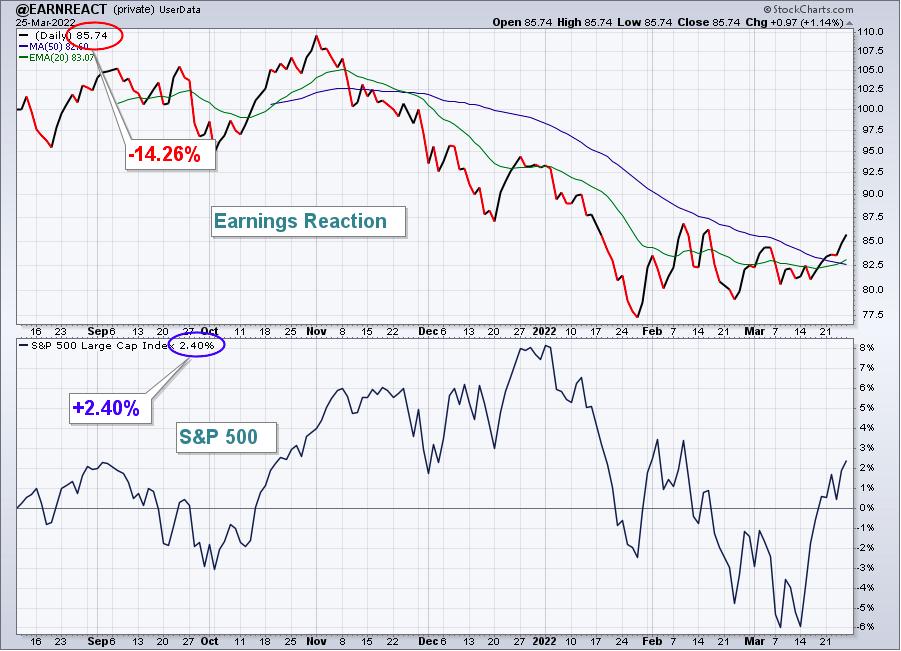
The Earnings Reaction Portfolio jumped 3.59% last week, outperforming the S&P 500. Here's the updated inception-to-date chart of the portfolio:
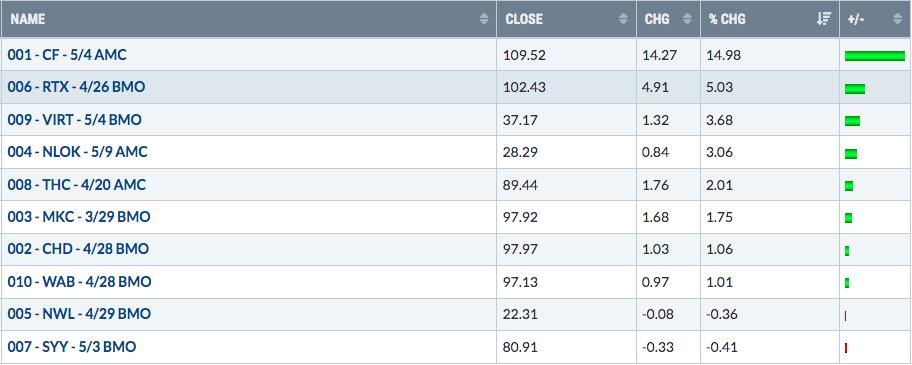
Here are how the Earnings Reaction portfolio component stocks performed last week:
SYY has seen a rebound off its early-March low and there's technical reason to believe the rally could be over. SYY has lost relative strength from earlier in 2022 and it's strengthened to test the key 50% retracement level:
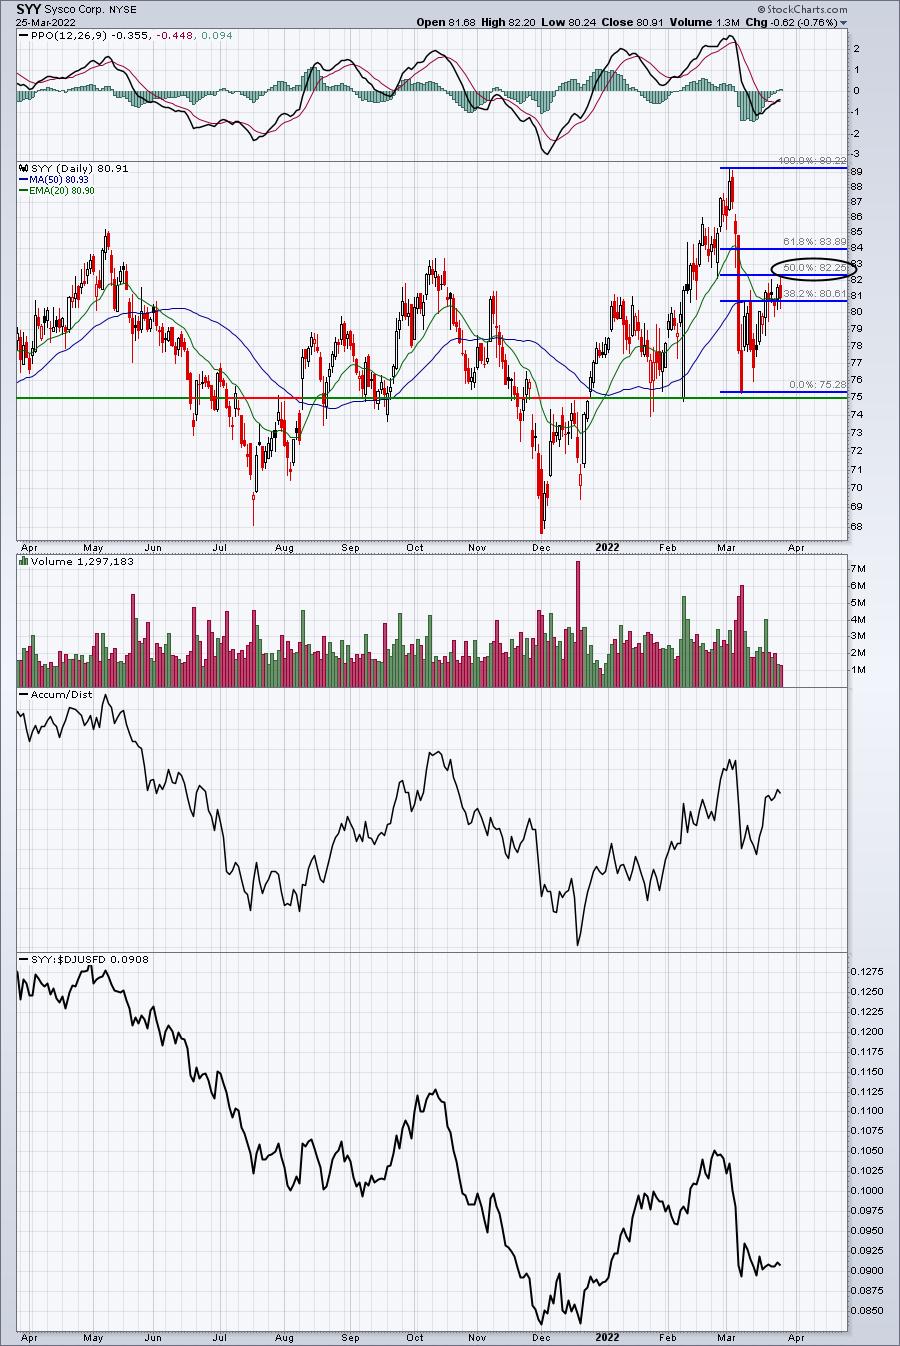
To be clear, we hold all of our portfolio stocks for the full 90 days, so through May 19th. We believe it's important for our long-term results to be both transparent and simplistic. But our members who buy or trade portfolio stocks are obviously able to do whatever they wish. SYY may return to new highs, but technical indications suggest the higher likelihood is weakness ahead. If it's to move higher, I'd really like to see relative strength return. It barely budged higher on the recent rebound, which tells me the recent rally was more about the industry group strength than it was about SYY's leadership and strength.
Summary
We're most definitely NOT out of the woods in terms of further downside action ahead. In fact, I'd consider the best case scenario to be a period of consolidation ahead, similar to what we saw from mid 2014 to early 2016. As a refresher, I'll provide you a chart of that period:
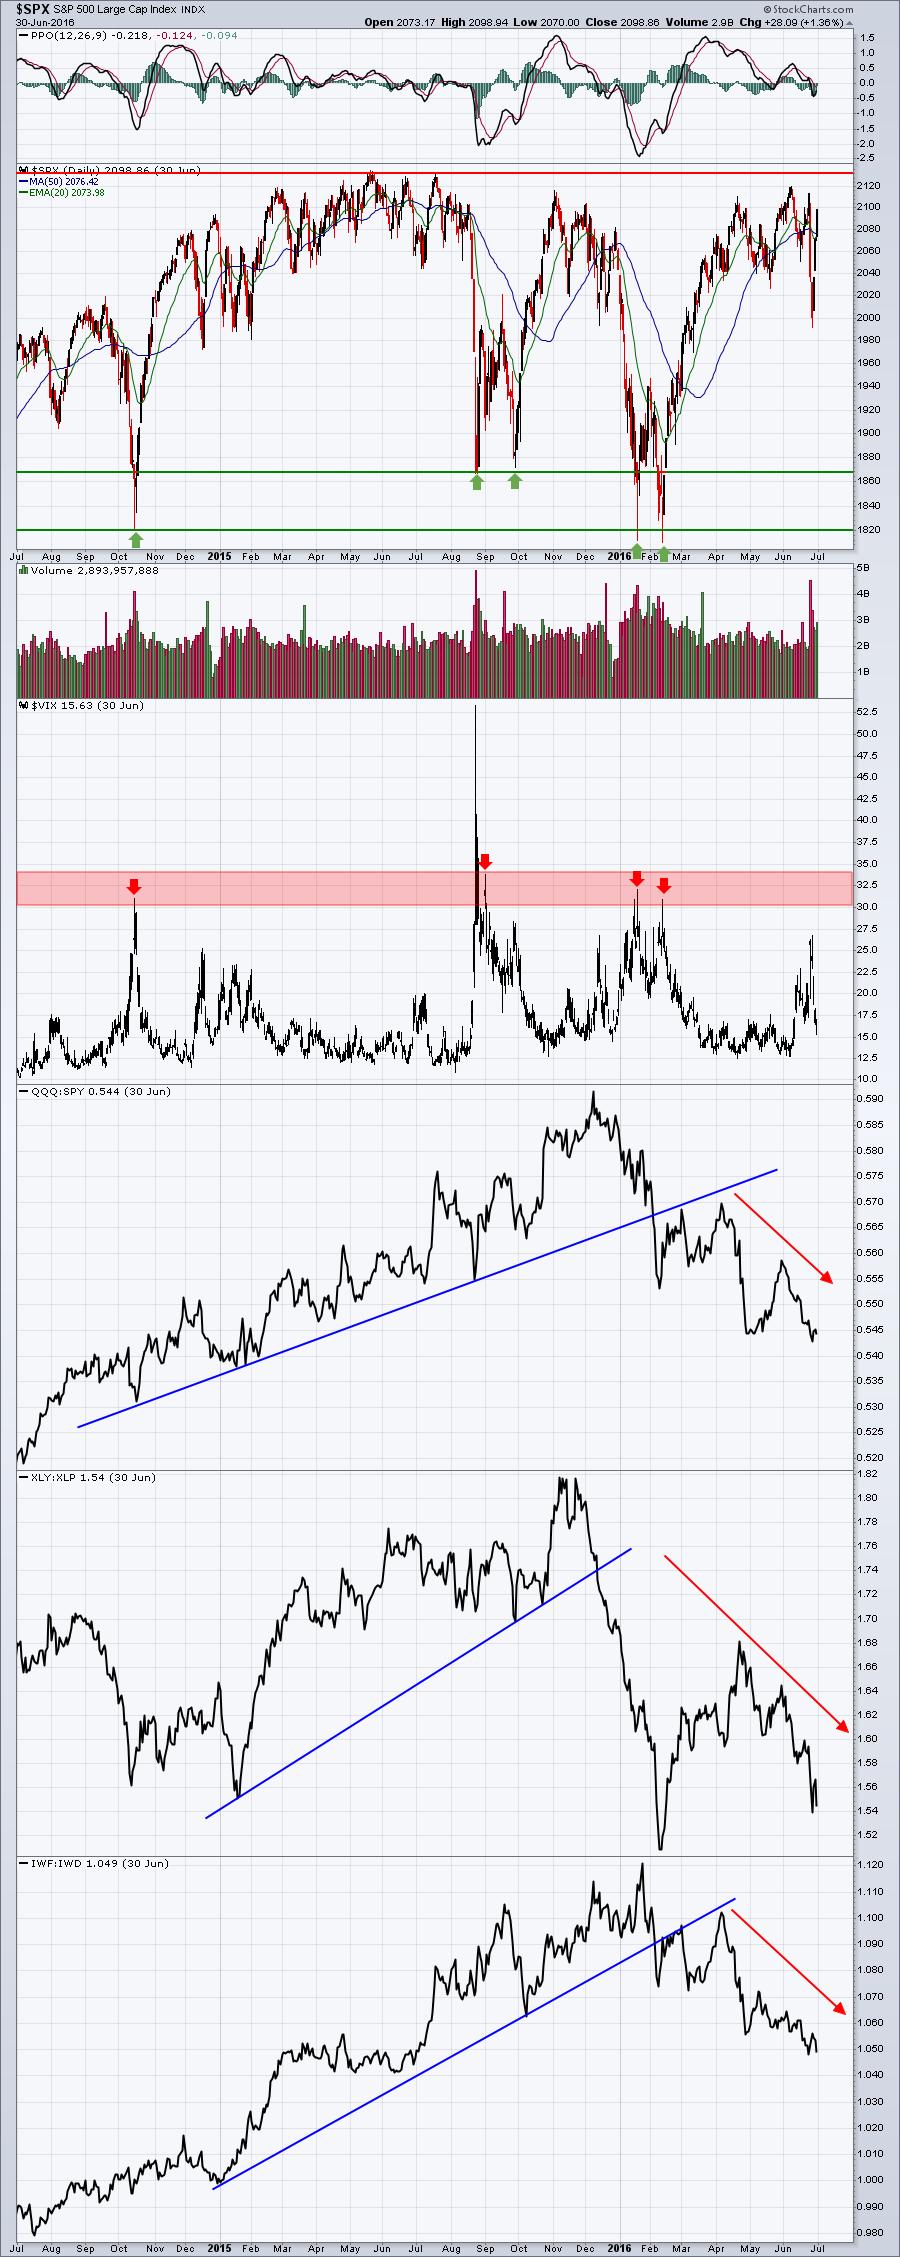
While price action ahead might look similar to what we saw from 2014 to 2016, the "under the surface" signals are already much different. In 2014 to 2016, key sustainability ratios remained quite strong until 2016. If you recall, the problem at the end of 2021 was that key sustainability ratios weakened, tipping us off to the weakness ahead. So while price action COULD be similar, sustainability ratios this time around are definitely much weaker.
I've been discussing a lot of bearish options and patterns the past several weeks, but given last week's price action back above the declining 20-week EMA, we need to remain objective and consider a bullish alternative ahead - a possible inverse head & shoulders pattern:
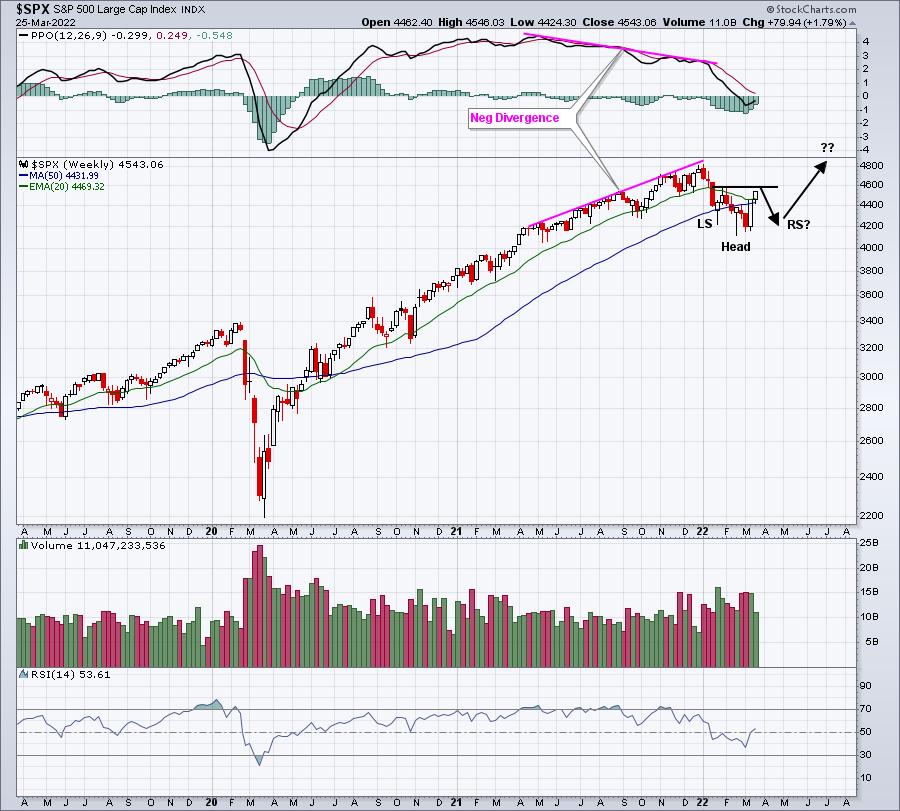
It's very important to try to remain objective regarding whether we should expect bullish or bearish action ahead. One of my favorite Wall Street sayings is "it's ok to be wrong, but we don't want to be wrong for long". There are mixed signals right now from a longer-term perspective, but the odds begin to flip more to bullish outcomes if the S&P 500 is able to clear 4600 and close there.
Model ETF Portfolio
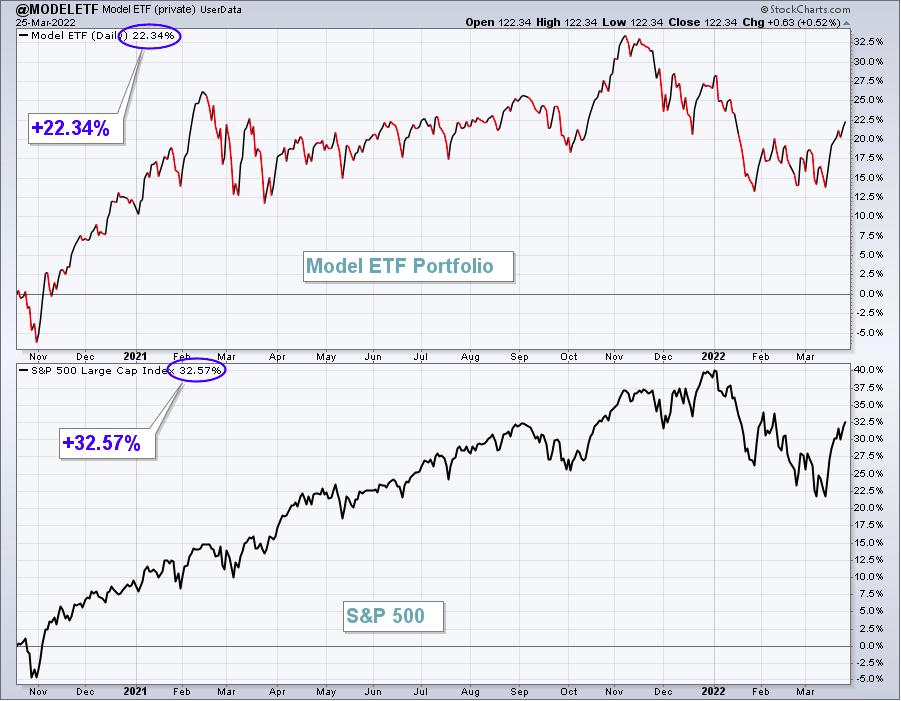
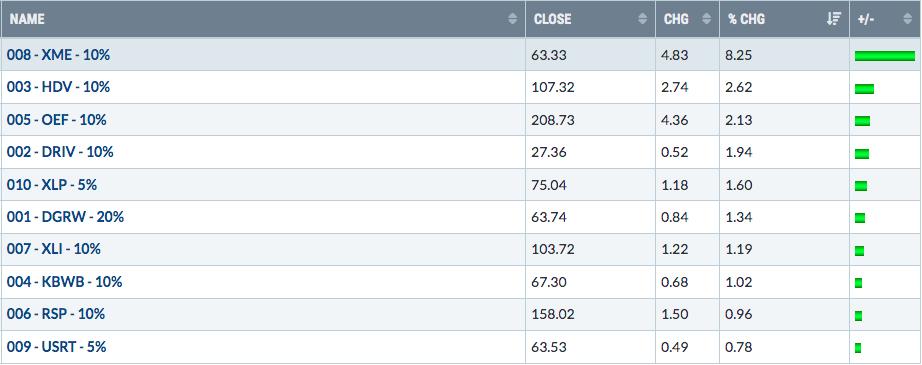
Our Model ETF Portfolio gained 2.05% last week, slightly outperforming the S&P 500.
Here's the updated inception-to-date chart of the Model ETF Portfolio:
Here are how the Model ETF Portfolio component ETFs performed last week:
Happy trading!
Tom Bowley, Chief Market Strategist
EarningsBeats.com
"Better timing. Better trades."