
EB Weekly Portfolio Report - Saturday, April 23, 2022
Updated Earnings Dates
According to StockCharts.com, several of our portfolio stocks changed their earnings dates. In order to ensure that your portfolio ChartLists have the latest earnings date information, you should re-download and overwrite the portfolio ChartLists in your account using the same links and passwords provided on our website. If you have any questions, feel free to reach out to us at "[email protected]".
Upcoming Earnings Reports
According to Zacks.com, the following companies will be reporting earnings this week and each is a component of one of our portfolios:
Monday, April 25: KO
Tuesday, April 26: JNPR, UPS, RTX
Wednesday, April 27: F, TECK, WAB
Thursday, April 28: AAPL, HSY, HUN, CHD, VIRT
Friday, April 29: NWL
PLEASE NOTE: The above companies were provided using earnings dates provided by StockCharts.com. My research is limited to what StockCharts.com provides and I also can make a mistake from time to time, so please double check for earnings dates for all companies that you own from a reputable source like Zacks.com. We do hold our portfolio stocks through one earnings report, but every EarningsBeats.com member must make his/her own investing/trading decisions about holding stocks into earnings reports as it's the most volatile (risky) time to own a stock.
Portfolio Rules and Objectives
Here are the common traits and objectives of our portfolios:
- There are 10 leading stocks from up to 10 leading industries in each portfolio (at the time of selection). Generally, there will only be one stock per industry group, but there could be exceptions.
- They are held for an entire 90-day period, with no stops in place. We strive for consistency, transparency, and simplicity in our portfolios. EB.com members may hold these stocks for the entire 90 days, trade them, use stops, etc., but for purposes of our calculation, we will make no exceptions to our "buy and hold for three months" strategy.
- Every stock will generally be held through ONE earnings report
- The expectation is that relative winners will carry the portfolio to outperformance
- They were all entered into as of the close on Friday, February 18th; members may choose to try to time better entries, but EB.com "purchased" as of February 18th's closing prices
- Primary objective is to outperform the benchmark S&P 500 over time; quarter-to-quarter performance can be extremely volatile, especially if significant rotation takes place intra-quarter
Here are several considerations for EB members:
- I would expect the Aggressive, Strong AD, and Earnings Reactions portfolios to be the riskiest, followed by the Model portfolio, and then the Income portfolio
- The Strong AD portfolio will be selected from a combination of rising accumulation/distribution lines and SCTRs above 70 at the time of selection. The Earnings Reactions portfolio is based on strong accumulation the day after its quarterly earnings are released and solid relative strength (vs. its peers). These are the only two portfolios that do NOT require revenue and EPS beats in their most recent quarterly earnings reports
- The Income portfolio stocks will all pay dividends, with the expected average dividend yield to be at least 1.0%
- Drawdowns (losses) should be much milder on the Income portfolio, with more volatility expected on the other four; please review inception-to-date charts below to gain an idea of the volatility associated with each
- I believe the larger drawdown on the Income portfolio at the beginning of the pandemic was an anomaly, occurring as many defensive, higher-yielding companies uncharacteristically underperformed during a market decline.
- Large drawdowns in the February through May 2021 and the November 2021 to February 2022 periods were due to the rapid rotation from growth stocks to value stocks; each quarter, our portfolios are based on themes and there is never a guarantee that our analysis and beliefs will be proven correct
- You should consider owning or trading these stocks in whatever manner is most comfortable for you; while we will buy all 10 stocks in the manner identified above, feel free to trade certain stocks or wait for pullbacks if the stocks are overbought
- We have no idea what risk each member is willing or able to take. We are not registered investment advisors so be sure you understand the risk you take. Please consult your financial advisor.
- EarningsBeats.com shareholders/employees may own all or some of the portfolio stocks from time to time.
Weekly Snapshot
Here's a weekly recap:
Weekly Summary
Benchmark S&P 500:
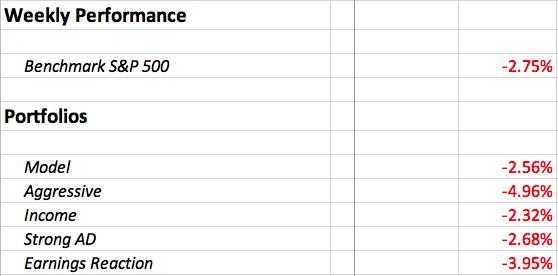
The S&P 500 dropped a hefty 2.75% last week and only real estate (XLRE, +1.25%) and consumer staples (XLP, +0.51%) were higher for the week among our 11 sectors. Communication services (XLC, -7.76%) had a horrendous week after Netflix (NFLX) announced that subscribers had dropped for the first time since 2011. The entire communication services group has been under pressure, and internet ($DJUSNS) has been a big reason why. Meta Platforms (FB) dropped 12.40% last week, closing at its lowest level in 2 years. The DJUSNS is down 27.02% year-to-date, which is nearly three times the S&P 500 decline of 10.37%.
Last week, I mentioned that semiconductors ($DJUSSC) and software ($DJUSSW) need to show relative strength to help reverse the fortunes of U.S. equities. These two groups are now down 25.02% and 21.99%, respectively. Both are down more than double the S&P 500. This helps to illustrate the significant issues felt in growth stocks right now. It's also why there's still a very good chance that the S&P 500 falls into the 3000s.
Model Portfolio:
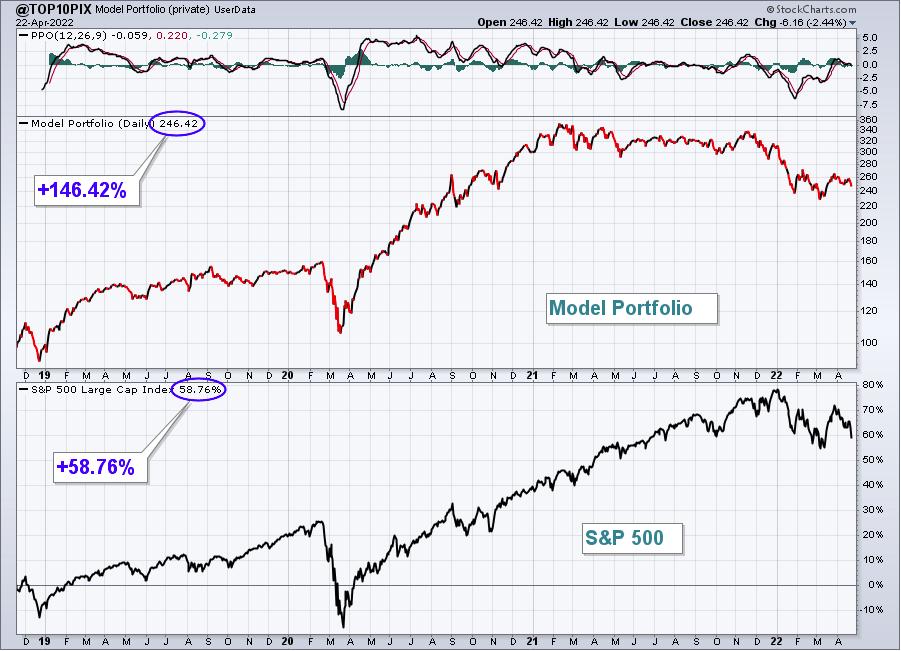
The Model Portfolio fell 2.56%, slightly outperforming the benchmark S&P 500. Here's the updated inception-to-date chart of the portfolio:
Here are how the Model portfolio component stocks performed last week:
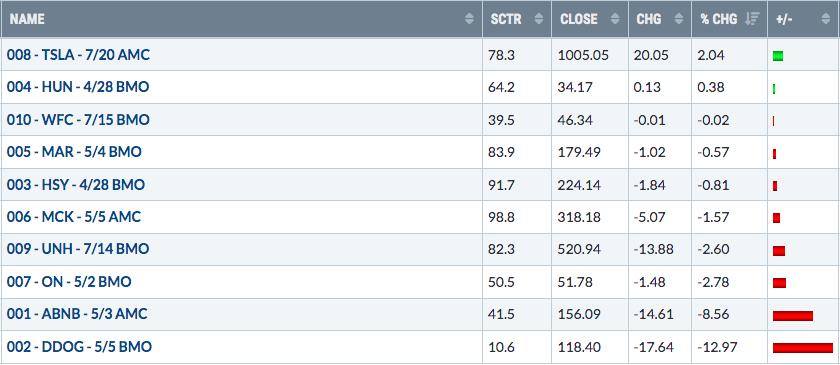
You can see the impact of owning growth stocks simply by looking at the performance last week by ABNB and DDOG. 8 out of the 10 portfolio stocks performed well vs. the S&P 500, but these two stocks brought the performance down of the Model Portfolio. DDOG has reached a critical price and gap support zone:
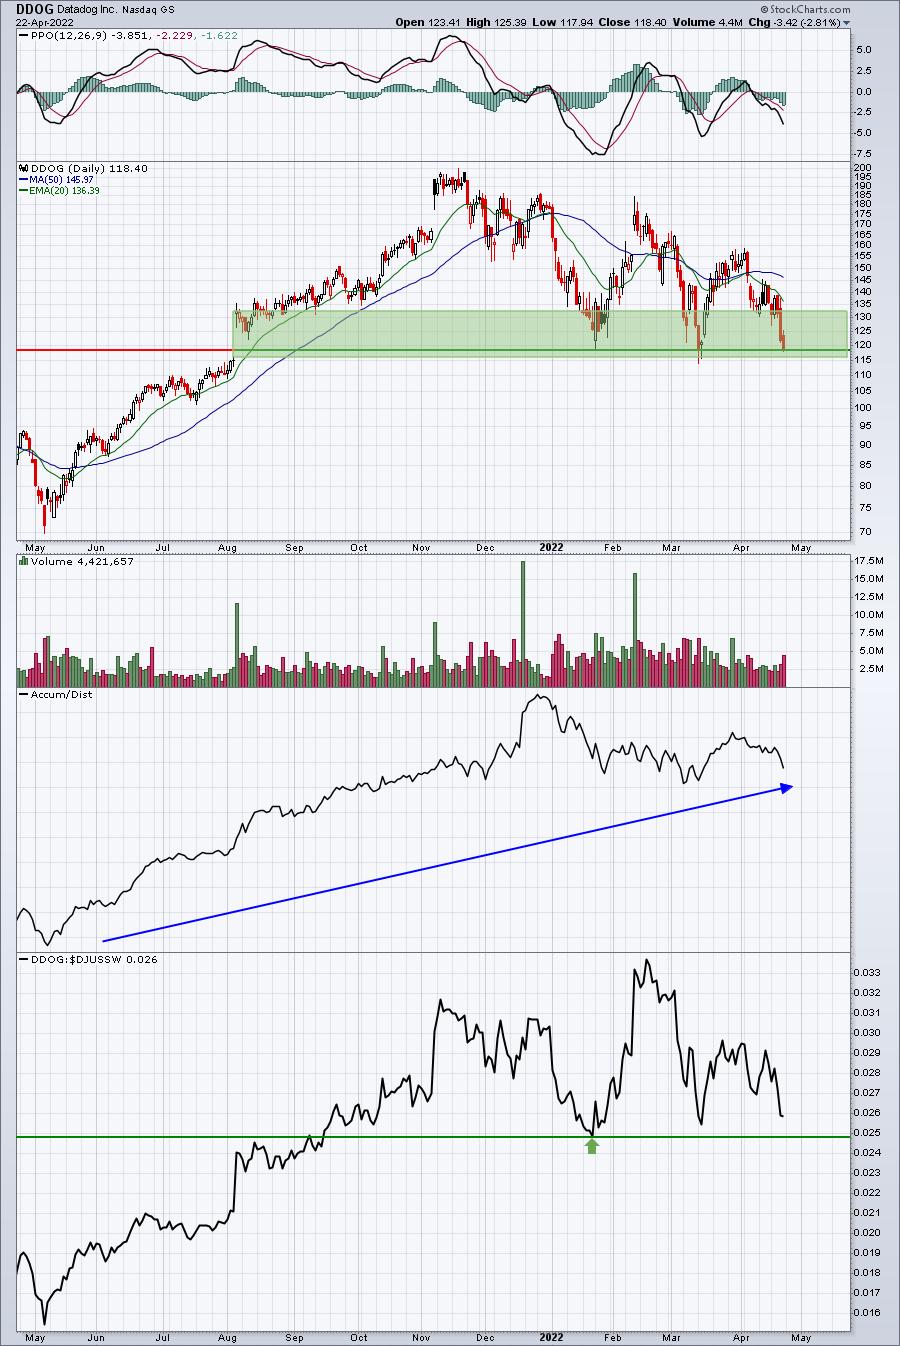
DDOG is still holding onto relative support vs. its software peers ($DJUSSW) and its AD line still has a bullish slant. But the problem ahead could be the overall market environment. The Volatility Index ($VIX) ended last week at 28.21, rising 24.38% on Friday alone. As the VIX soars higher and higher, impulsive selling kicks in and we can all but forget about technical support levels.
Aggressive Portfolio:
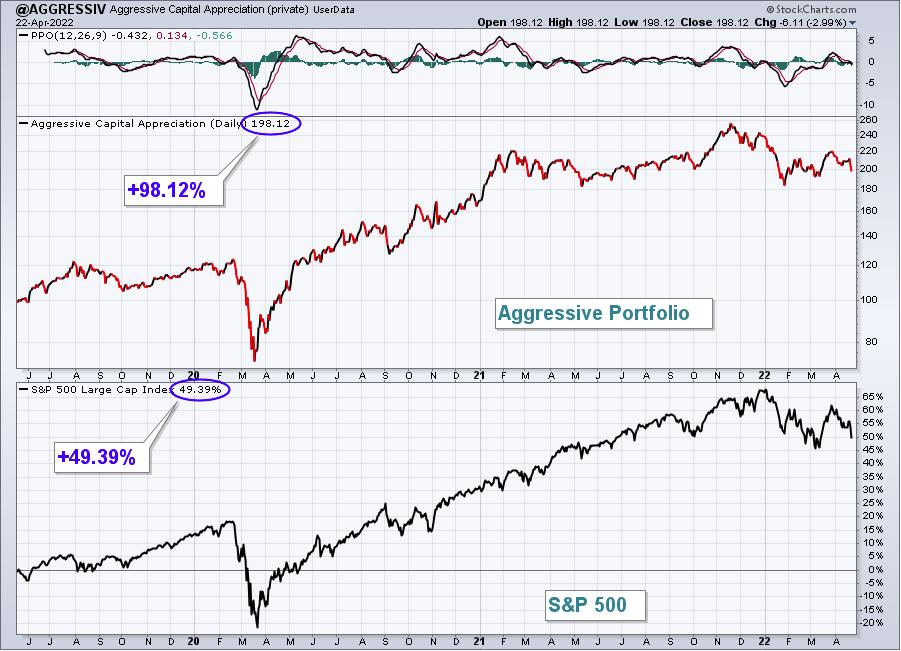
The Aggressive Portfolio dropped 4.96% last week, underperforming the S&P 500. Here's the updated inception-to-date chart of the portfolio:
Here are how the Aggressive portfolio component stocks performed last week:
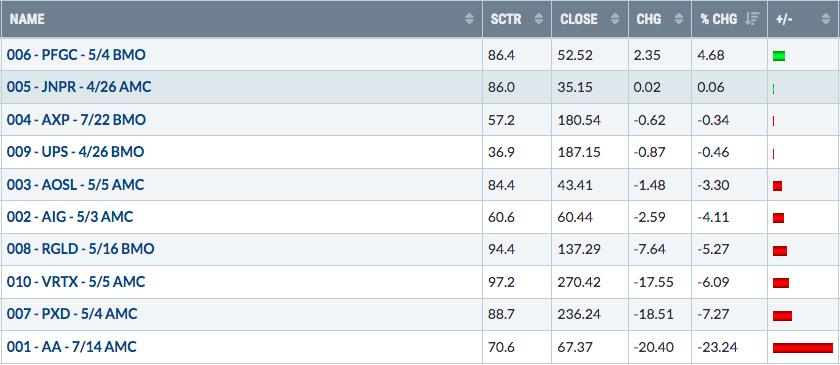
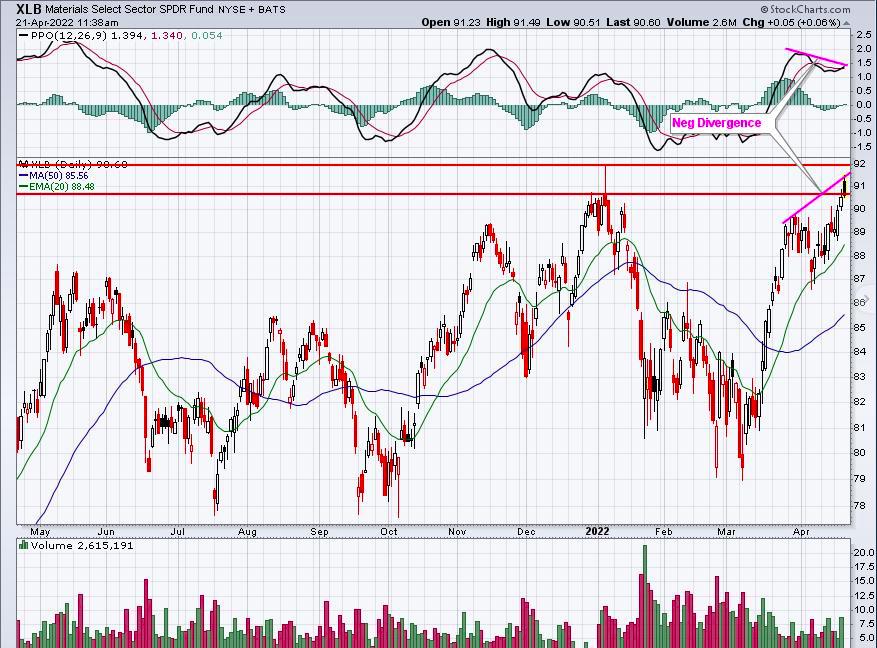
AA was crushed last week after reporting results that fell short of Wall Street consensus estimates - particularly with respect to revenues. It didn't help that the entire materials sector (XLB) had printed a nasty negative divergence, which I featured in the Daily Market Report on Thursday. First, let me show you what the XLB looked like when I sent out the DMR at 1pm ET, three hours before the market closed:
.......and this is how the XLB looked when the closing bell rang on Friday:
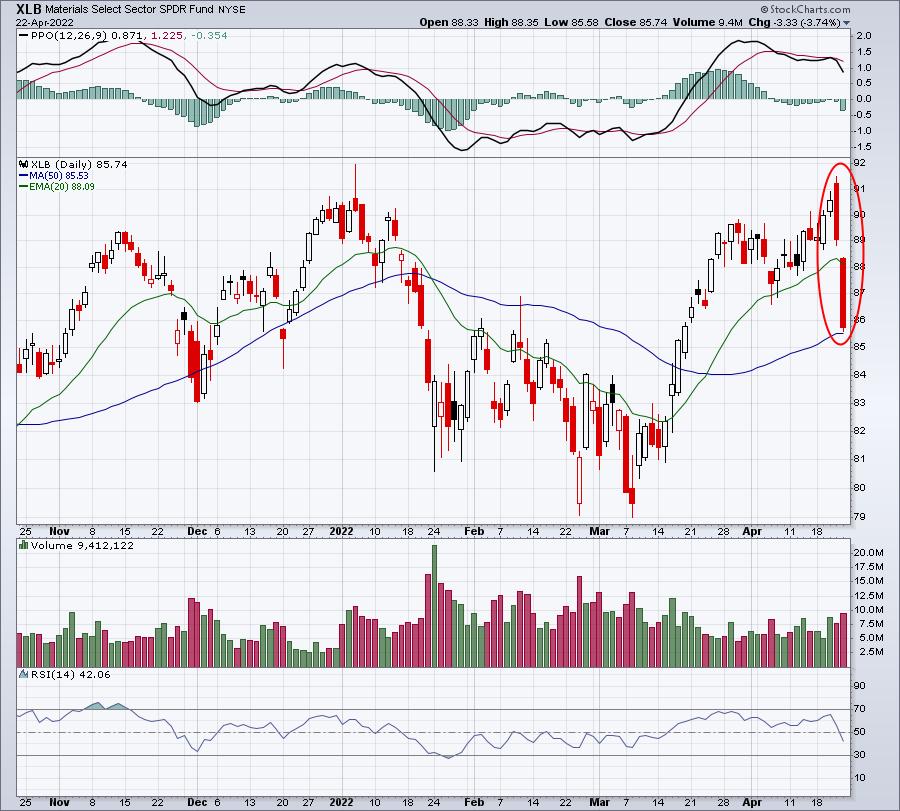
Technical analysis works.
Income Portfolio:
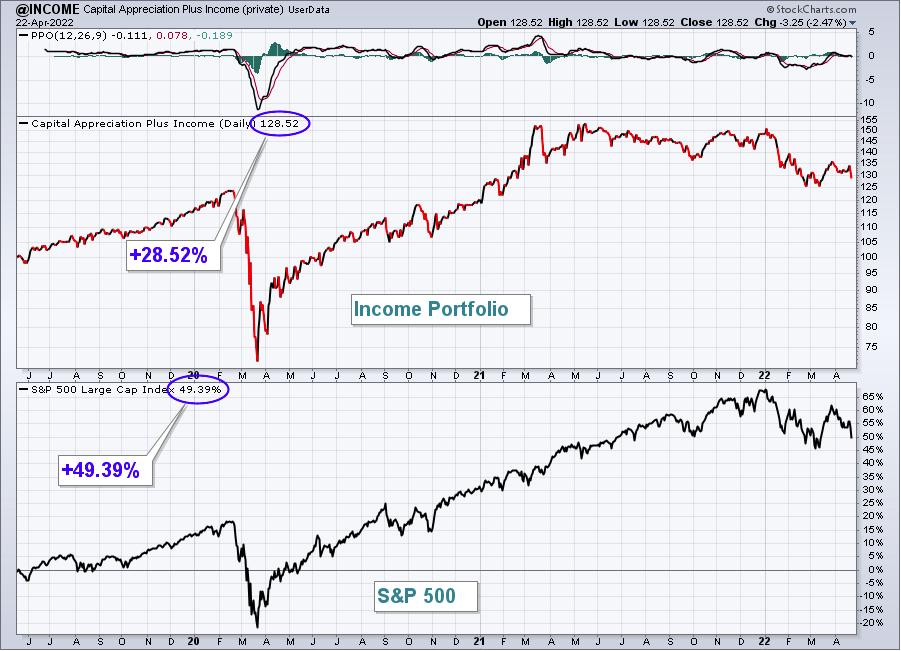
The Income Portfolio fell 2.32% last week, but still outperformed the S&P 500. Here's the updated inception-to-date chart of the portfolio:
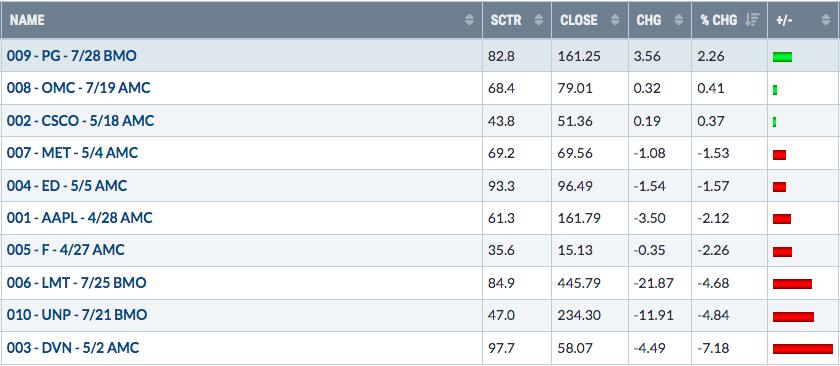
Here are how the Income portfolio component stocks performed last week:
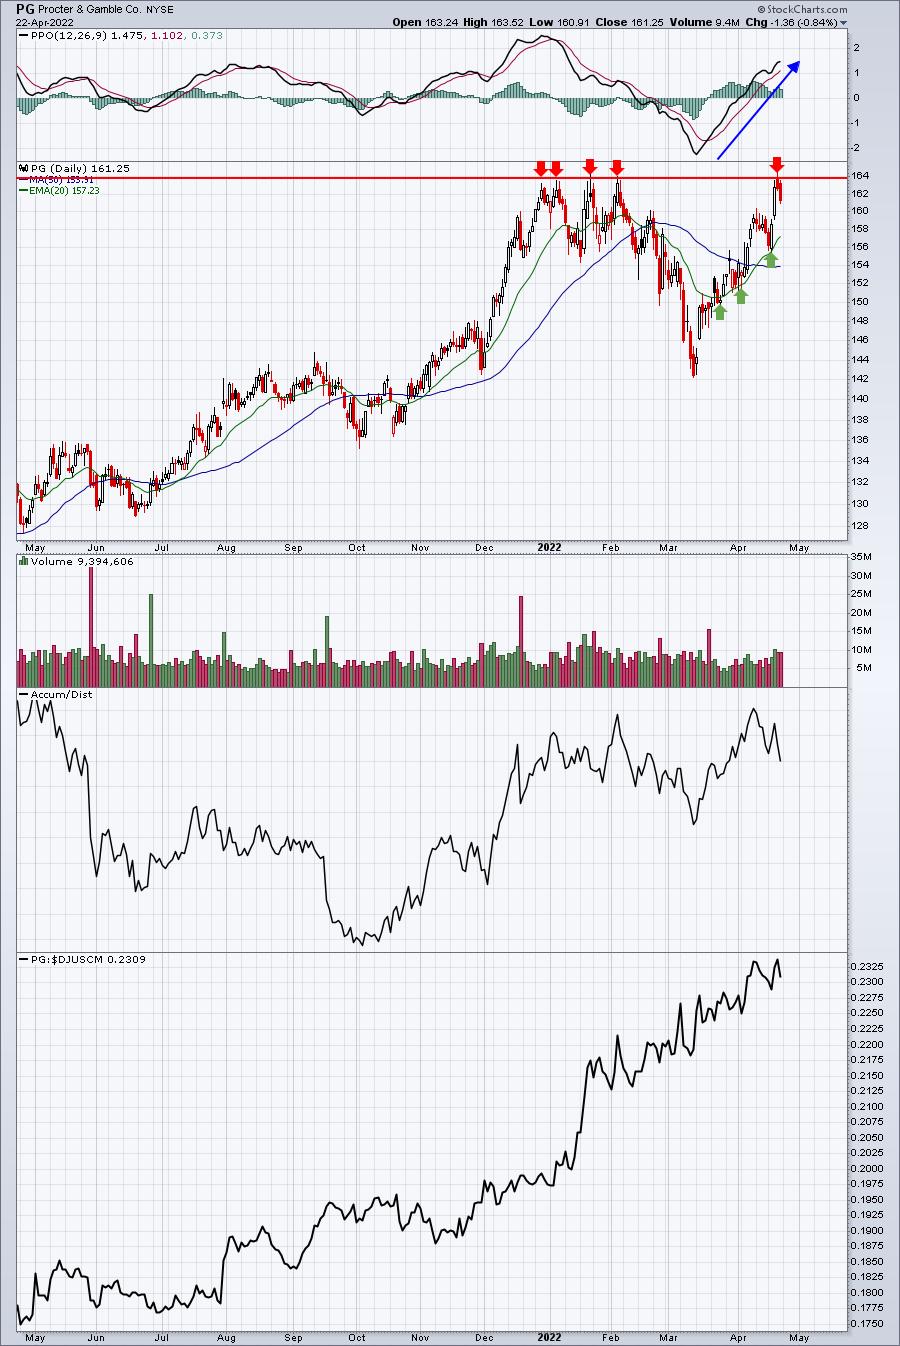
PG has been a tremendous performer, but price resistance is price resistance. PG hit it and quickly backed off it. PG is a nice relative performer and appears to be uptrending, but it will need to clear 164 on a closing basis:
Strong AD Portfolio:
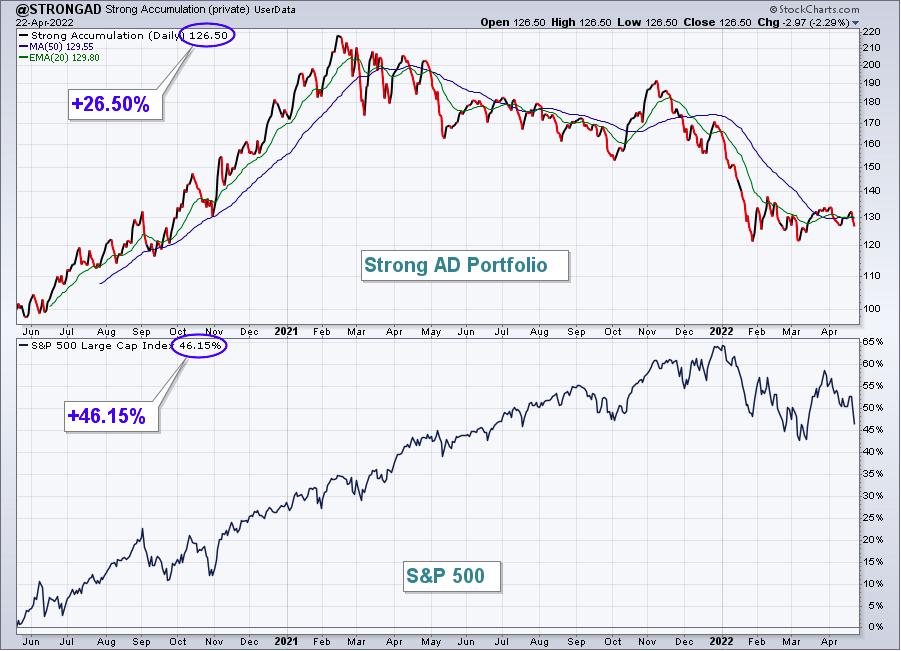
The Strong AD Portfolio fell 2.68% last week, essentially mirroring the S&P 500. Here's the updated inception-to-date chart of the portfolio:
Here are how the Strong AD portfolio component stocks performed last week:
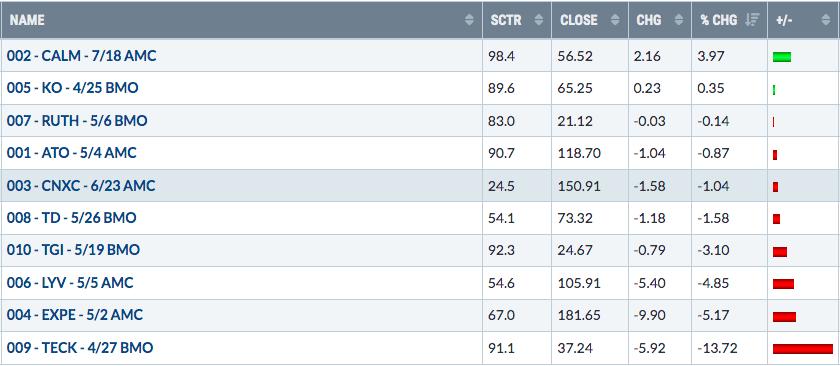
TECK was another casualty in the materials sector last week. It closed beneath its 50-day SMA for the first time in 4 months, which might be considered bearish. However, the weekly chart below suggests we watch for a rebound at the rising 20-week EMA, currently at 35.88:
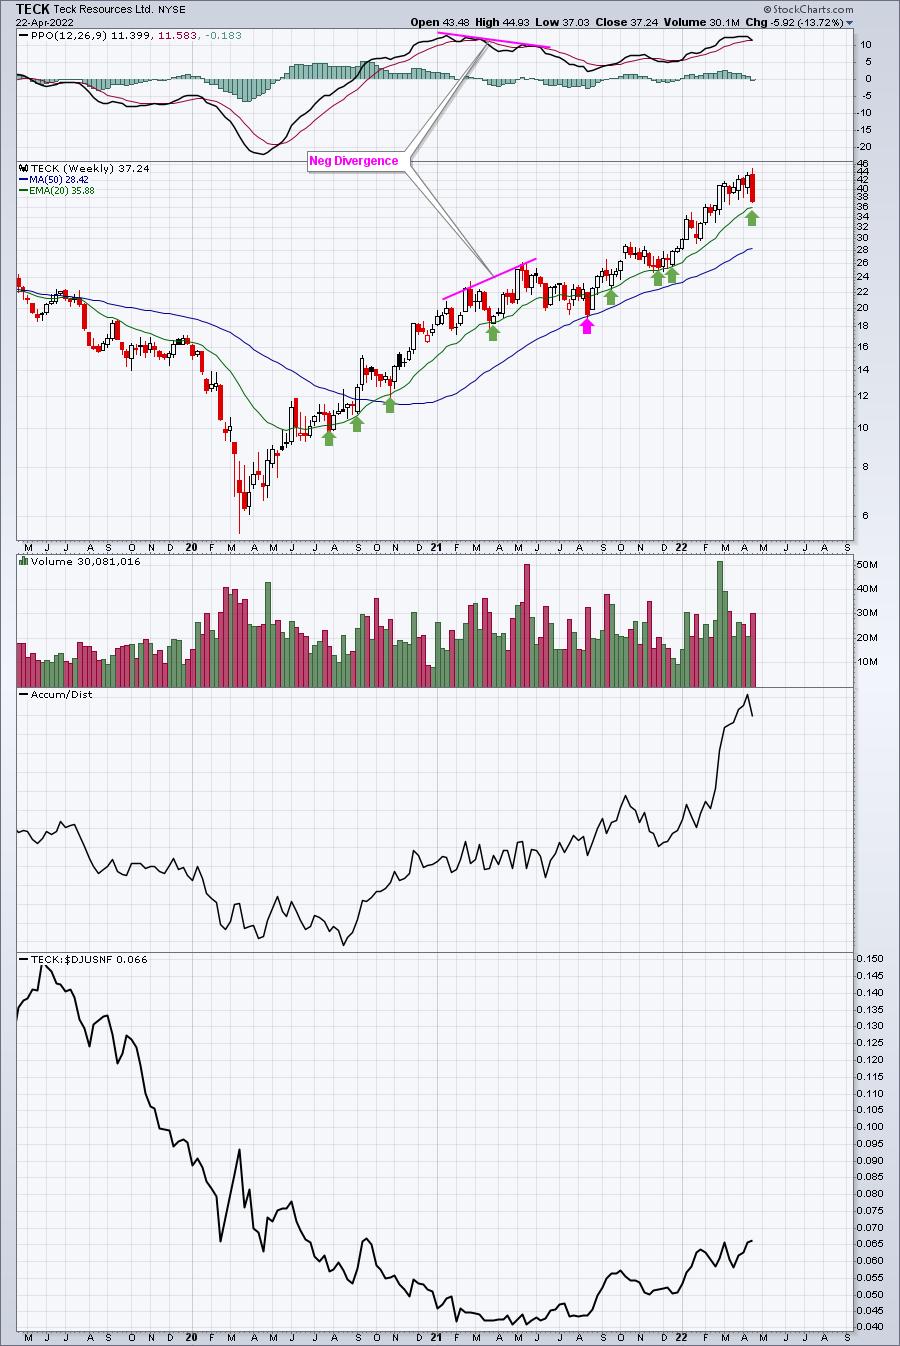
The only time in the past two years that TECK failed to hold 20-week EMA support was after it had printed a negative divergence. I typically look for 50-week SMA tests after weekly negative divergences print. The pink arrow shows that test beautifully. Given the look currently, I'd expect to see the 20-week EMA hold as support. We'll see.
Earnings Reaction Portfolio:
The Earnings Reaction Portfolio declined 3.95% last week, underperforming the S&P 500. Here's the updated inception-to-date chart of the portfolio:
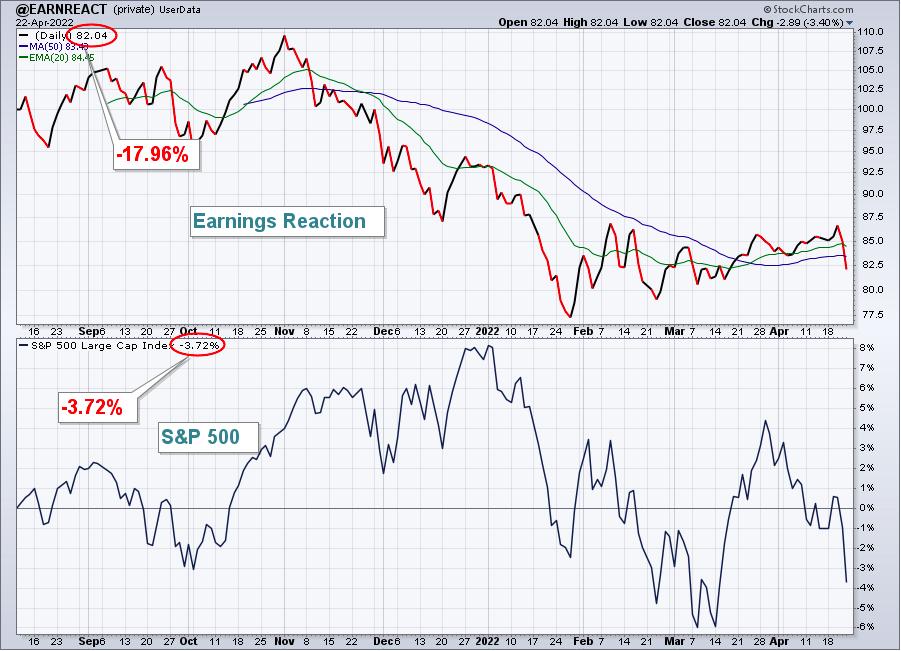
Here are how the Earnings Reaction portfolio component stocks performed last week:
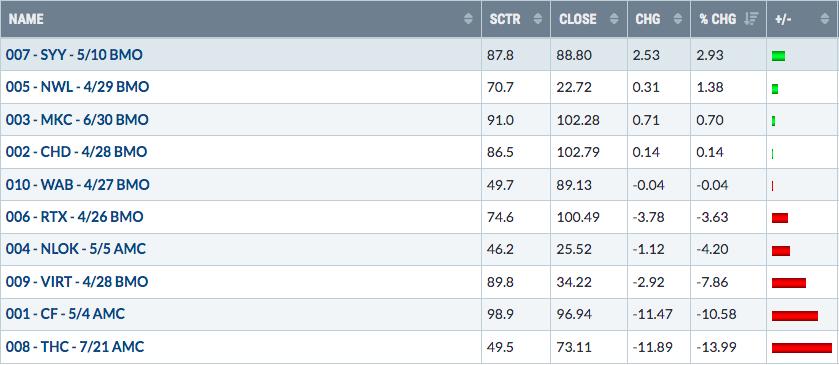
NLOK has been extremely volatile the past three months. The selling on Thursday and Friday has taken the stock back near gap support:
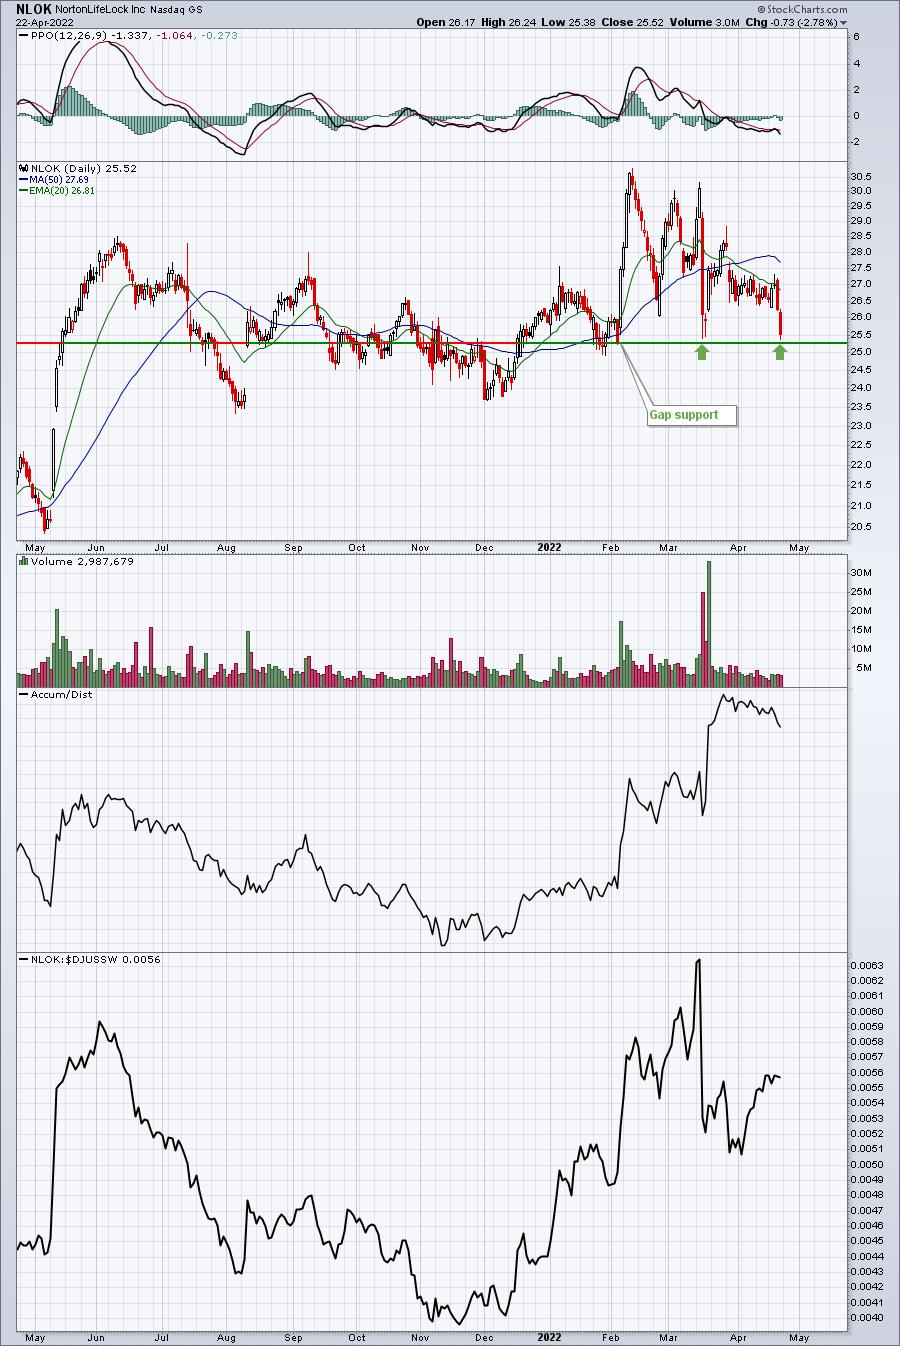
Gap support is 25.27. If that is lost, then the August price support and May gap support - both near 23.50 - come into play.
Summary
I had suggested in last week's EB Weekly Portfolio Report to approach this last week with an abundance of caution. Now you can see why. The best attribute you can have currently is patience. It's going to take time to sort out all of the market headwinds. It's possible that the February low on the S&P 500 holds as support, but equally likely is another breakdown with the S&P 500 trading into the 3000s as I've previously suggested it might. The good news is that I remain steadfastly bullish longer-term, so buying into upcoming weakness is a solid strategy, in my view. But you need to have a plan that you're comfortable with. Wall Street could send us signals that allows us to call the EXACT bottom, but that is usually very difficult to do.
The current market behavior is very similar to other cyclical bear markets. We see periods of strong action, making us believe that the worst is over, only to see another down leg develop that makes us question how the market will ever get itself out of this funk. Options traders are beginning to grow more pessimistic, which is the sentiment reset that I have previously discussed as necessary for us to launch higher later this year. On Friday, the equity only put call ratio ($CPCE) finished at .87, the highest one-day reading since the pandemic-induced spike in March 2020. This is GREAT news! It's not enough, but we're moving in the right direction, which gets us one step closer to a tradable market bottom.
Be patient and be vigilant. Opportunities will abound later in 2022.
Model ETF Portfolio
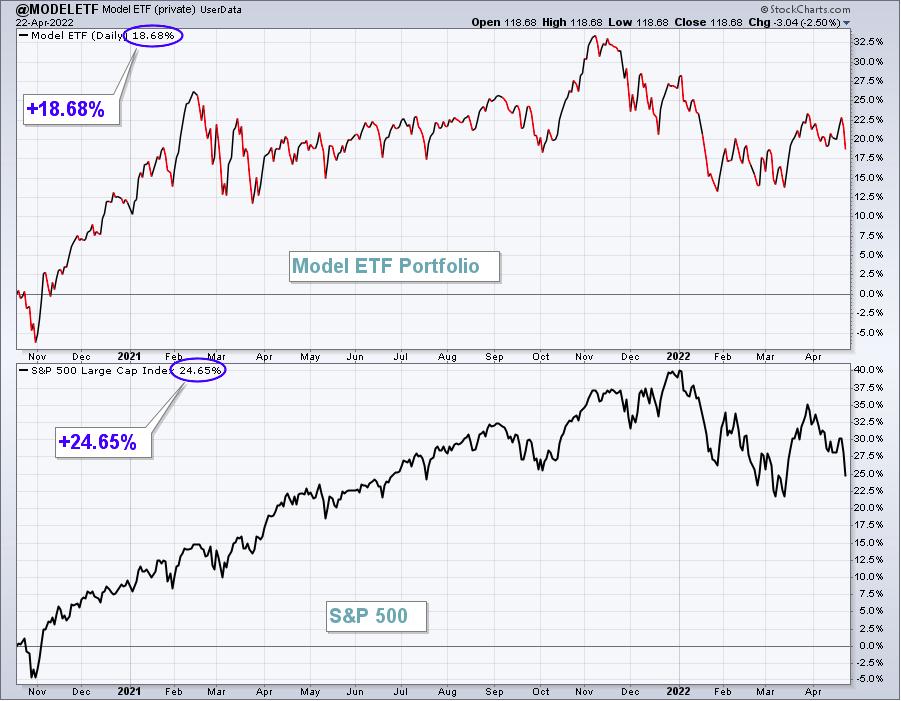
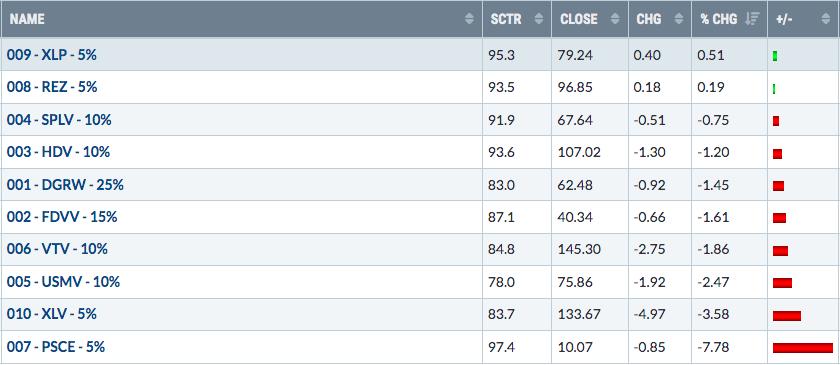
Our Model ETF Portfolio slid 1.31% last week, but easily beat the S&P 500.
Here's the updated inception-to-date chart of the Model ETF Portfolio:
Here are how the Model ETF Portfolio component ETFs performed last week:
Happy trading!
Tom Bowley, Chief Market Strategist
EarningsBeats.com
"Better timing. Better trades."