
EB Weekly Portfolio Report - Sunday, May 1, 2022
Updated Earnings Dates
According to StockCharts.com, several of our portfolio stocks changed their earnings dates. In order to ensure that your portfolio ChartLists have the latest earnings date information, you should re-download and overwrite the portfolio ChartLists in your account using the same links and passwords provided on our website. If you have any questions, feel free to reach out to us at "[email protected]".
Upcoming Earnings Reports
According to Zacks.com, the following companies will be reporting earnings this week and each is a component of one of our portfolios:
Monday, May 2: DVN, EXPE, ON
Tuesday, May 3: ABNB, AIG
Wednesday, May 4: PFGC, PXD, MET, ATO, CF
Thursday, May 5: DDOG, MCK, AOSL, VRTX, ED, LYV, NLOK
Friday, May 6: RUTH
PLEASE NOTE: The above companies were provided using earnings dates provided by StockCharts.com. My research is limited to what StockCharts.com provides and I also can make a mistake from time to time, so please double check for earnings dates for all companies that you own from a reputable source like Zacks.com. We do hold our portfolio stocks through one earnings report, but every EarningsBeats.com member must make his/her own investing/trading decisions about holding stocks into earnings reports as it's the most volatile (risky) time to own a stock.
Portfolio Rules and Objectives
Here are the common traits and objectives of our portfolios:
- There are 10 leading stocks from up to 10 leading industries in each portfolio (at the time of selection). Generally, there will only be one stock per industry group, but there could be exceptions.
- They are held for an entire 90-day period, with no stops in place. We strive for consistency, transparency, and simplicity in our portfolios. EB.com members may hold these stocks for the entire 90 days, trade them, use stops, etc., but for purposes of our calculation, we will make no exceptions to our "buy and hold for three months" strategy.
- Every stock will generally be held through ONE earnings report
- The expectation is that relative winners will carry the portfolio to outperformance
- They were all entered into as of the close on Friday, February 18th; members may choose to try to time better entries, but EB.com "purchased" as of February 18th's closing prices
- Primary objective is to outperform the benchmark S&P 500 over time; quarter-to-quarter performance can be extremely volatile, especially if significant rotation takes place intra-quarter
Here are several considerations for EB members:
- I would expect the Aggressive, Strong AD, and Earnings Reactions portfolios to be the riskiest, followed by the Model portfolio, and then the Income portfolio
- The Strong AD portfolio will be selected from a combination of rising accumulation/distribution lines and SCTRs above 70 at the time of selection. The Earnings Reactions portfolio is based on strong accumulation the day after its quarterly earnings are released and solid relative strength (vs. its peers). These are the only two portfolios that do NOT require revenue and EPS beats in their most recent quarterly earnings reports
- The Income portfolio stocks will all pay dividends, with the expected average dividend yield to be at least 1.0%
- Drawdowns (losses) should be much milder on the Income portfolio, with more volatility expected on the other four; please review inception-to-date charts below to gain an idea of the volatility associated with each
- I believe the larger drawdown on the Income portfolio at the beginning of the pandemic was an anomaly, occurring as many defensive, higher-yielding companies uncharacteristically underperformed during a market decline.
- Large drawdowns in the February through May 2021 and the November 2021 to February 2022 periods were due to the rapid rotation from growth stocks to value stocks; each quarter, our portfolios are based on themes and there is never a guarantee that our analysis and beliefs will be proven correct
- You should consider owning or trading these stocks in whatever manner is most comfortable for you; while we will buy all 10 stocks in the manner identified above, feel free to trade certain stocks or wait for pullbacks if the stocks are overbought
- We have no idea what risk each member is willing or able to take. We are not registered investment advisors so be sure you understand the risk you take. Please consult your financial advisor.
- EarningsBeats.com shareholders/employees may own all or some of the portfolio stocks from time to time.
Weekly Snapshot
Here's a weekly recap:
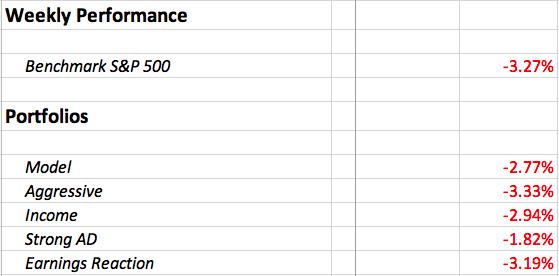
Weekly Summary
Benchmark S&P 500:
It was another awful week on Wall Street. Our major indices mostly lost 3%-4% on the week, adding to the mounting 2022 losses. We'll find a bottom at some point, but there really aren't any bullish signals being sent just yet - at least not based on sector performance. Check out the sector performance last week:
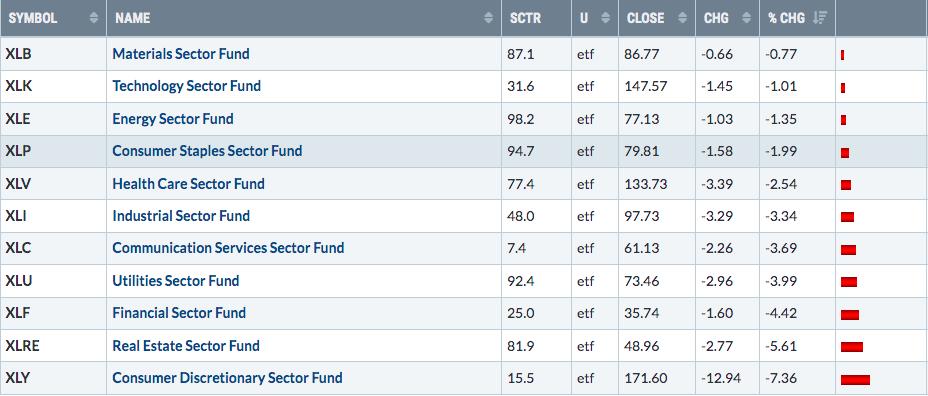
While technology performed well on a relative basis, 4 of the 6 worst performers were aggressive sectors. Software ($DJUSSW, -0.03%) was flat on the week, so there were bright relative spots, but overall it's hard to call a bottom with the type of rotation we see above.
Model Portfolio:
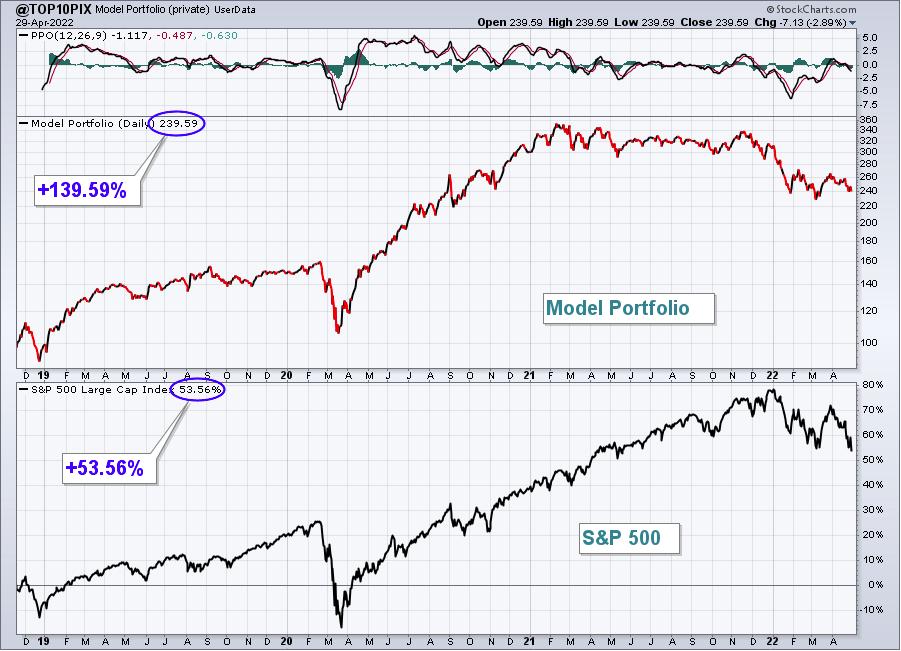
The Model Portfolio fell 2.77%, slightly outperforming the S&P 500. Here's the updated inception-to-date chart of the portfolio:
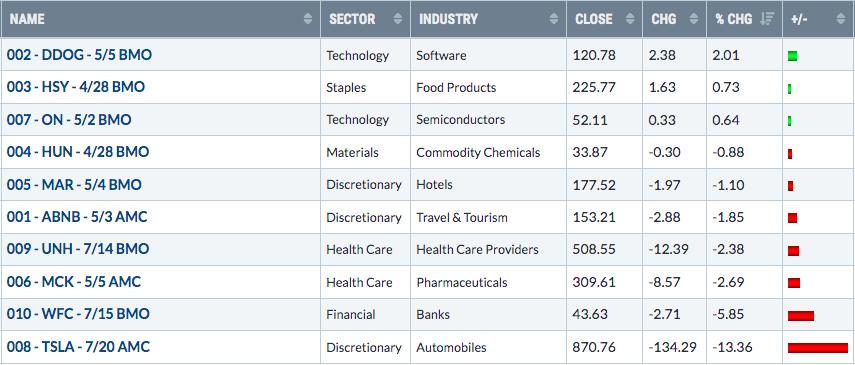
Here are how the Model portfolio component stocks performed last week:
Aggressive Portfolio:
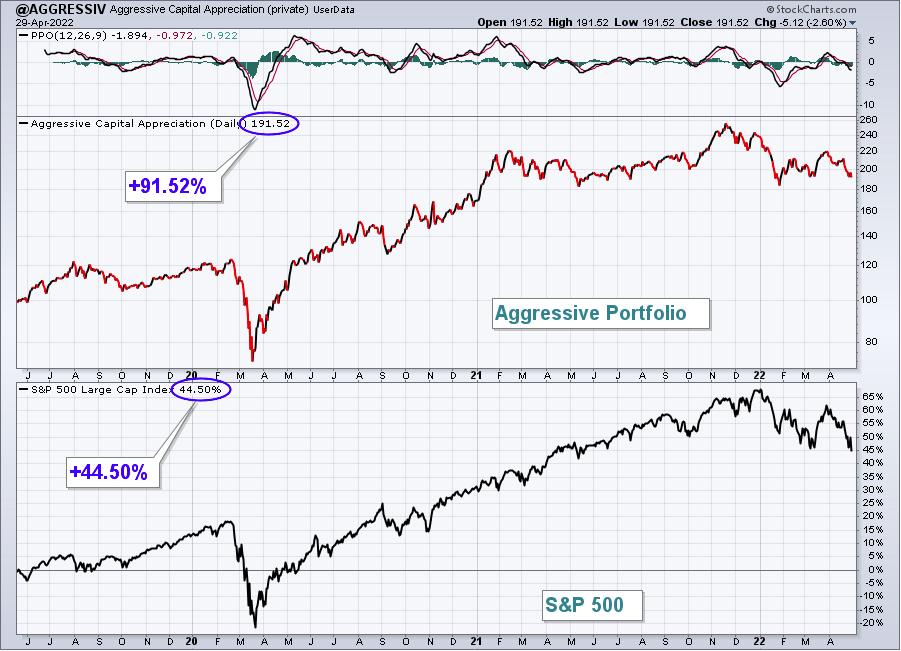
The Aggressive Portfolio dropped 3.33% last week, barely underperforming the S&P 500. Here's the updated inception-to-date chart of the portfolio:
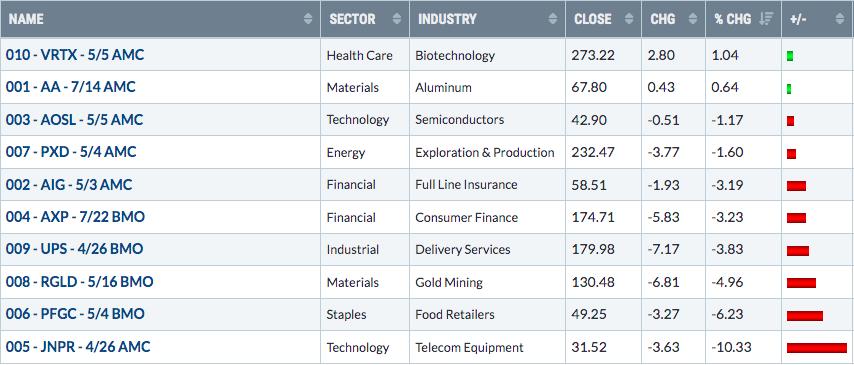
Here are how the Aggressive portfolio component stocks performed last week:
Income Portfolio:
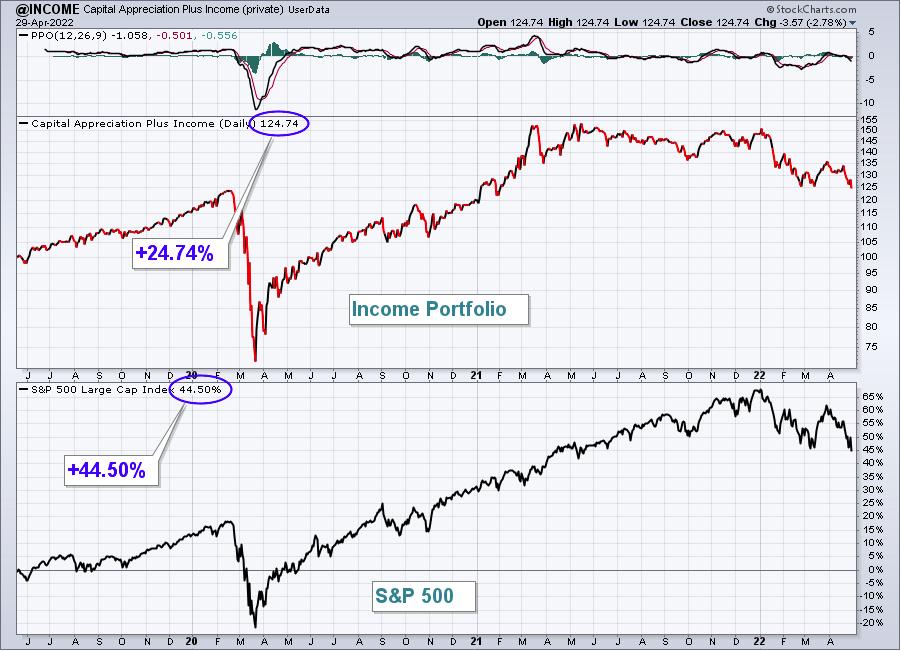
The Income Portfolio fell 2.94% last week, slightly outperforming the S&P 500. Here's the updated inception-to-date chart of the portfolio:
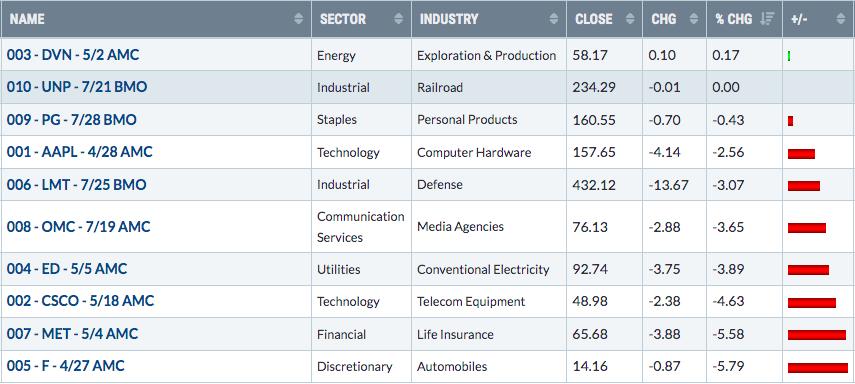
Here are how the Income portfolio component stocks performed last week:
Strong AD Portfolio:
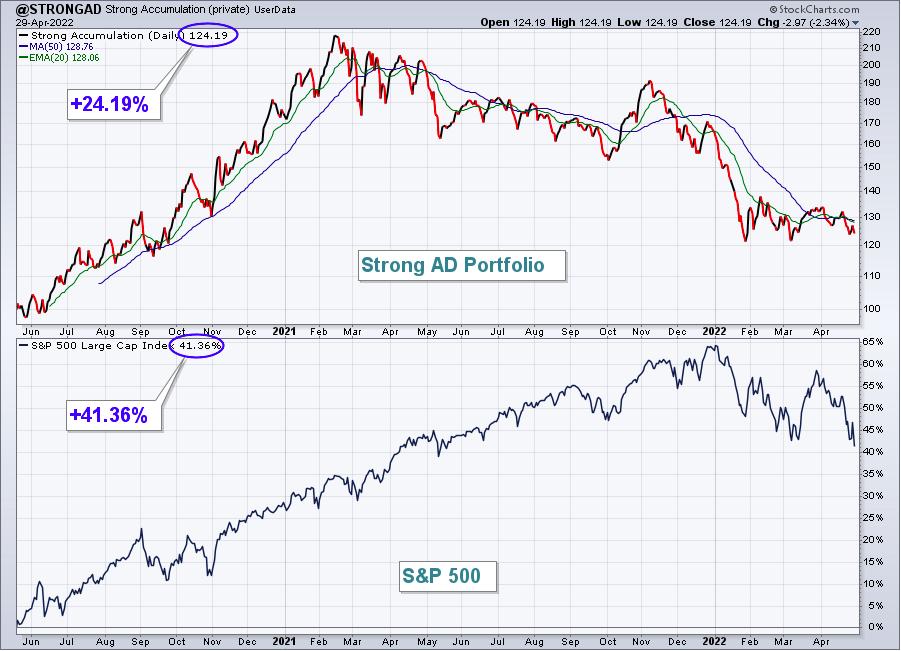
The Strong AD Portfolio fell 1.82% last week, outperforming the S&P 500. Here's the updated inception-to-date chart of the portfolio:
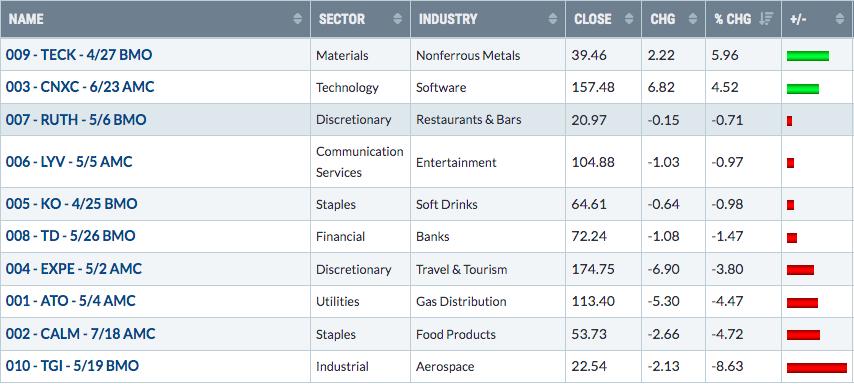
Here are how the Strong AD portfolio component stocks performed last week:
Earnings Reaction Portfolio:
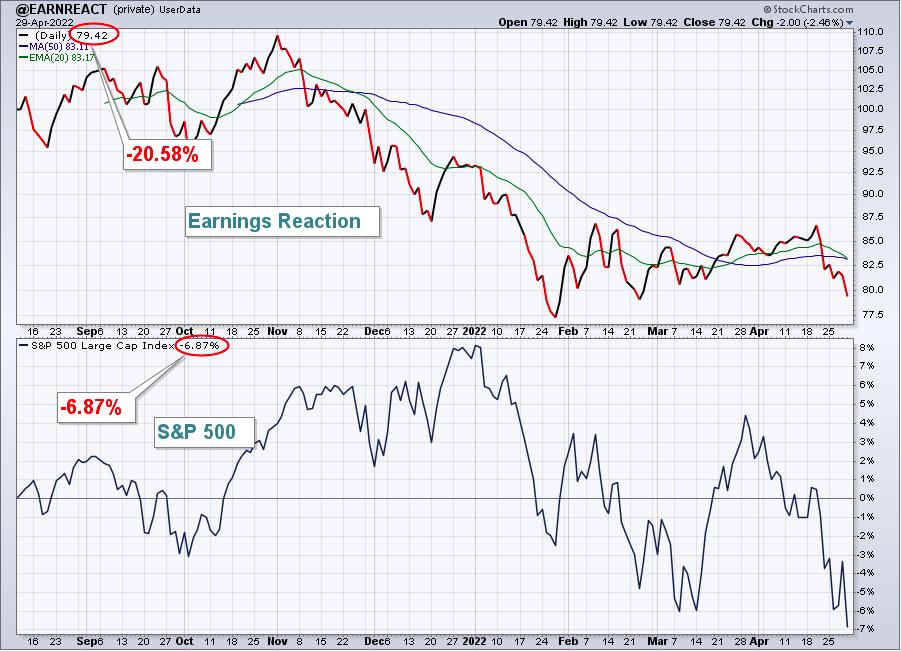
The Earnings Reaction Portfolio declined 3.19% last week, but slightly outperformed the S&P 500. Here's the updated inception-to-date chart of the portfolio:
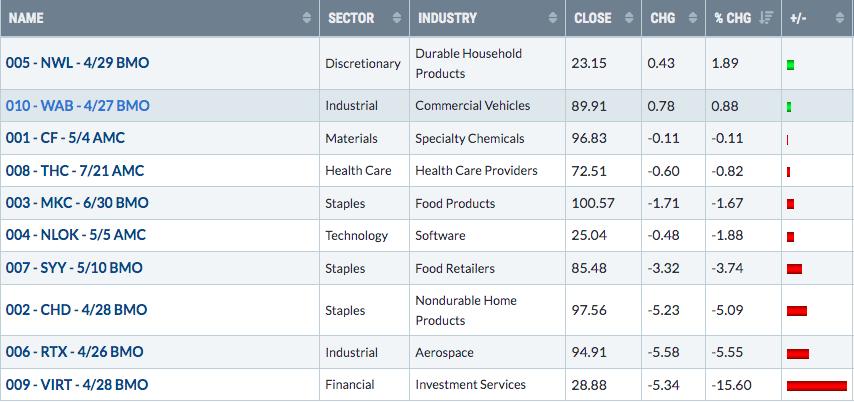
Here are how the Earnings Reaction portfolio component stocks performed last week:
The Week Ahead
Next week, 18 of our 50 portfolio stocks will report earnings. It's hard to feel very optimistic about the reactions to these earnings reports when recent solid reports are completed ignored. Right now, it's honestly not about earnings reports. That will matter again in time, but, for now, the entire market is repricing based upon an upcoming (current?) recession. Throw in the inevitable fear and panic that will accompany it and I'd expect to see more fallout. I want to remind you, however, that THE absolute best times to invest in the stock market is when panic selling kicks in and drives prices into a free fall. Here is an S&P 500 chart of the 21st century, showing that panicked lows (high VIX readings) are the best time to buy:
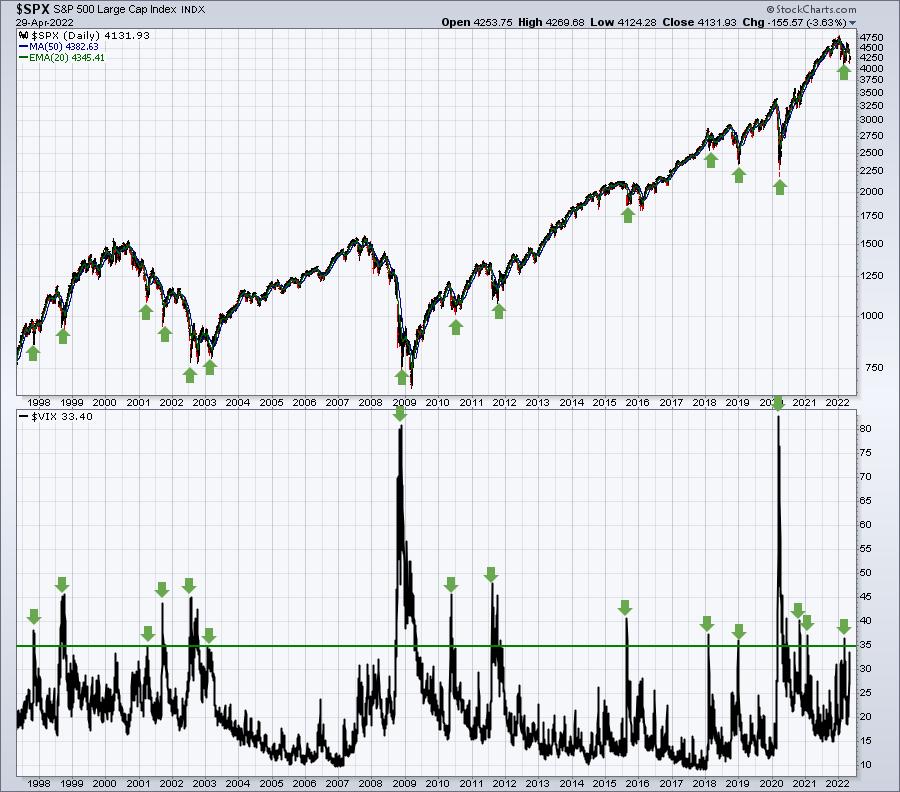
If you sold early in 2022 and are waiting for the right time to re-enter, buying a portion on this breakdown makes perfect sense. The VIX finished at 33.76. Any prior buys with the VIX above 35 (green arrows) has proven to be a GREAT investment long-term. Sometimes, the VIX moves higher than 35, so if you buy when the VIX hits 35, it won't always allow you to buy at the exact bottom. However, when the inevitable snap-back rally ensues, you'll do just fine.
Model ETF Portfolio
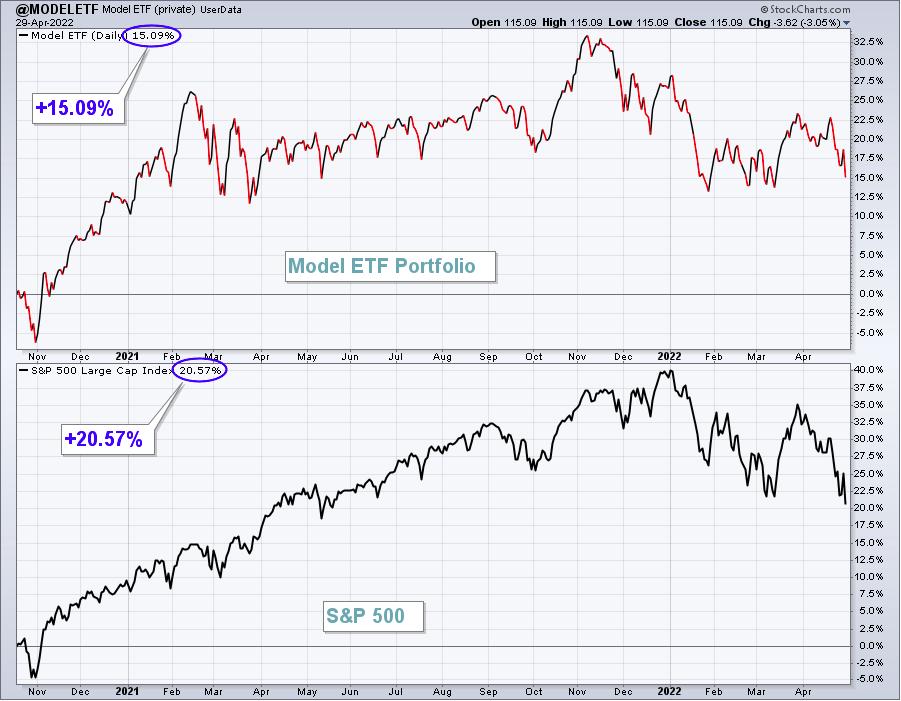
Our Model ETF Portfolio slid 3.02% last week, but did manage to outperform the benchmark S&P 500.
Here's the updated inception-to-date chart of the Model ETF Portfolio:
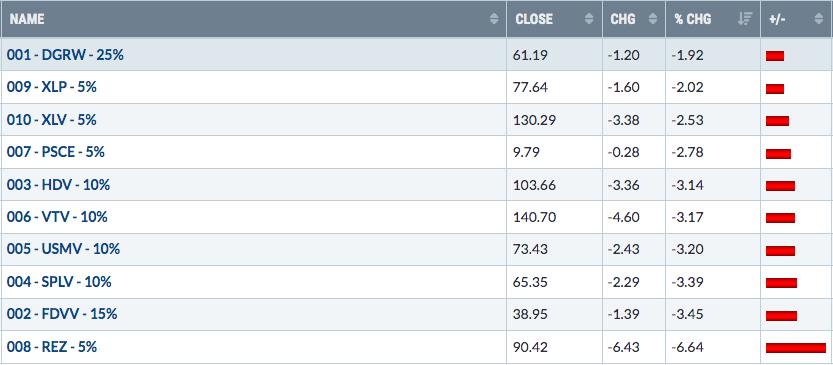
Here are how the Model ETF Portfolio component ETFs performed last week:
Happy trading!
Tom Bowley, Chief Market Strategist
EarningsBeats.com
"Better timing. Better trades."