
EB Weekly Portfolio Report - Sunday, May 8, 2022
Upcoming Earnings Reports
According to Zacks.com, the following companies will be reporting earnings this week and each is a component of one of our portfolios:
Monday, May 9: None
Tuesday, May 10: SYY
Wednesday, May 11: PFGC
Thursday, May 12: None
Friday, May 13: None
PLEASE NOTE: The above companies were provided using earnings dates provided by StockCharts.com. My research is limited to what StockCharts.com provides and I also can make a mistake from time to time, so please double check for earnings dates for all companies that you own from a reputable source like Zacks.com. We do hold our portfolio stocks through one earnings report, but every EarningsBeats.com member must make his/her own investing/trading decisions about holding stocks into earnings reports as it's the most volatile (risky) time to own a stock.
Portfolio Rules and Objectives
Here are the common traits and objectives of our portfolios:
- There are 10 leading stocks from up to 10 leading industries in each portfolio (at the time of selection). Generally, there will only be one stock per industry group, but there could be exceptions.
- They are held for an entire 90-day period, with no stops in place. We strive for consistency, transparency, and simplicity in our portfolios. EB.com members may hold these stocks for the entire 90 days, trade them, use stops, etc., but for purposes of our calculation, we will make no exceptions to our "buy and hold for three months" strategy.
- Every stock will generally be held through ONE earnings report
- The expectation is that relative winners will carry the portfolio to outperformance
- They were all entered into as of the close on Friday, February 18th; members may choose to try to time better entries, but EB.com "purchased" as of February 18th's closing prices
- Primary objective is to outperform the benchmark S&P 500 over time; quarter-to-quarter performance can be extremely volatile, especially if significant rotation takes place intra-quarter
Here are several considerations for EB members:
- I would expect the Aggressive, Strong AD, and Earnings Reactions portfolios to be the riskiest, followed by the Model portfolio, and then the Income portfolio
- The Strong AD portfolio will be selected from a combination of rising accumulation/distribution lines and SCTRs above 70 at the time of selection. The Earnings Reactions portfolio is based on strong accumulation the day after its quarterly earnings are released and solid relative strength (vs. its peers). These are the only two portfolios that do NOT require revenue and EPS beats in their most recent quarterly earnings reports
- The Income portfolio stocks will all pay dividends, with the expected average dividend yield to be at least 1.0%
- Drawdowns (losses) should be much milder on the Income portfolio, with more volatility expected on the other four; please review inception-to-date charts below to gain an idea of the volatility associated with each
- I believe the larger drawdown on the Income portfolio at the beginning of the pandemic was an anomaly, occurring as many defensive, higher-yielding companies uncharacteristically underperformed during a market decline.
- Large drawdowns in the February through May 2021 and the November 2021 to February 2022 periods were due to the rapid rotation from growth stocks to value stocks; each quarter, our portfolios are based on themes and there is never a guarantee that our analysis and beliefs will be proven correct
- You should consider owning or trading these stocks in whatever manner is most comfortable for you; while we will buy all 10 stocks in the manner identified above, feel free to trade certain stocks or wait for pullbacks if the stocks are overbought
- We have no idea what risk each member is willing or able to take. We are not registered investment advisors so be sure you understand the risk you take. Please consult your financial advisor.
- EarningsBeats.com shareholders/employees may own all or some of the portfolio stocks from time to time.
Weekly Snapshot
Here's a weekly recap:
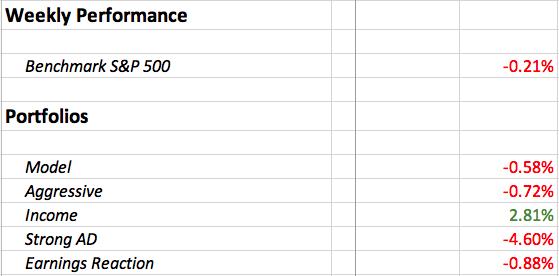
Weekly Summary
Benchmark S&P 500:
What a crazy week! After the Federal Reserve meeting concluded with its policy statement at 2pm ET on Wednesday, U.S. equities exploded higher into the close. That rally came after Fed Chief Jay Powell indicated that the Federal Reserve would not get MORE aggressive than hiking 50 basis points at a time. That's a little like saying that you're not planning to throw kerosene on a burning house. The house is still burning. Anyhow, there was an initial reaction to the upside - and it was a HUGE rally. Immediately following the policy decision, stocks fell. The NASDAQ was down close to 100 points. By the time the day ended a little more than an hour later, the NASDAQ was up 400. But the relief didn't last long as the NASDAQ then fell roughly 1000 points (7%+) in 24 hours. For the week, however, the NASDAQ fell just 1.54%. The S&P 500 was down just 0.21%, but it certainly felt like a much worse week, because of how we finished Thursday and Friday.
As far as rotation goes, here were how the sectors performed last week:
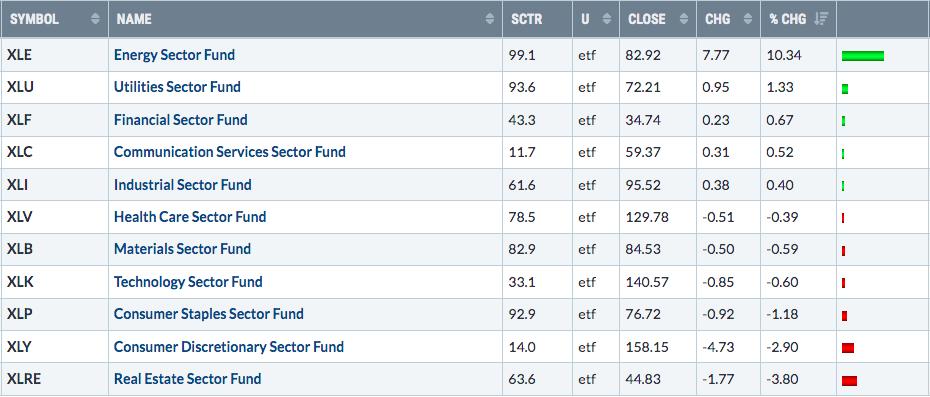
The worst part of the above picture is that consumer stocks continue to get hit and discretionary more so. Real estate (XLRE) likely suffered from the rapidly-rising rates. Meanwhile, crude oil prices ($WTIC) jumped nearly 5% last week to end at $109.77 per barrel. That sent energy (XLE) soaring again. Energy could easily move higher as the technical hurdles (primarily overbought conditions and negative divergence) have diminished.
Money rotated HEAVILY out of treasuries as the 10-year treasury yield ($TNX) rose 24 basis points to close the week at 3.12%. We're quickly approaching a very critical yield resistance level at 3.25%. We have not seen the TNX close above 3.25% since 2011. While I don't really view interest rates as being problematic until we reach 4.5%-5.0%, I do recognize that a move above 3.25% is likely to trigger another selling tsunami in both bonds and equities, so let's stay on our toes.
Model Portfolio:
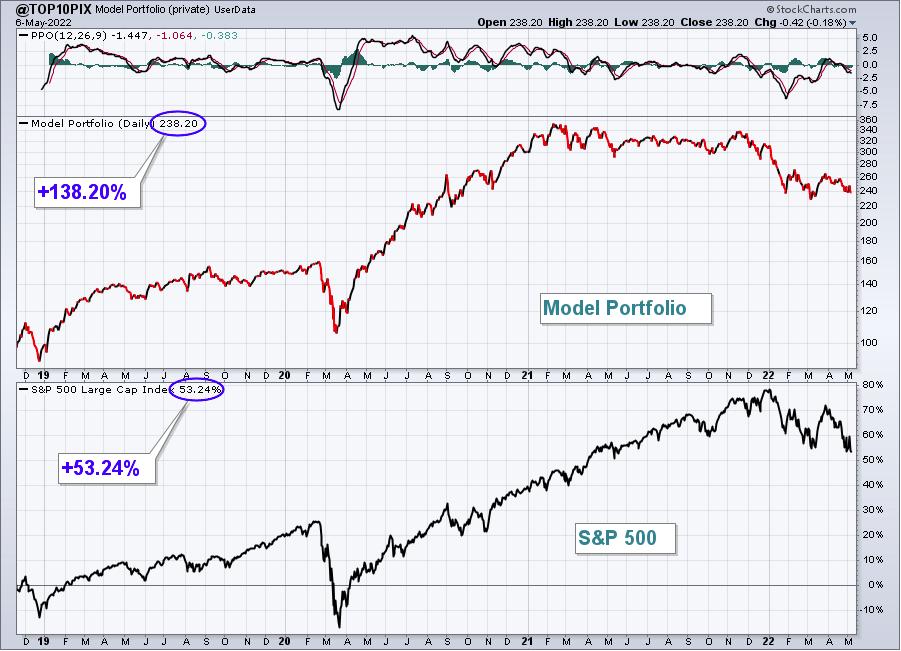
The Model Portfolio fell 0.58%, slightly underperforming the S&P 500. Here's the updated inception-to-date chart of the portfolio:
Here are how the Model portfolio component stocks performed last week:
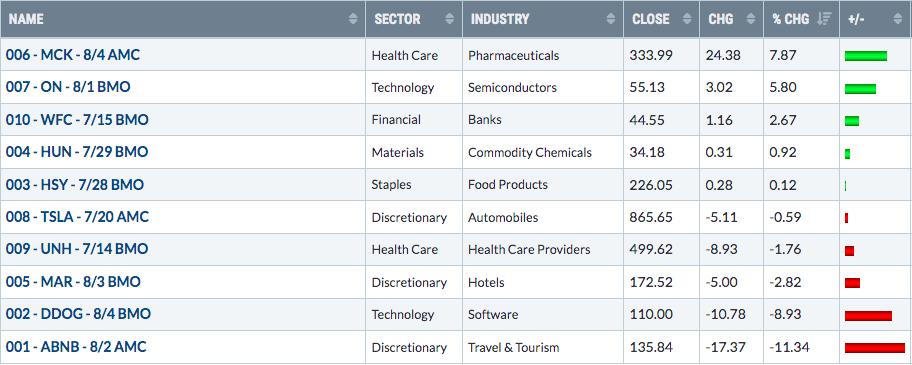
ABNB beat analyst estimates as to both revenues and earnings, and then raised guidance for this year as well. Wall Street torched the stock anyway. It has now moved down to a key price support:
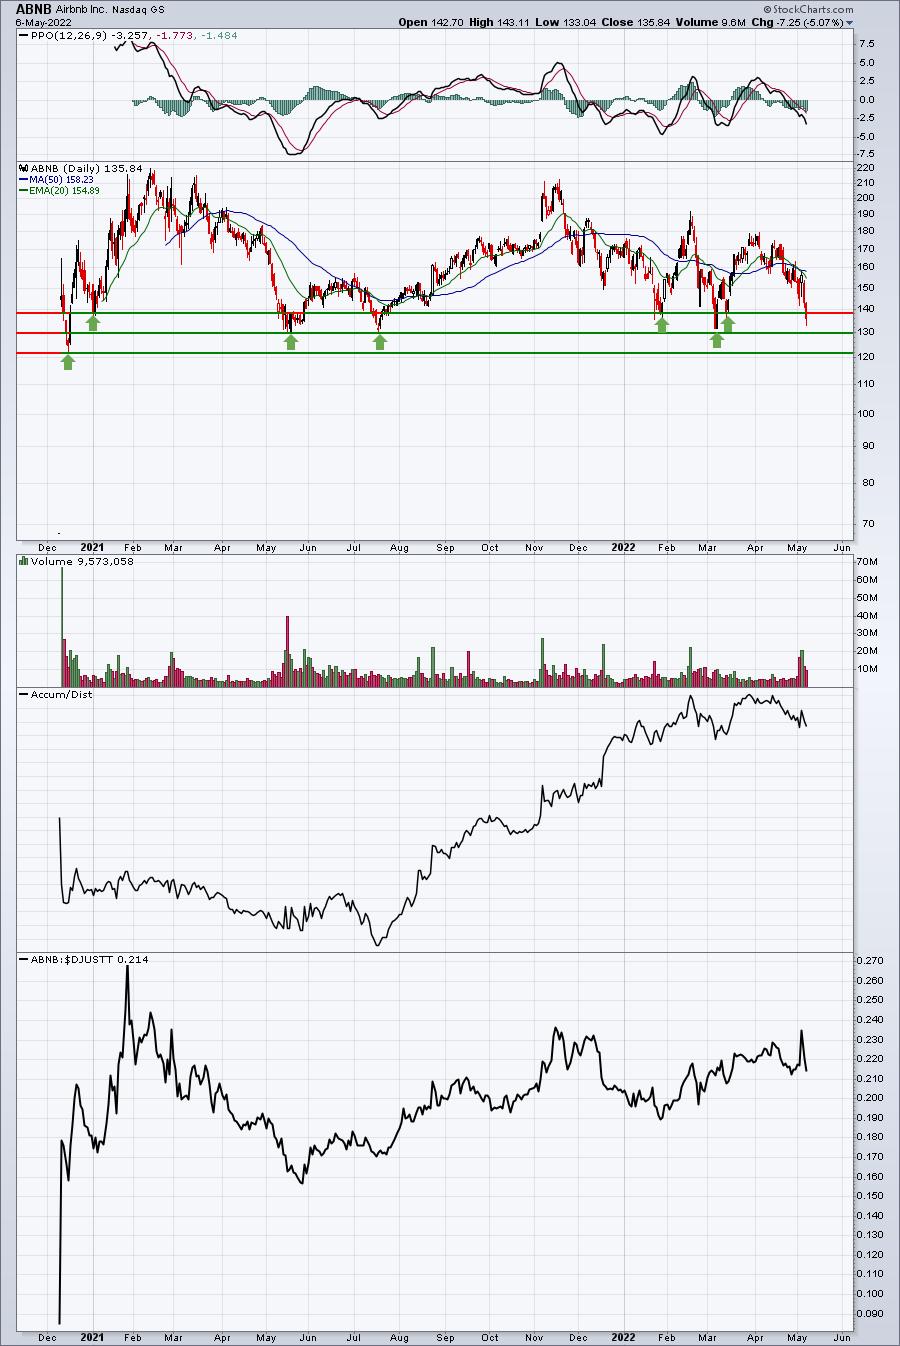
We never know for sure whether a key support level will hold, but this 120-140 area on the ABNB chart has seen many successful tests thus far. The AD line is strong and I love the stock, but right now growth stocks are out of favor. Will that cause a major breakdown in ABNB shares? We'll know soon enough.
Aggressive Portfolio:
The Aggressive Portfolio dropped 0.72% last week, also slightly underperforming the S&P 500. Here's the updated inception-to-date chart of the portfolio:
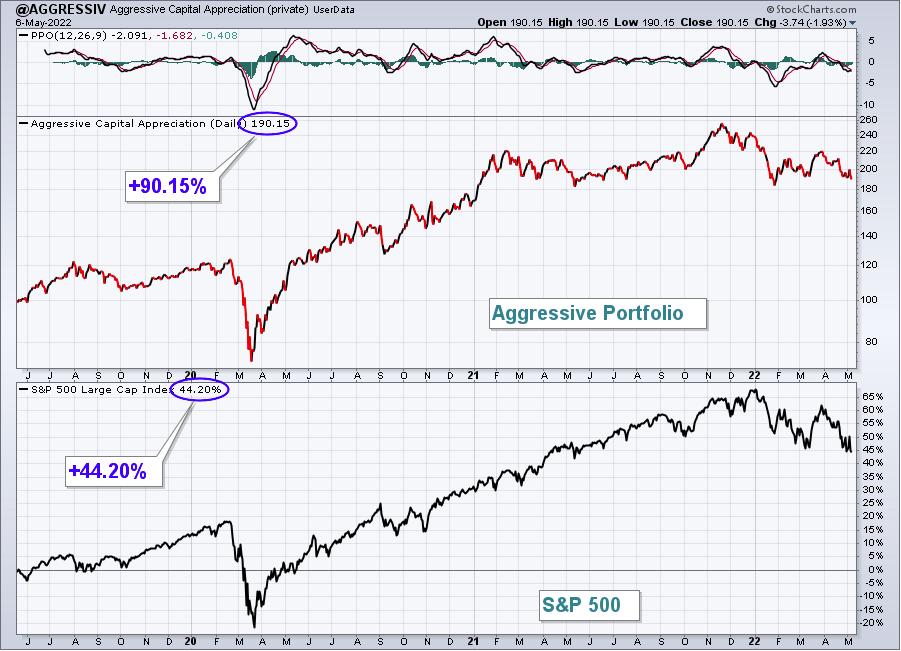
Here are how the Aggressive portfolio component stocks performed last week:
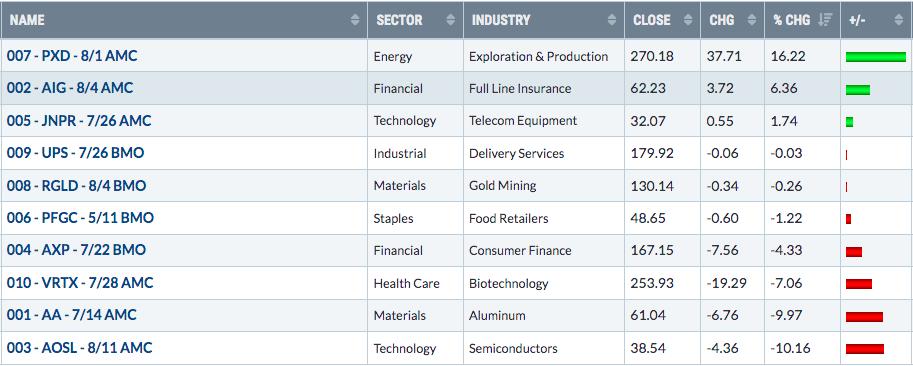
AA had another rough week and its run could be over, but I believe it will hold onto channel and price support as shown below:
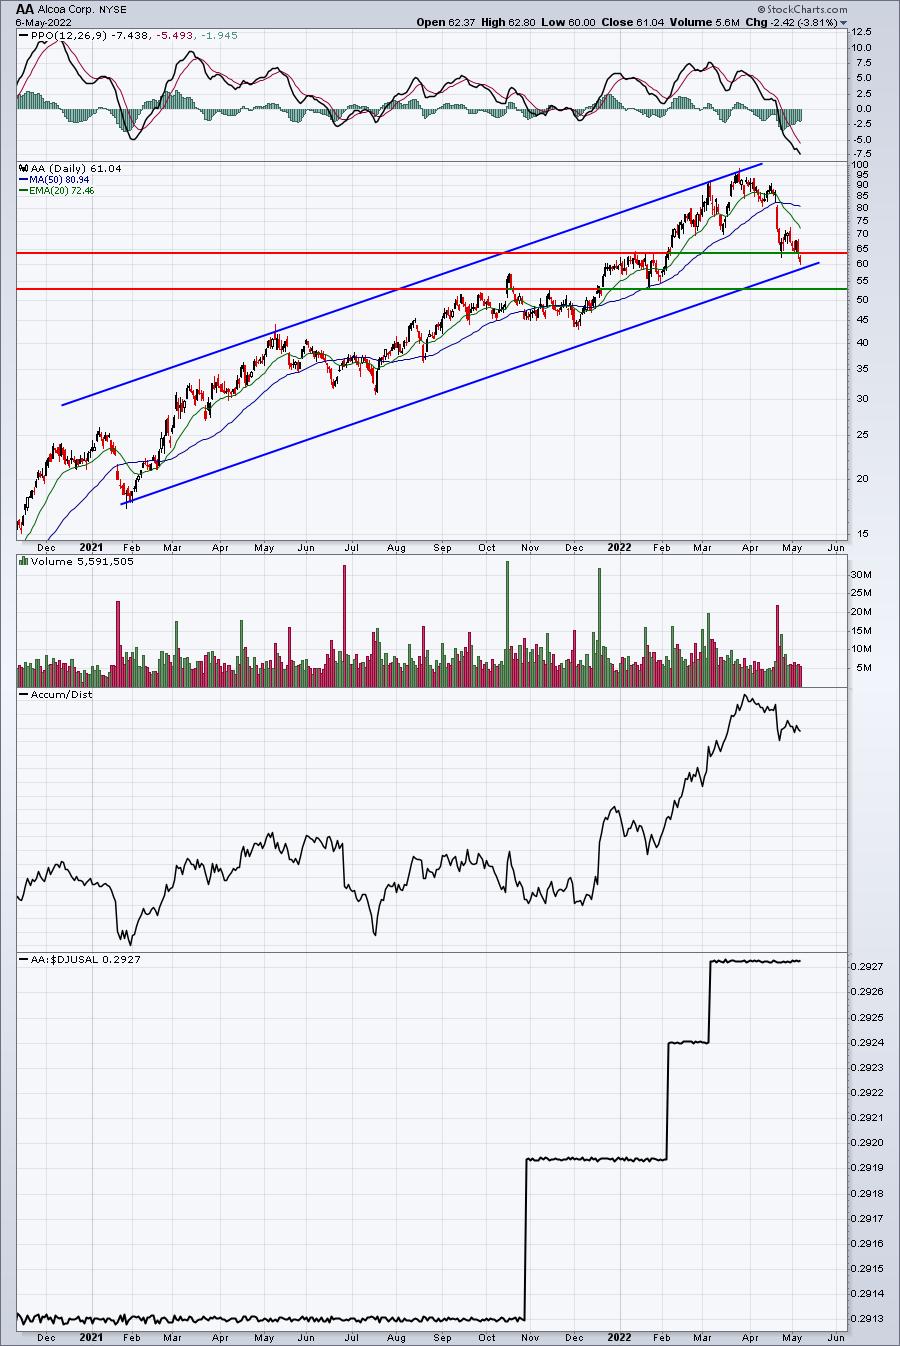
I look for AA to hang onto channel support near 60. If it doesn't, then there's key price support close to 53. That would be my final line in the sand for the stock.
Income Portfolio:
The Income Portfolio gained 2.81% last week, easily outperforming the S&P 500. Here's the updated inception-to-date chart of the portfolio:
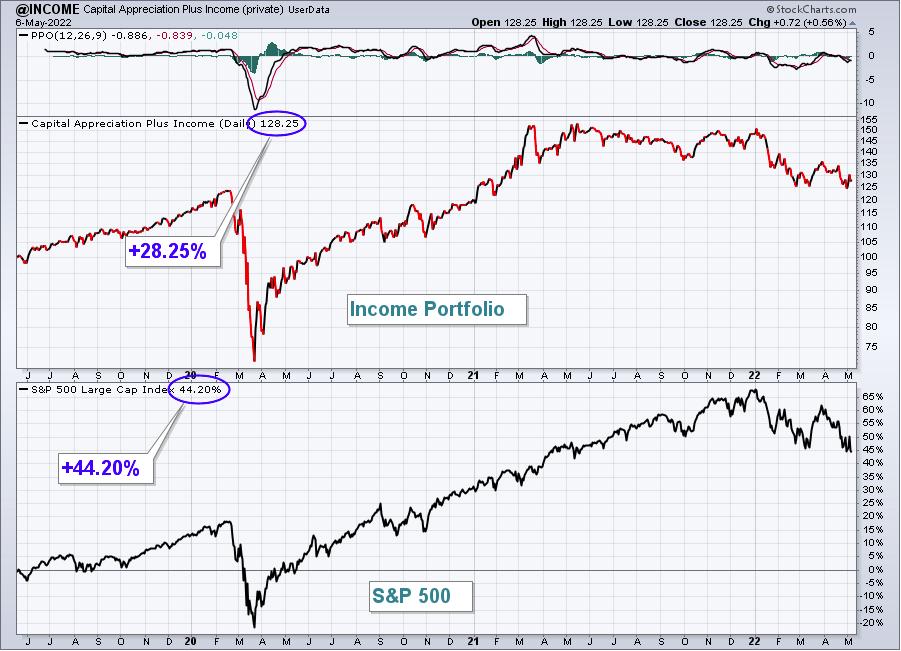
Here are how the Income portfolio component stocks performed last week:
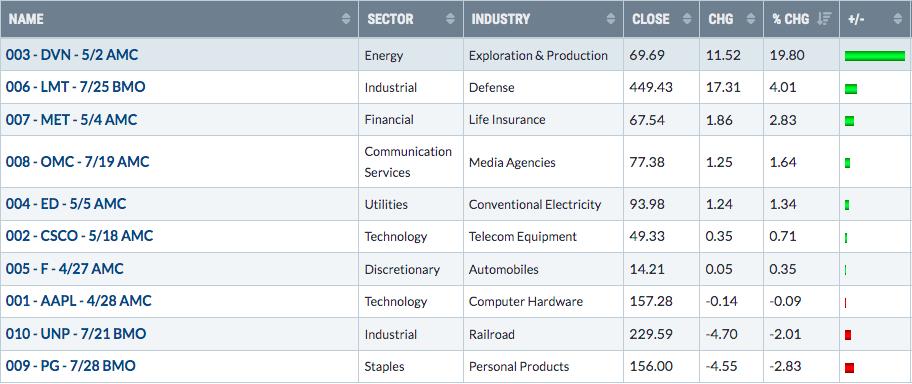
UNP finally made its way back down to its prior breakout level, which typically provides excellent support:
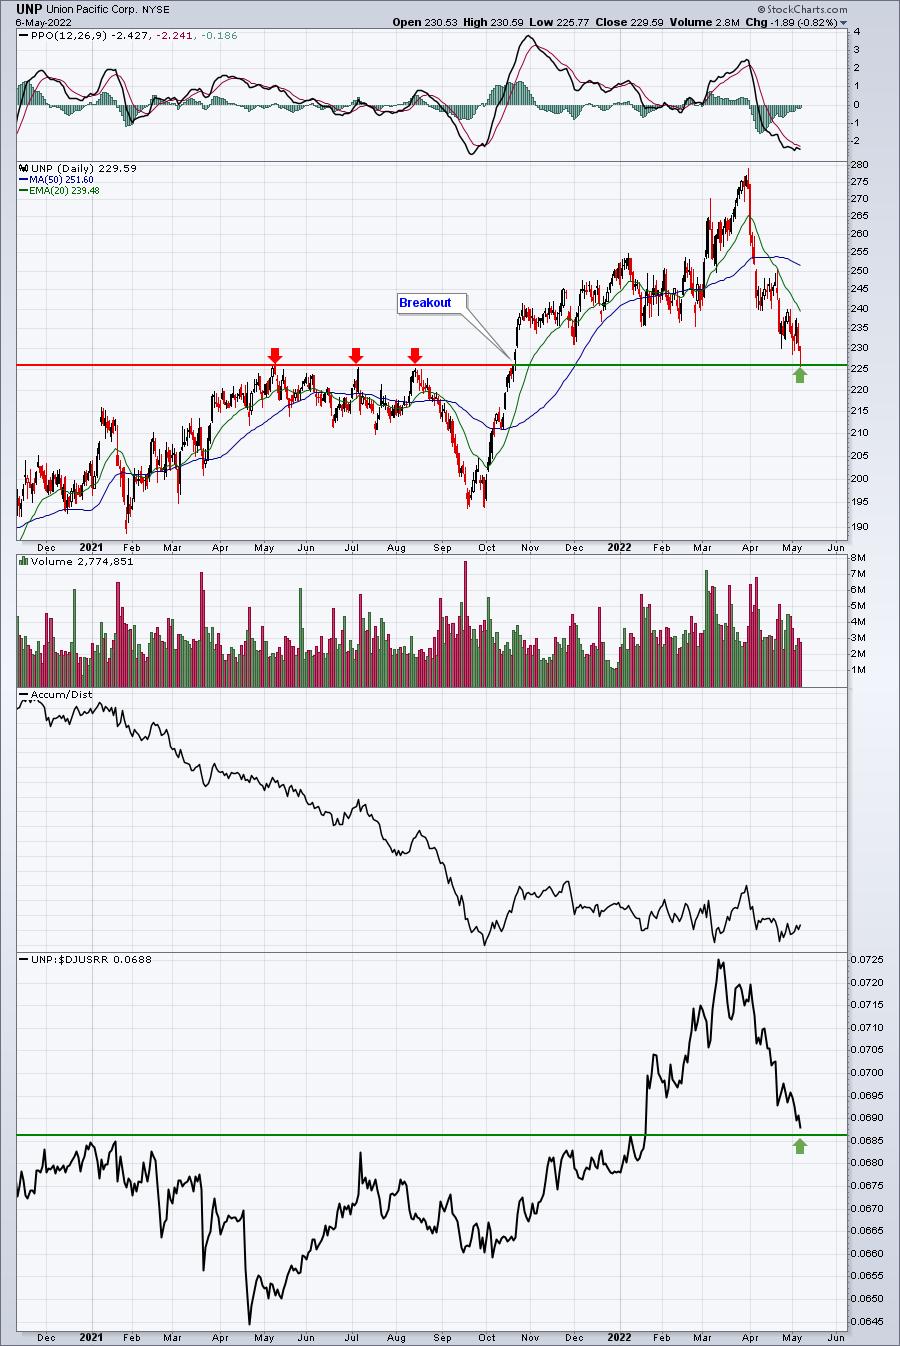
Look for a bounce off 225 support. From a trading perspective, you could use the 225 level as a closing stop, while looking for a rebound to the 20-day EMA.
Strong AD Portfolio:
The Strong AD Portfolio fell 4.60% last week, lagging the S&P 500 badly. Here's the updated inception-to-date chart of the portfolio:
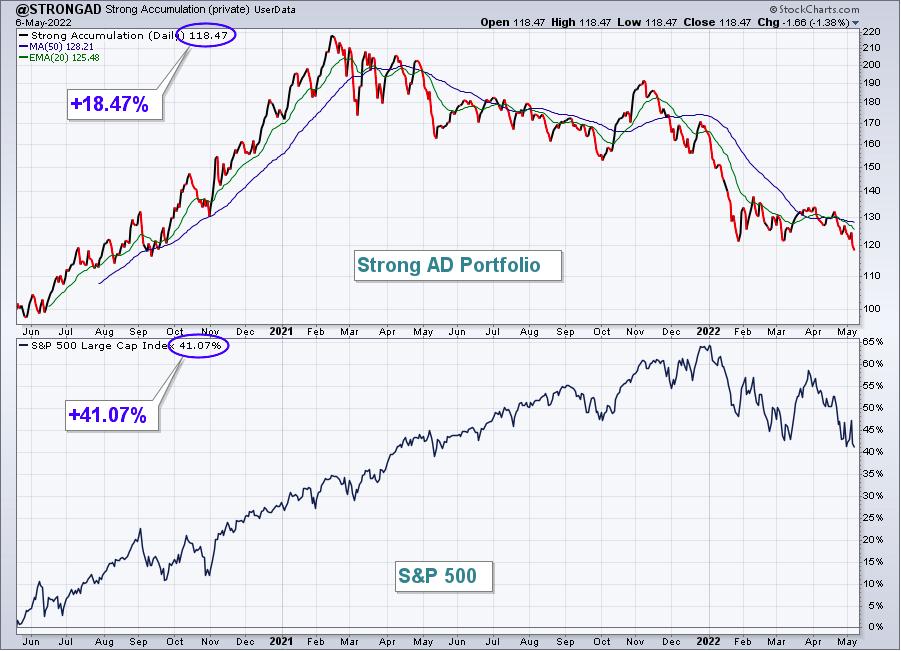
Here are how the Strong AD portfolio component stocks performed last week:
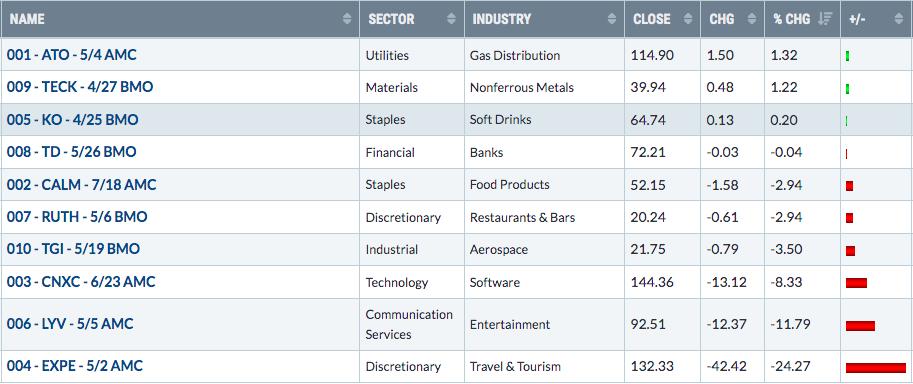
The weight of the travel & tourism ($DJUSTT) industry's bearishness finally took its toll on EXPE, which lost near a quarter of its value last week. Despite beating analysts estimates, EXPE lost short-term price support and now appears heading to test support close to 120:
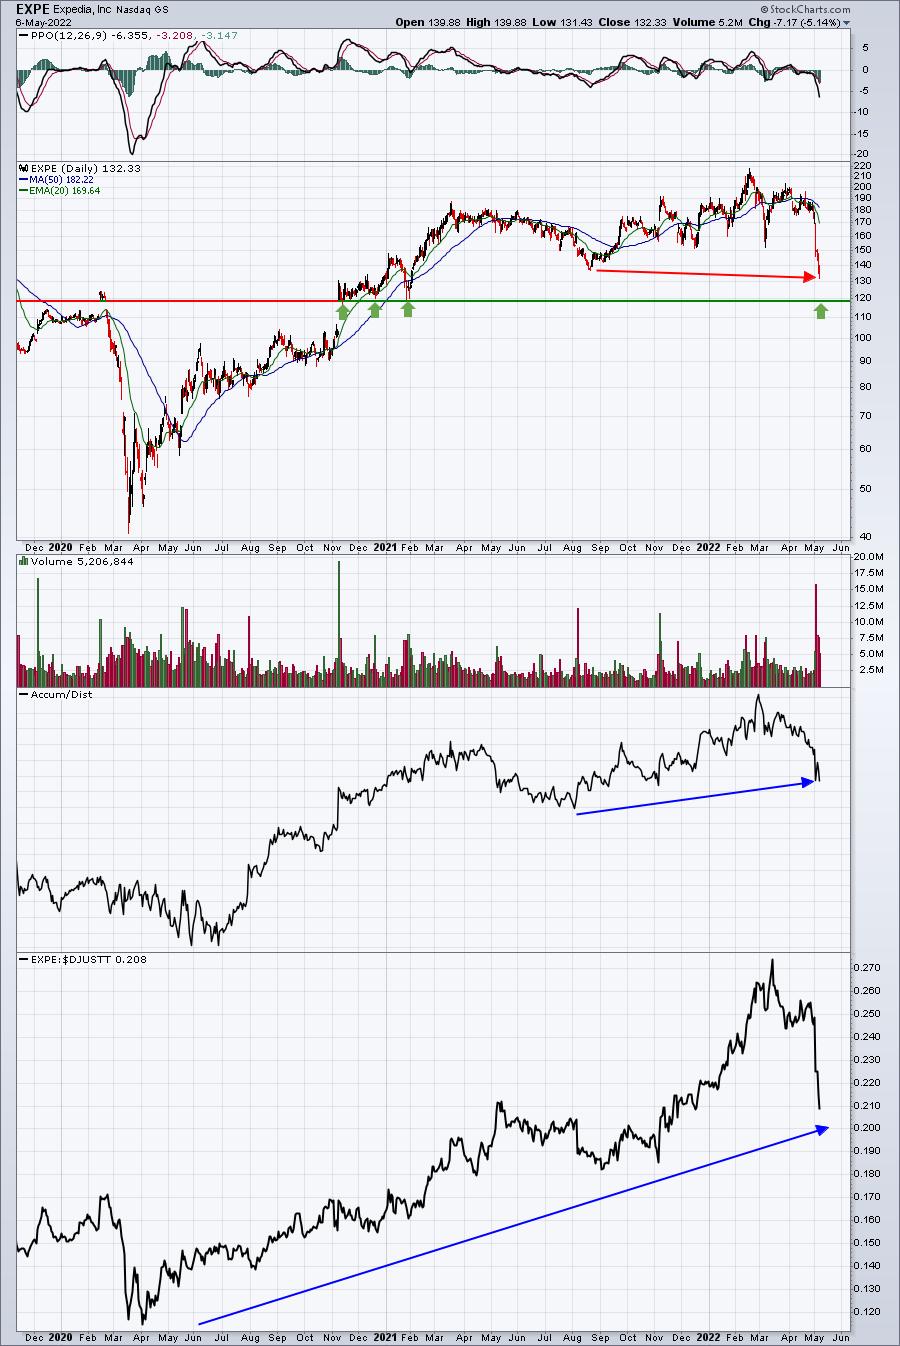
When growth stocks are out of favor AND your industry group stinks, it's eventually going to take a toll. I'm encouraged by EXPE printing a higher AD line with a lower price and also its overall relative strength vs. its group. EXPE, like so many other great companies, just needs a better market environment - and it's coming.
Earnings Reaction Portfolio:
The Earnings Reaction Portfolio declined 0.88% last week, slightly underperforming the S&P 500. Here's the updated inception-to-date chart of the portfolio:
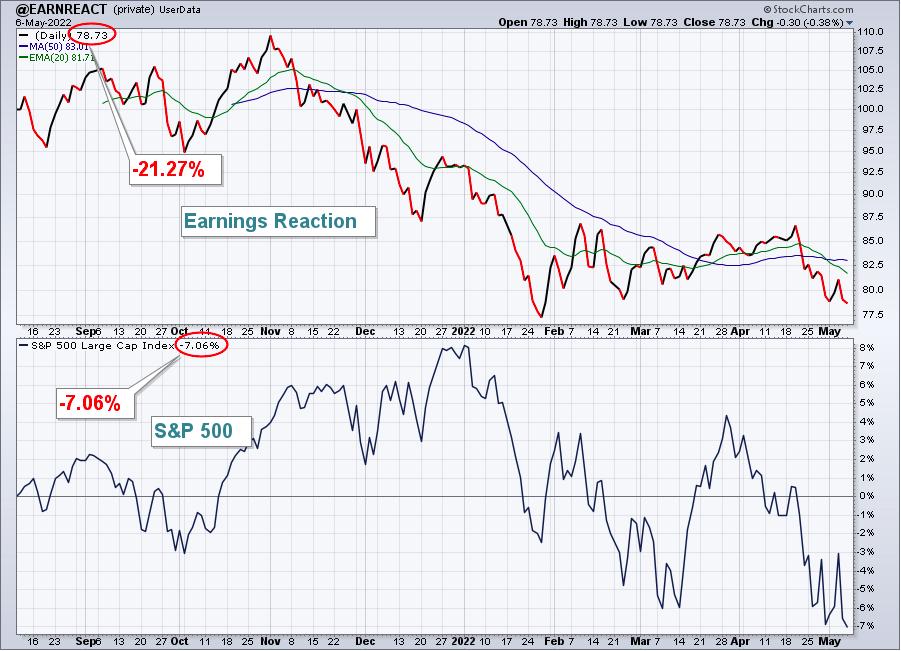
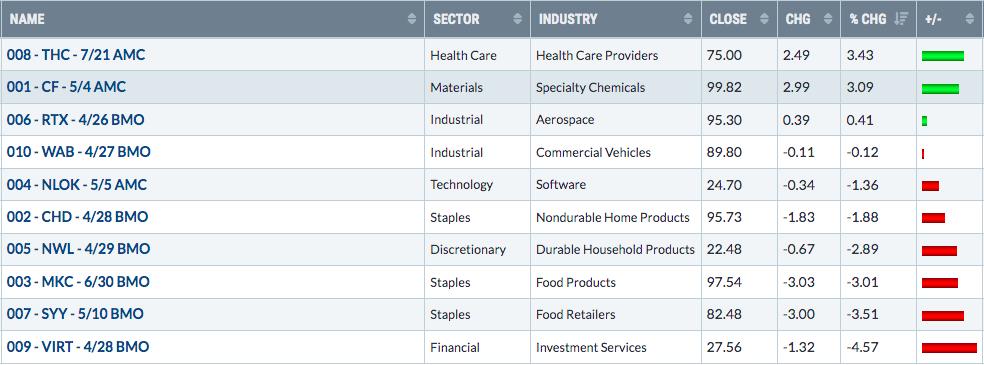
Here are how the Earnings Reaction portfolio component stocks performed last week:
My preference is to trade defensive stocks on the long side, if I'm going to take long positions. And obviously, I'd like to buy them at or near price support, if at all possible. I own one stock right now and it's CHD, which hit key price support on Thursday/Friday, so I took a small position:
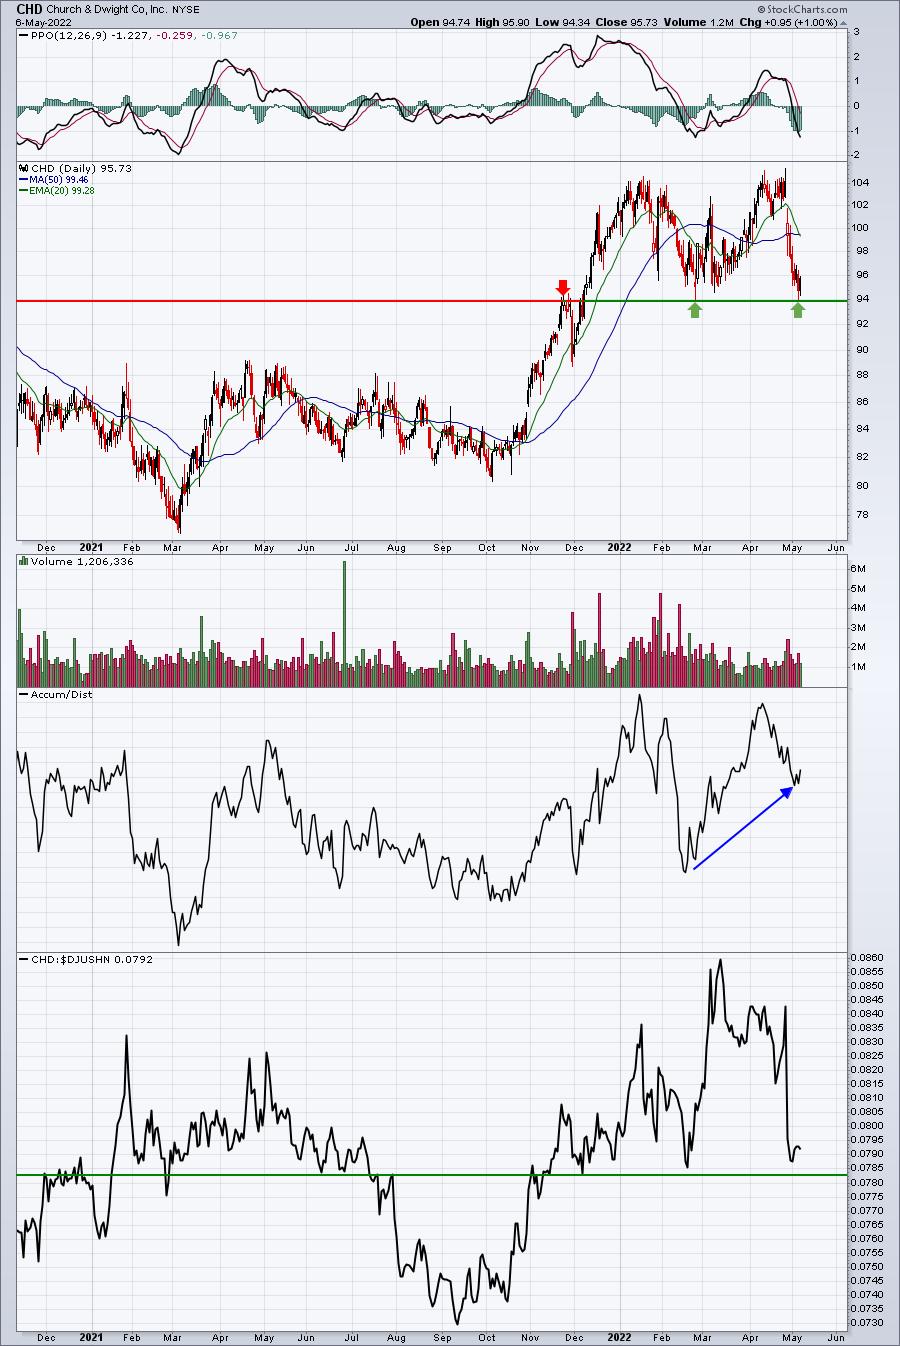
Again, I find its AD line, which is much higher than it was at the prior price low, to be a positive for the stock.
The Week Ahead
There has still been no meaningful rotation into more aggressive areas of the market and that always makes me nervous, believing we have more downside action ahead. It doesn't mean we cannot bounce, but recent action suggests that my earlier discussions about possibly seeing 3500-3800 on the S&P 500 remains totally in play. Interest rates remain on the rise and this is killing growth stocks. The following chart shows the relationship of growth stocks vs. value stocks at the large cap, mid cap, and small cap levels:
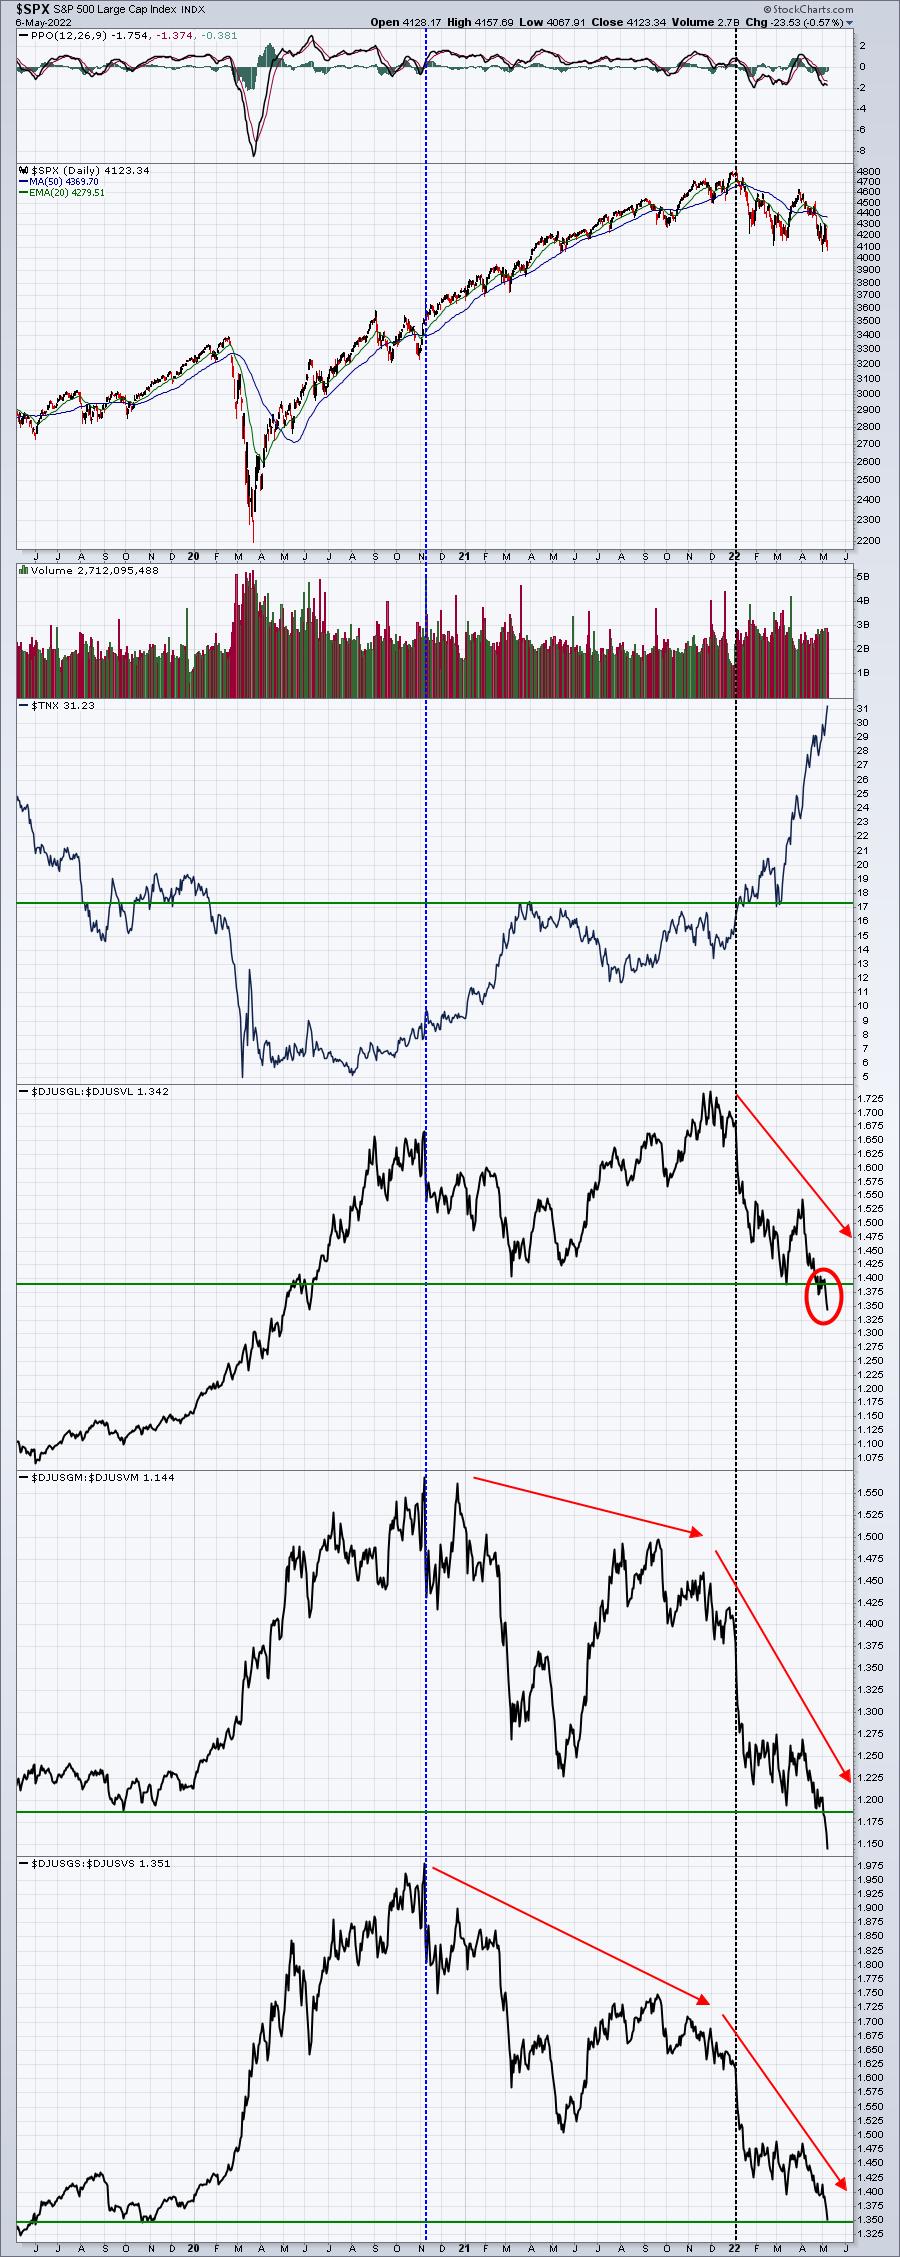
Tell me if you see something bullish here, because I sure don't. The blue-dotted vertical line really kicked off the bearishness in growth stocks at the small and mid cap levels, but it was the TNX breakout above 1.75% that really turned the tables on the bulls. Large cap growth stocks ($DJUSGS) began underperforming and that was the final straw. I talked about this earlier in 2022. When the large cap growth stocks began to underperform, the S&P 500 was toast, because many of these names like AAPL, AMZN, TSLA, GOOGL, NVDA, FB, etc. have such a huge weighting in the S&P 500 index, and are weighted even heavier in the NASDAQ.
There is little chance the stock market rallies meaningfully until these ratios reverse and begin trending higher.
Model ETF Portfolio
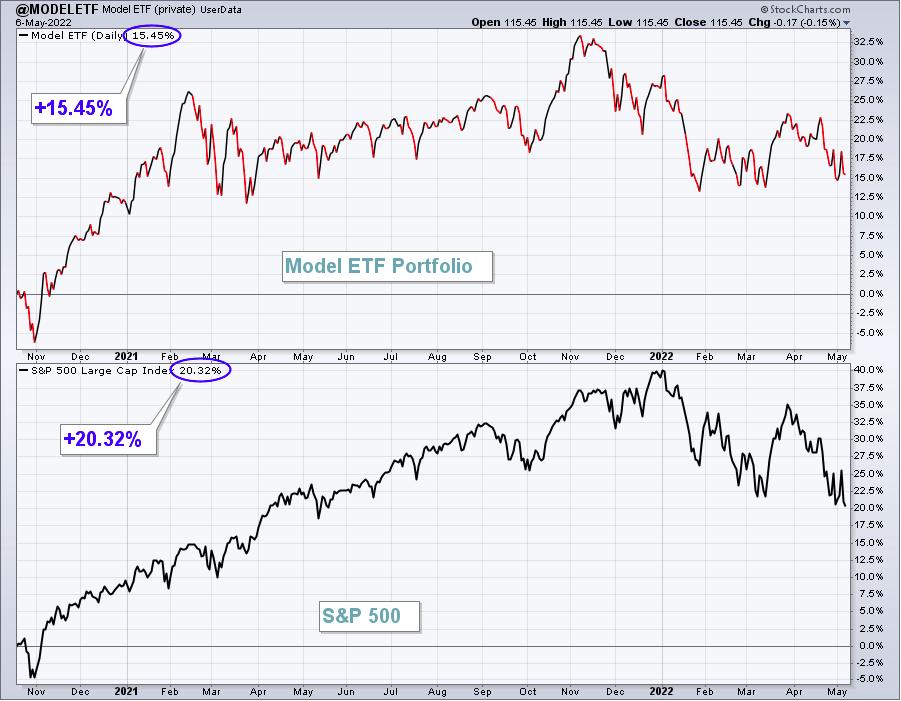
Our Model ETF Portfolio gained 0.31% last week, outperforming the benchmark S&P 500.
Here's the updated inception-to-date chart of the Model ETF Portfolio:
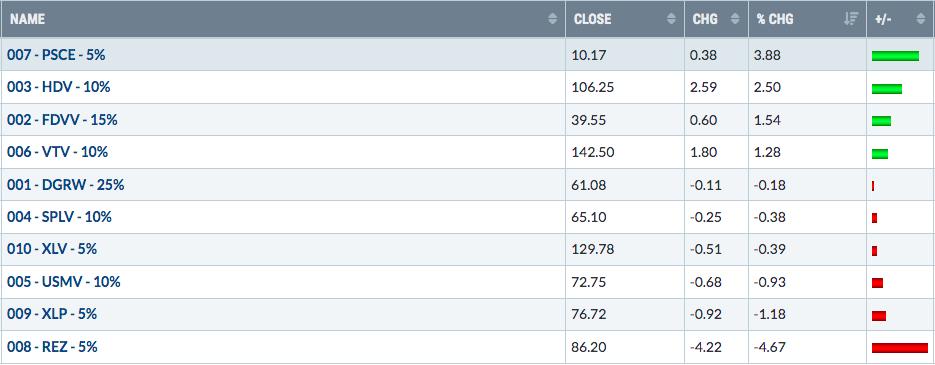
Here are how the Model ETF Portfolio component ETFs performed last week:
Happy trading!
Tom Bowley, Chief Market Strategist
EarningsBeats.com
"Better timing. Better trades."