
EB Weekly Portfolio Report - Saturday, May 14, 2022
Spring Special
Our best deal of the year begins on Monday, May 16th! This is the best time to lock in your membership for an extended period of time and save A LOT of money. We want to thank all of you for your continued support during an incredibly difficult market environment and this is one way for us to say THANK YOU!
Details of our Spring Special will be out on Monday!
Upcoming Earnings Reports
According to Zacks.com, the following companies will be reporting earnings this week and each is a component of one of our portfolios:
Monday, May 16: None
Tuesday, May 17: None
Wednesday, May 18: CSCO
Thursday, May 19: None
Friday, May 20: None
PLEASE NOTE: The above companies were provided using earnings dates provided by StockCharts.com. My research is limited to what StockCharts.com provides and I also can make a mistake from time to time, so please double check for earnings dates for all companies that you own from a reputable source like Zacks.com. We do hold our portfolio stocks through one earnings report, but every EarningsBeats.com member must make his/her own investing/trading decisions about holding stocks into earnings reports as it's the most volatile (risky) time to own a stock.
Portfolio Rules and Objectives
Here are the common traits and objectives of our portfolios:
- There are 10 leading stocks from up to 10 leading industries in each portfolio (at the time of selection). Generally, there will only be one stock per industry group, but there could be exceptions.
- They are held for an entire 90-day period, with no stops in place. We strive for consistency, transparency, and simplicity in our portfolios. EB.com members may hold these stocks for the entire 90 days, trade them, use stops, etc., but for purposes of our calculation, we will make no exceptions to our "buy and hold for three months" strategy.
- Every stock will generally be held through ONE earnings report
- The expectation is that relative winners will carry the portfolio to outperformance
- They were all entered into as of the close on Friday, February 18th; members may choose to try to time better entries, but EB.com "purchased" as of February 18th's closing prices
- Primary objective is to outperform the benchmark S&P 500 over time; quarter-to-quarter performance can be extremely volatile, especially if significant rotation takes place intra-quarter
Here are several considerations for EB members:
- I would expect the Aggressive, Strong AD, and Earnings Reactions portfolios to be the riskiest, followed by the Model portfolio, and then the Income portfolio
- The Strong AD portfolio will be selected from a combination of rising accumulation/distribution lines and SCTRs above 70 at the time of selection. The Earnings Reactions portfolio is based on strong accumulation the day after its quarterly earnings are released and solid relative strength (vs. its peers). These are the only two portfolios that do NOT require revenue and EPS beats in their most recent quarterly earnings reports
- The Income portfolio stocks will all pay dividends, with the expected average dividend yield to be at least 1.0%
- Drawdowns (losses) should be much milder on the Income portfolio, with more volatility expected on the other four; please review inception-to-date charts below to gain an idea of the volatility associated with each
- I believe the larger drawdown on the Income portfolio at the beginning of the pandemic was an anomaly, occurring as many defensive, higher-yielding companies uncharacteristically underperformed during a market decline.
- Large drawdowns in the February through May 2021 and the November 2021 to February 2022 periods were due to the rapid rotation from growth stocks to value stocks; each quarter, our portfolios are based on themes and there is never a guarantee that our analysis and beliefs will be proven correct
- You should consider owning or trading these stocks in whatever manner is most comfortable for you; while we will buy all 10 stocks in the manner identified above, feel free to trade certain stocks or wait for pullbacks if the stocks are overbought
- We have no idea what risk each member is willing or able to take. We are not registered investment advisors so be sure you understand the risk you take. Please consult your financial advisor.
- EarningsBeats.com shareholders/employees may own all or some of the portfolio stocks from time to time.
Weekly Snapshot
Here's a weekly recap:
Weekly Summary
Benchmark S&P 500:
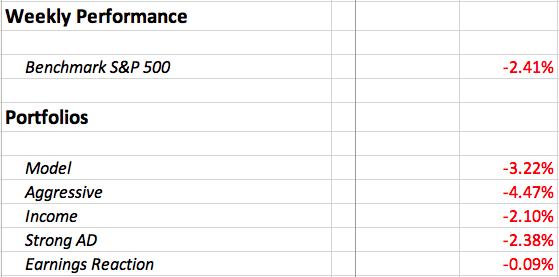
The S&P 500 experienced another big drop through the first half of last week, but eventually all the bearish sentiment caught up with the bears and we saw a big rally to close out the week. The benchmark was still down 2.41% for the week, but it felt like a victory - the opposite of last week. If you recall, the S&P 500 was down slightly the week prior, but it seemed much worse because the Fed day rally completely fizzled into the end of the week. This time, the bulls ended the week with the upper hand.
There are still plenty of issues, however. For starters, even last week's rebound wasn't enough to catapult the aggressive sectors to the top of the sector leaderboard. Check out last week's rotation:
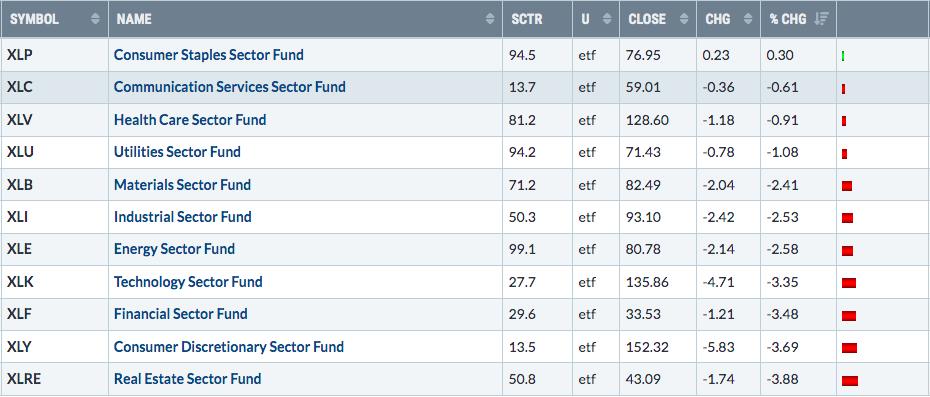
While real estate (XLRE) was the worst performer last week, it was closely followed by three aggressive sectors - consumer discretionary (XLY), financials (XLF), and technology (XLK). Honestly, we want to see leadership from aggressive groups. Look at the difference between the two consumer sectors. Staples (XLP) led last week and outperformed the XLY by 4 full percentage points. As the S&P 500 drops, check out the XLY:XLP relative strength ratio in the bottom panel (and other key ratios):
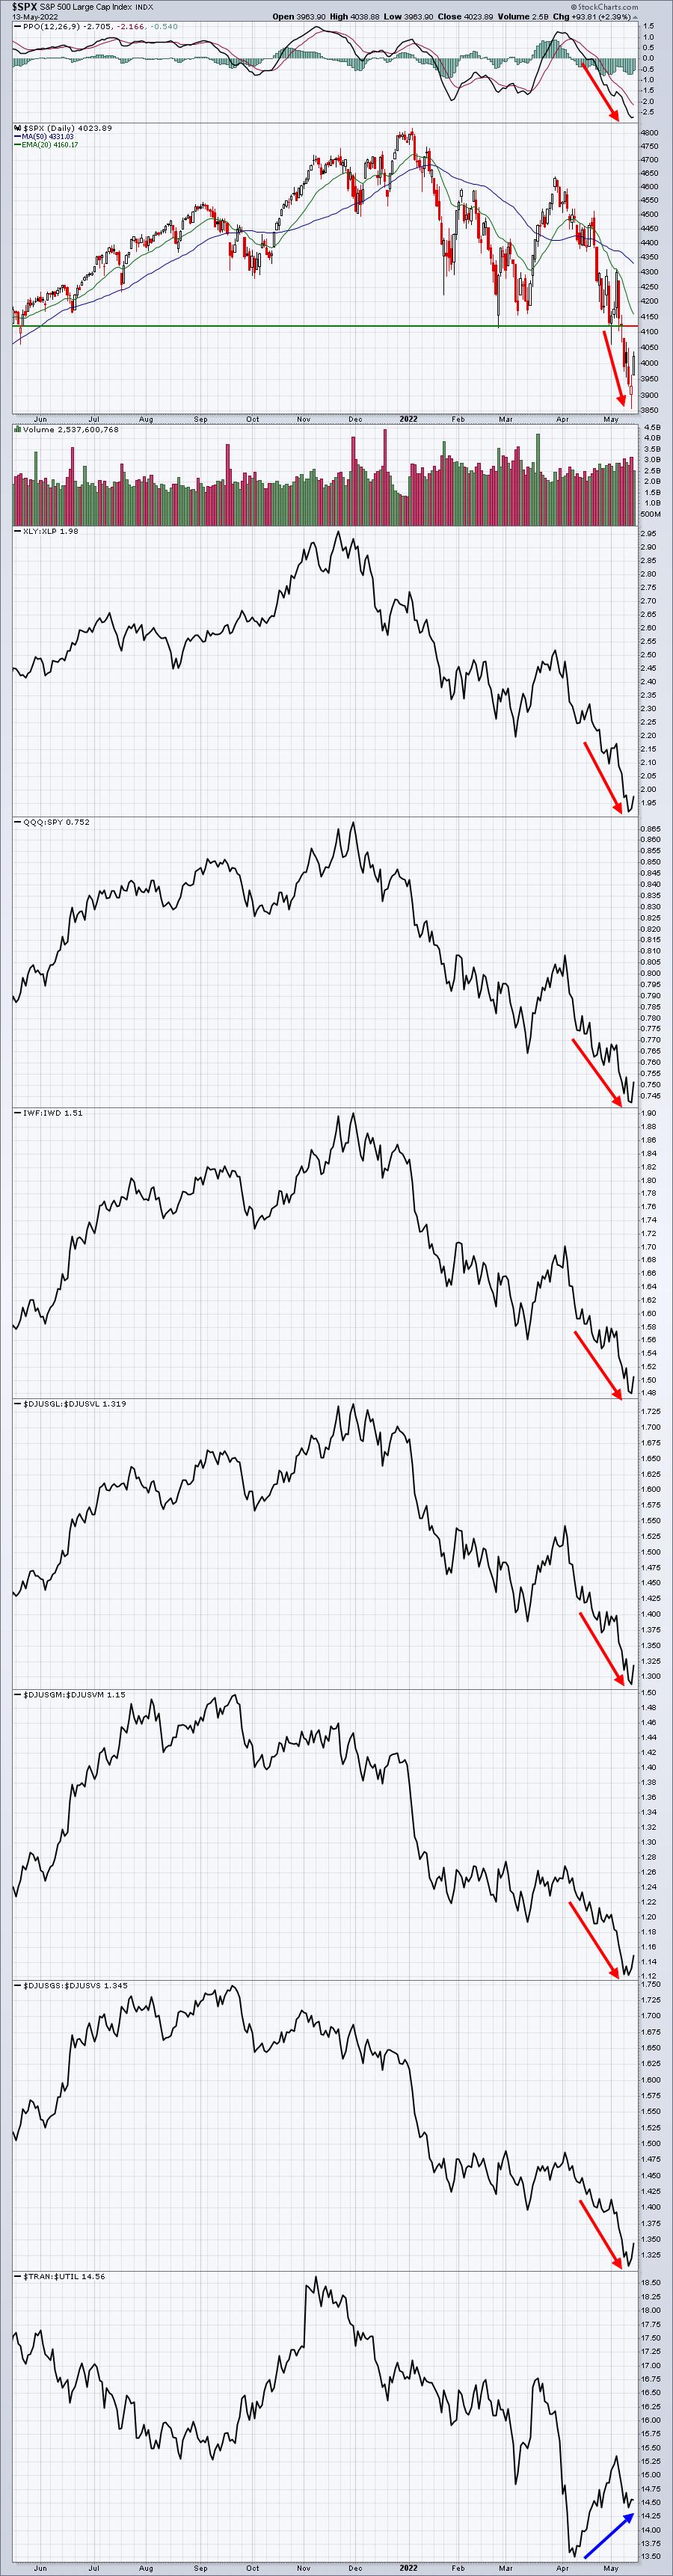
All but one of these "sustainability ratios" dropped significantly to new lows. This is not suggesting to me that Wall Street has yet to begin buying aggressive, "risk on" areas of the market with any consistency. That leaves me believing that we're not done just yet to the downside. However, short-term we reached extreme bearish sentiment readings that most certainly could lead to a big rebound. That may have begun on Thursday when we saw a half-hour equity only put call ratio ($CPCE) reading at 2.61 - one of the highest I've ever seen.
When we opened 2022, I talked about the necessity of "resetting" the bullish sentiment to much more bearish levels. That was the best way to launch higher later in 2022. The S&P 500 action to date in 2022 has been nearly picture perfect in that regard. Now EVERYONE is turning bearish, even those options traders that didn't know what an equity put looked like post-pandemic in 2020 and 2021. This is all VERY good news for the longer-term prospects for U.S. equities. When the vast majority of investors/traders are running for the hills this summer, THAT is exactly when we want to be buying - ahead of a massive rally later this year and into 2023. Just like 2015-2016, the 2018 trade war, and the 2020 pandemic, the inflation and interest rate surge of 2021/2022 will provide us yet another great entry opportunity into this secular bull market.
Let the naysayers be just that.
Model Portfolio:
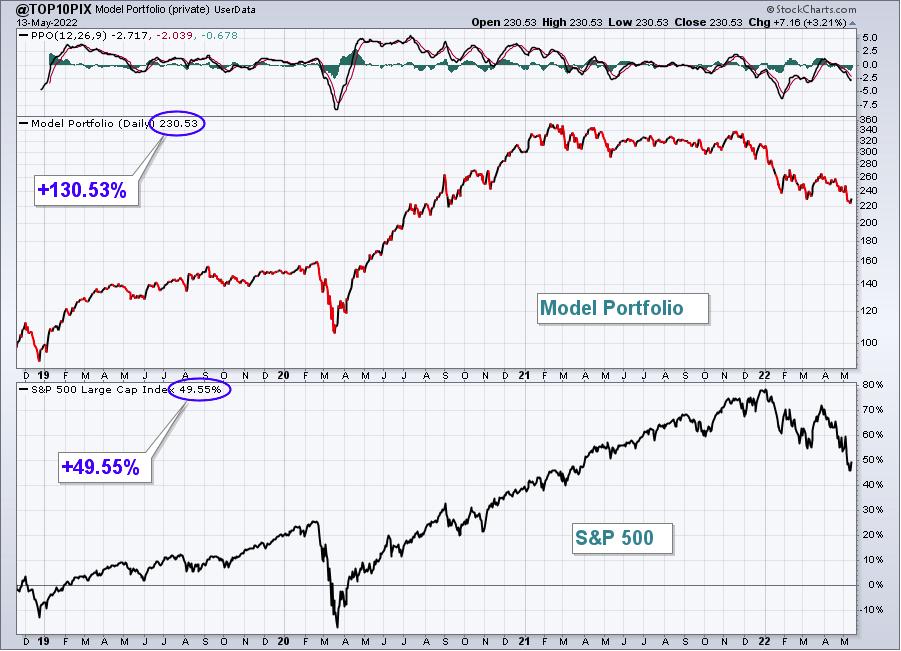
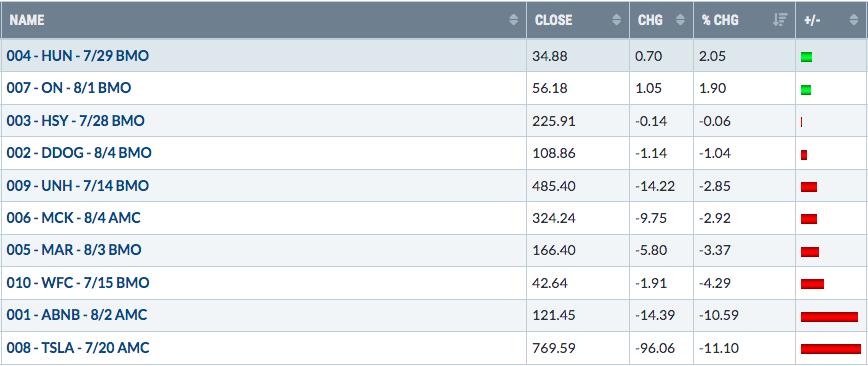
The Model Portfolio fell 3.22%, underperforming the S&P 500. Here's the updated inception-to-date chart of the portfolio:
Here are how the Model portfolio component stocks performed last week:
TSLA was the worst performer of the week, but it bounced beautifully off of key price support at 700:
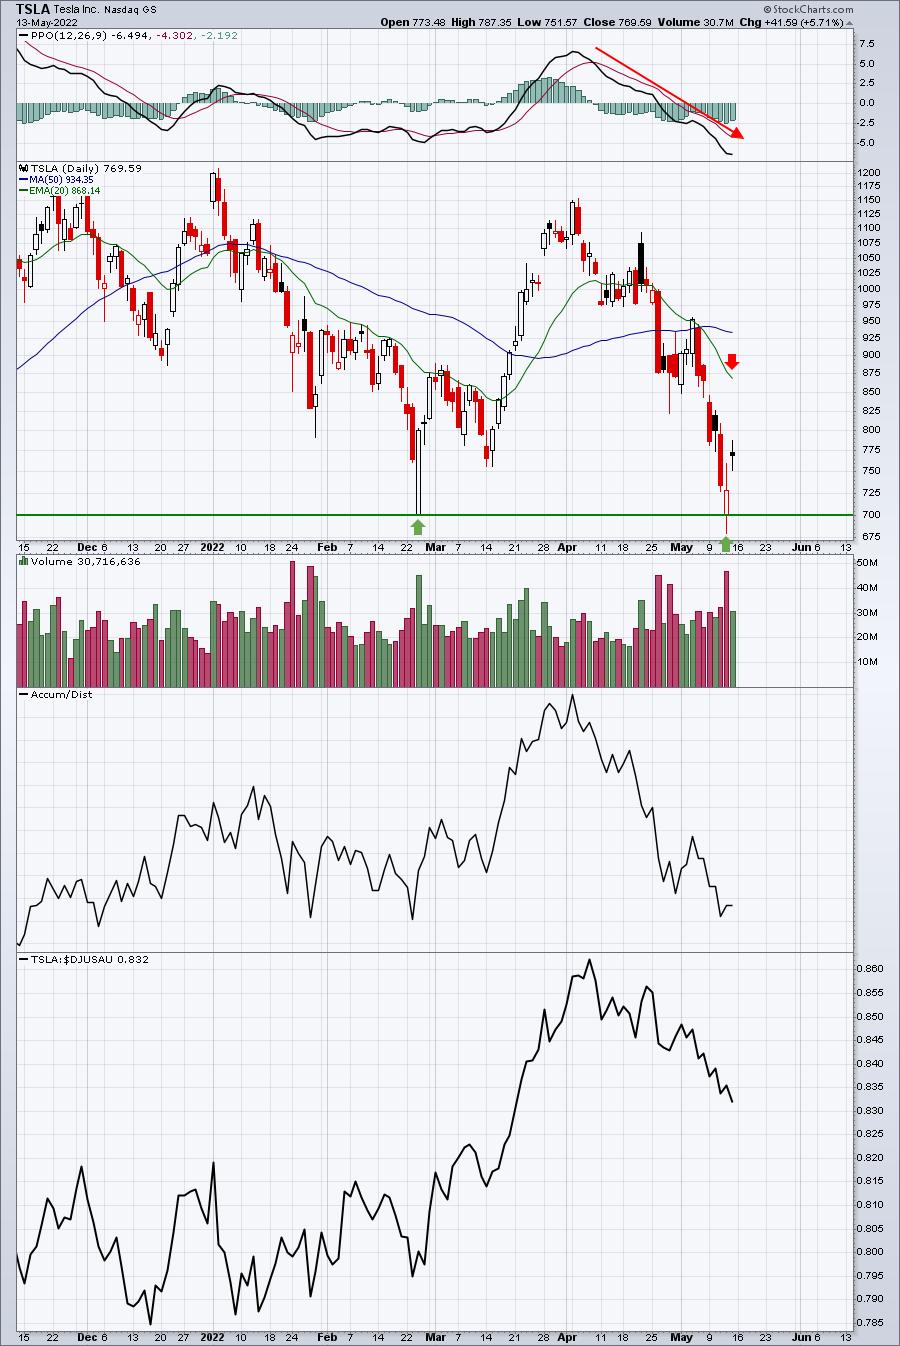
Options expire this Friday, so a continuing short-term rally wouldn't be surprising at all. A stock like TSLA could rally all the way back to its declining 20-day EMA.
Aggressive Portfolio:
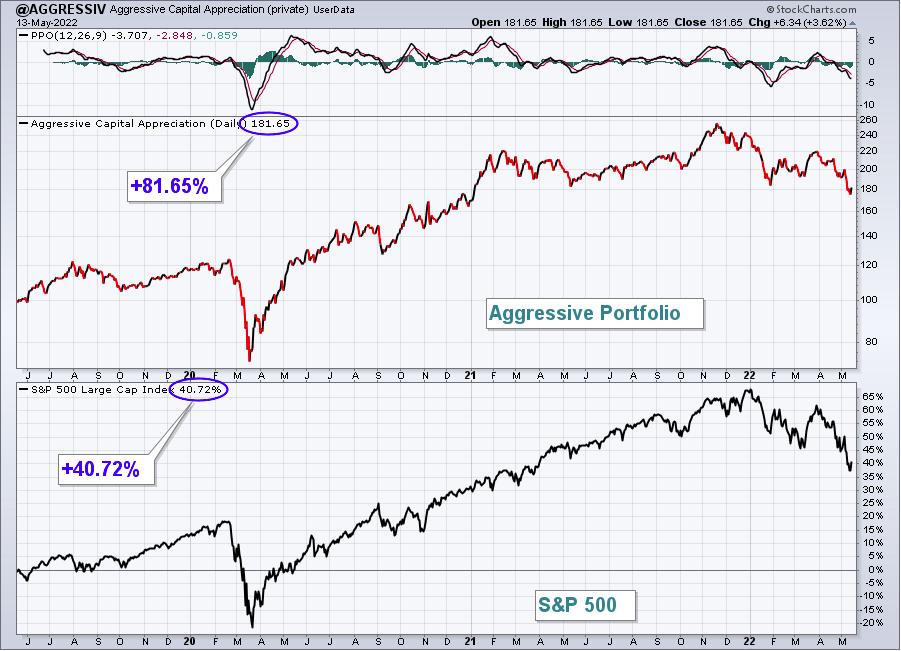
The Aggressive Portfolio dropped 4.47% last week, underperforming the S&P 500. Here's the updated inception-to-date chart of the portfolio:
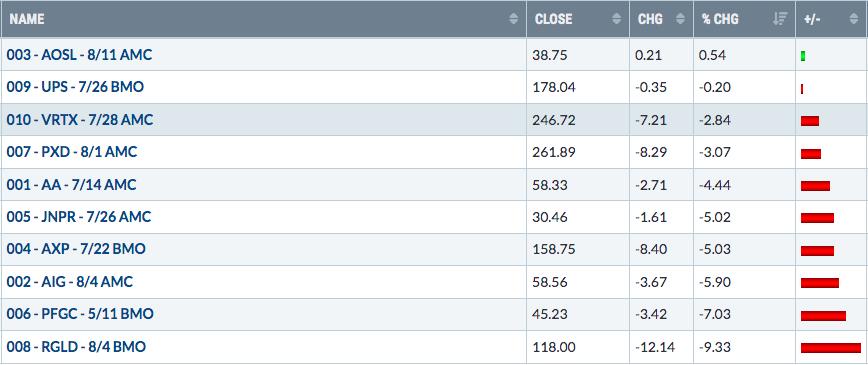
Here are how the Aggressive portfolio component stocks performed last week:
RGLD also had a very rough week, but it's moving closer and closer to a very key area of price support:
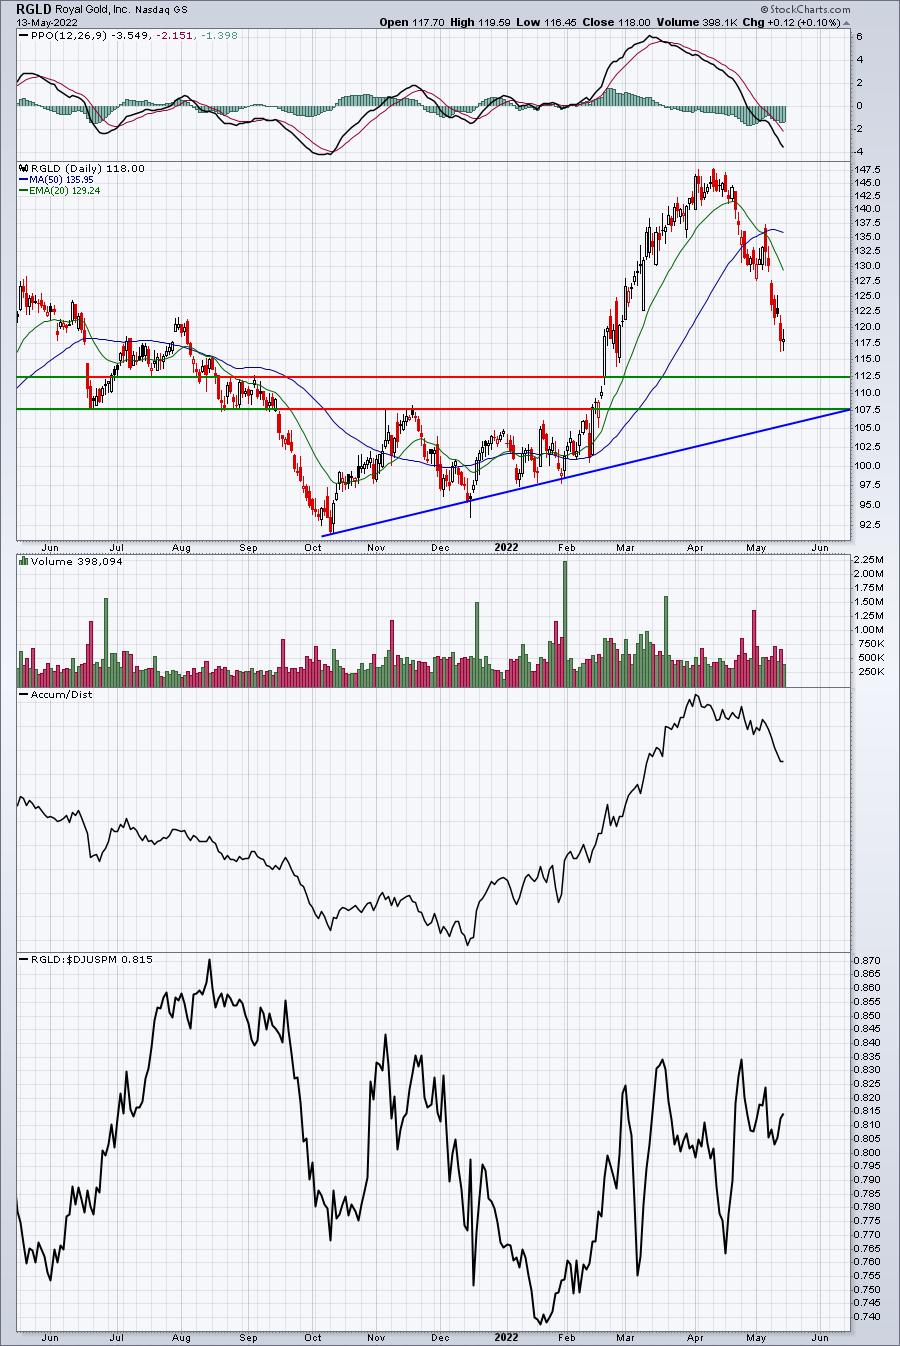
I'd be looking for a reversal in the 107.50-112.50 support range. Note that RGLD remains a relatively strong stock in its gold mining ($DJUSPM) space. So it's more of an industry thing than it is specific stock weakness.
Income Portfolio:
The Income Portfolio dropped 2.10% last week, slightly outperforming the S&P 500. Here's the updated inception-to-date chart of the portfolio:
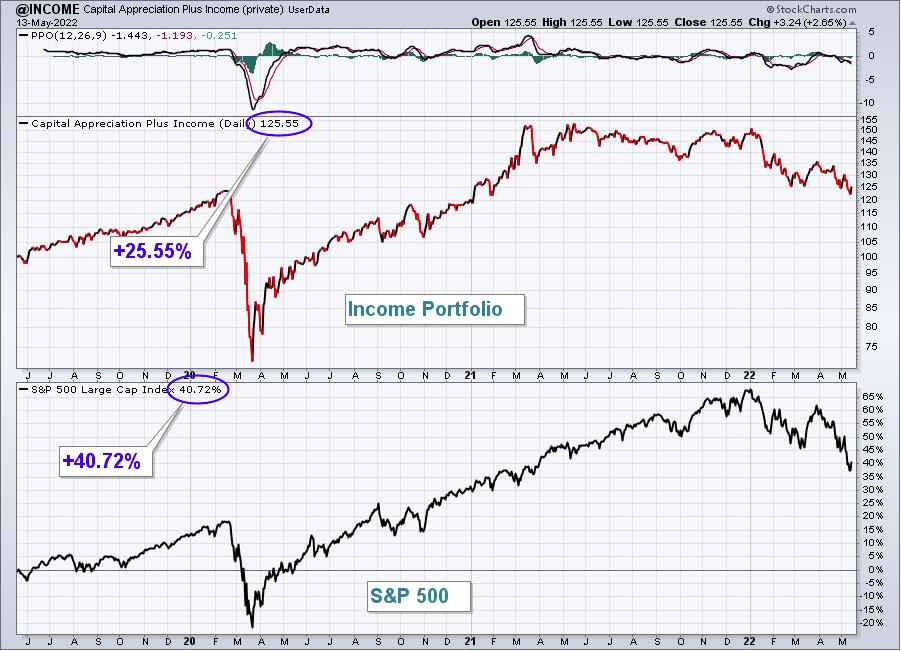
Here are how the Income portfolio component stocks performed last week:
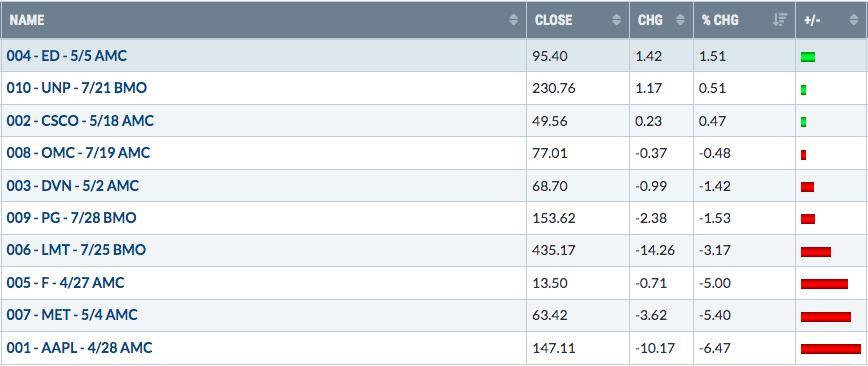
AAPL made a big breakdown last week and I see it rallying short-term to one of two places:
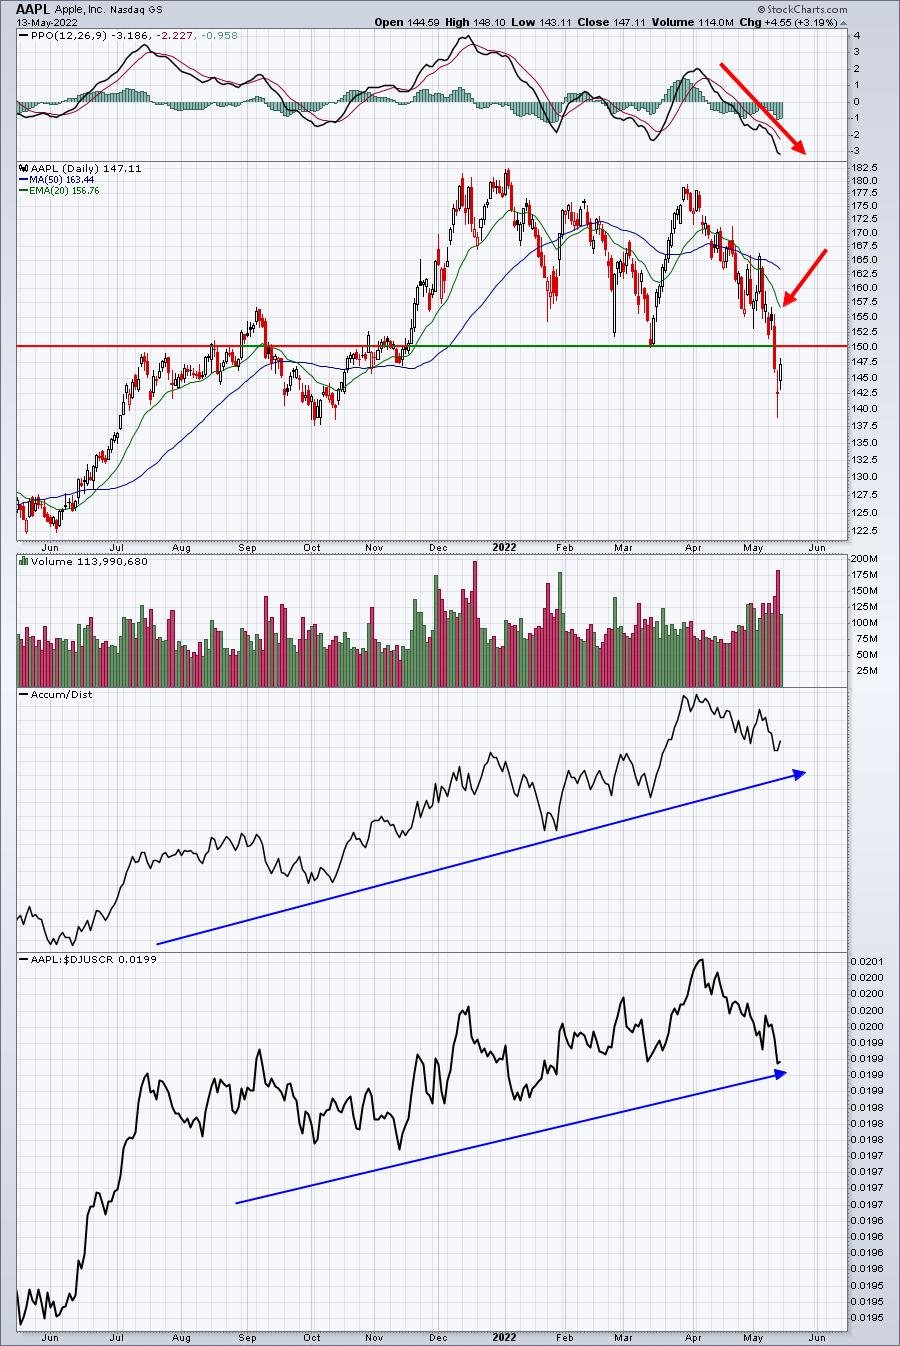
AAPL's first test will be the price breakdown at around 150. Broken price support initially becomes price resistance. If AAPL can somehow clear that level, then the declining 20-day EMA, currently at 156.76 is next up. I don't see AAPL clearing this one - not on its first attempt. If AAPL moves into the 150-155 range, it could be a signal that the short-term rally in the overall market is nearing its conclusion.
Strong AD Portfolio:
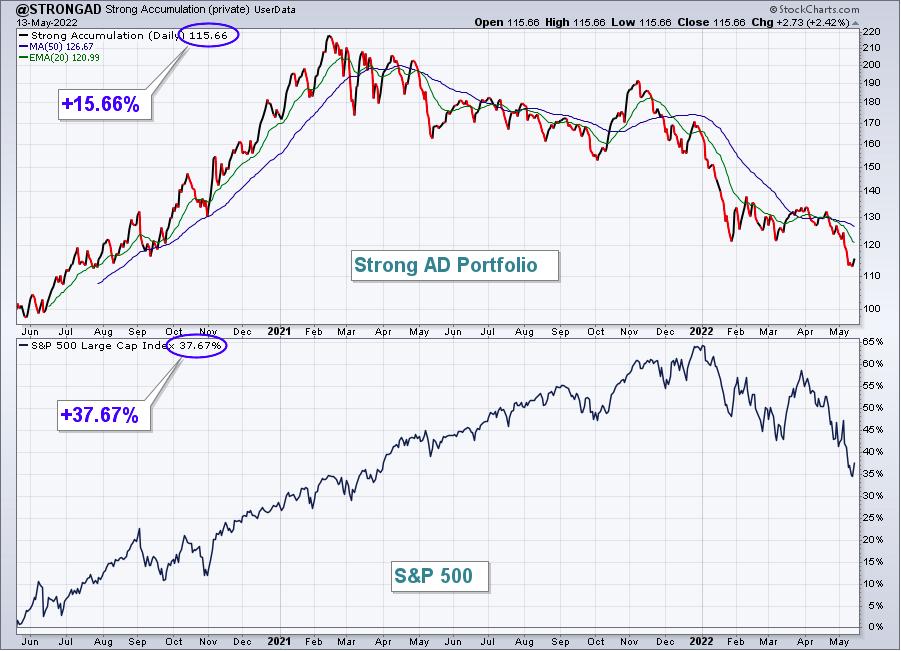
The Strong AD Portfolio fell 2.38% last week, nearly mirroring the S&P 500. Here's the updated inception-to-date chart of the portfolio:
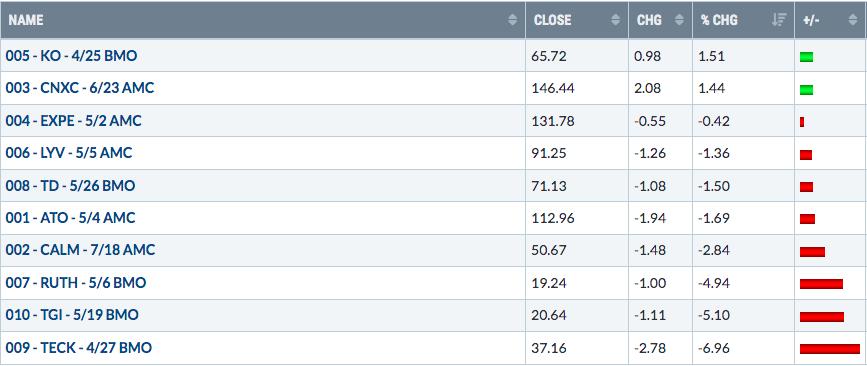
Here are how the Strong AD portfolio component stocks performed last week:
TECK, another big loser last week, successfully tested key price support. I expect it to hold, but if it doesn't, then a much-steeper decline to the 29-30 level would be possible:
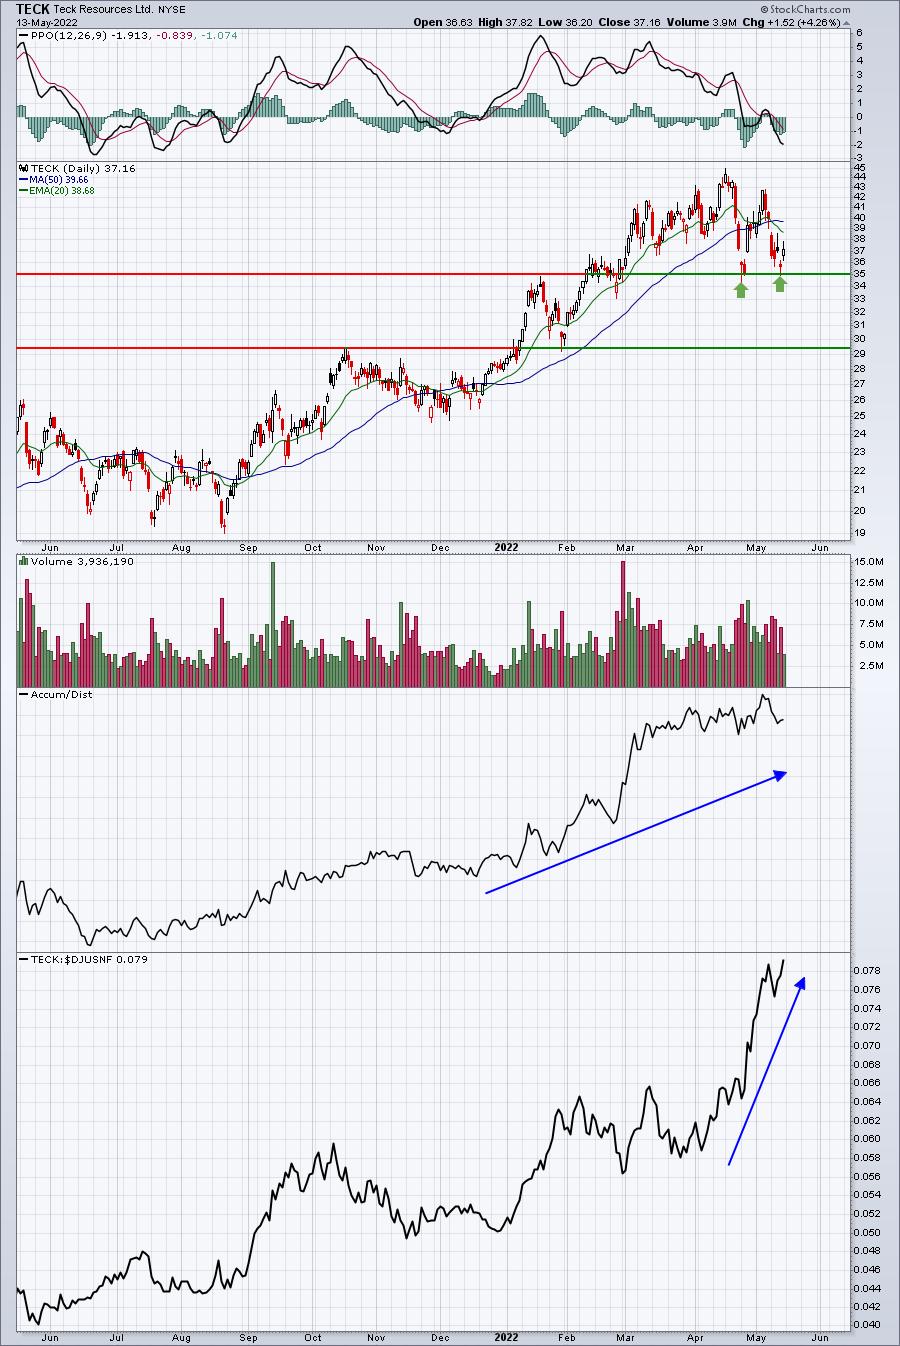
The test of 35 support was perfect and TECK has a very strong AD line and its relative strength is almost literally off the chart.
Earnings Reaction Portfolio:
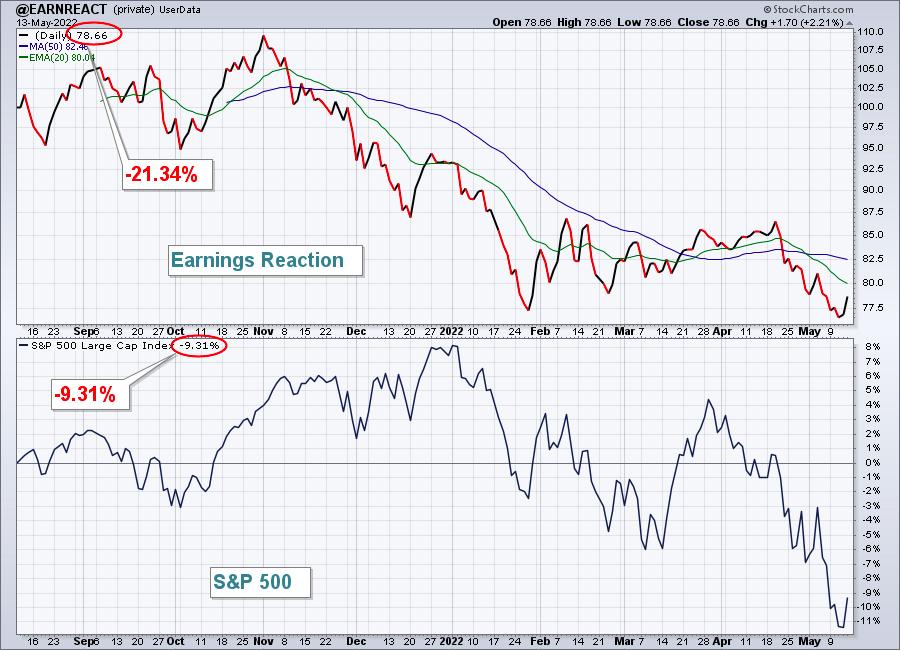
The Earnings Reaction Portfolio declined 0.09% last week, easily outperforming the S&P 500. Here's the updated inception-to-date chart of the portfolio:
Here are how the Earnings Reaction portfolio component stocks performed last week:
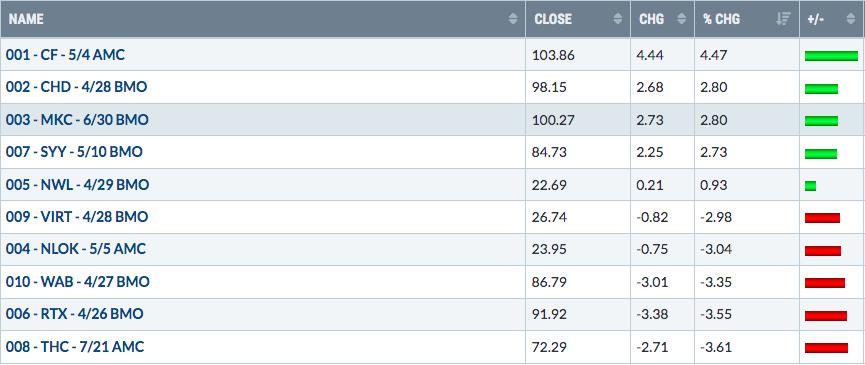
This portfolio's worst performer, THC, also seems to be attempting a bounce from a key price support level:
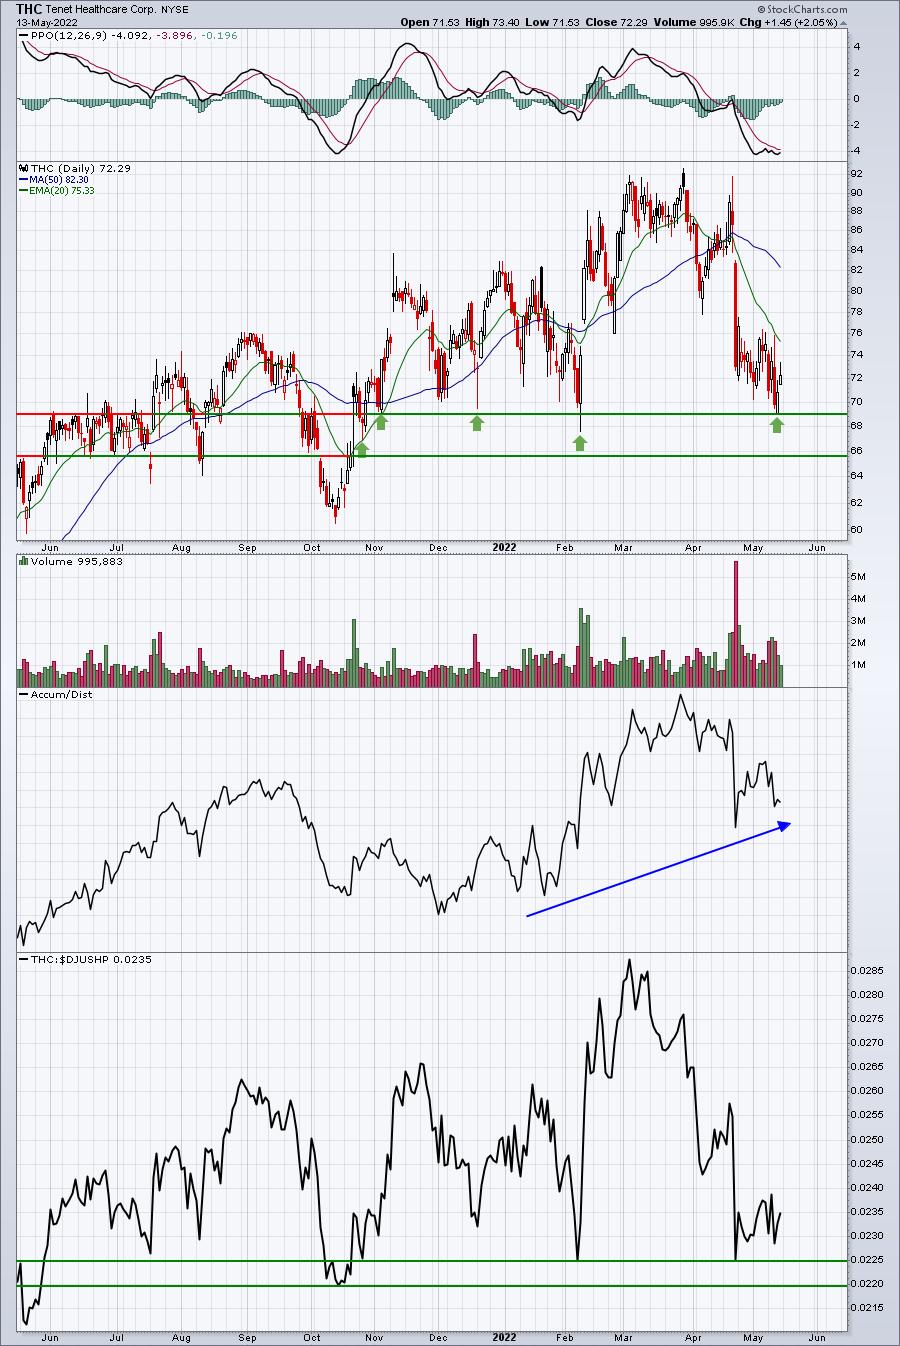
65-69 would certainly seem to be the key support range for THC. I believe it'll turn higher from here.
The Week Ahead
Options expire this Friday and there remain TONS of net in-the-money put premium on the table that we simply cannot ignore. Sentiment hit its most bearish level since the pandemic low and I believe that was the single-biggest factor in last week's rebound. The half-hour reading of the equity only put call ratio ($CPCE) hit 2.61 on Thursday at 1pm ET - one of the most bearish readings I've ever seen - and it was followed up with half-hour readings of 0.89, 1.48, 1.32, and 1.89 over the next 2 hours. When that last hour reading printed at 3pm ET, the S&P 500 exploded higher:
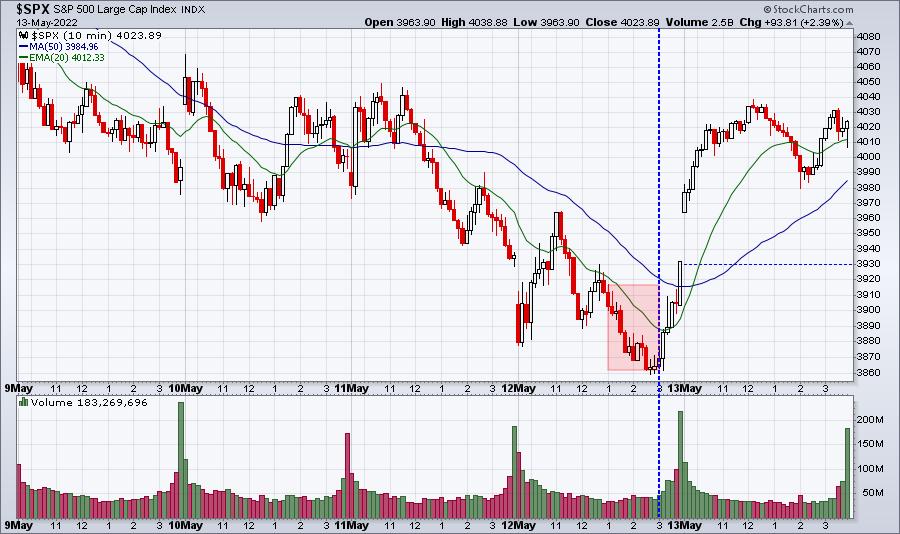
Here's the really interesting part. On Friday, with U.S. equities enjoying one of their best days in recent memory, there were 4 more half-hour CPCE readings above 1. When I talk about "resetting" sentiment, this is what I mean. The market, as a whole, is now beginning to believe the stock market will never go up again.
Awesome.
Model ETF Portfolio
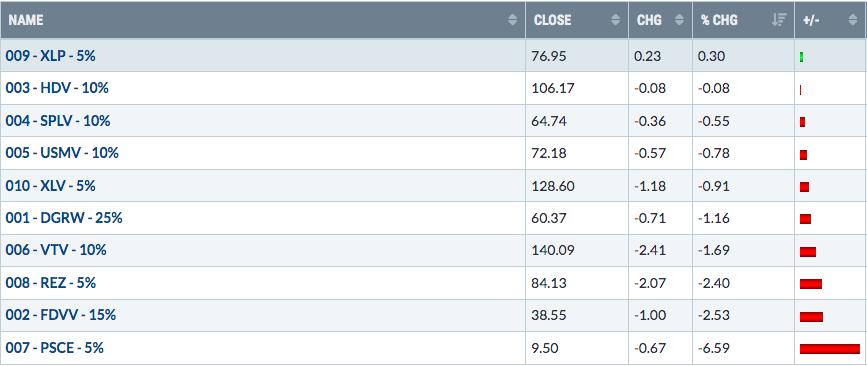
Our Model ETF Portfolio fell 1.45% last week, outperforming the benchmark S&P 500 by nearly a full percentage point.
Here's the updated inception-to-date chart of the Model ETF Portfolio:
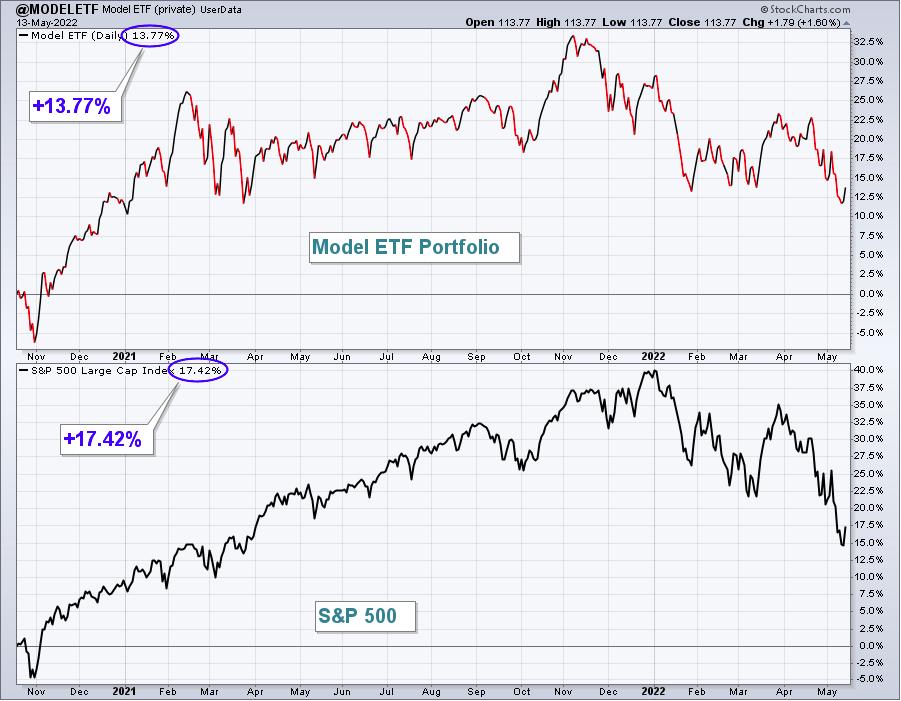
Here are how the Model ETF Portfolio component ETFs performed last week:
Happy trading!
Tom Bowley, Chief Market Strategist
EarningsBeats.com
"Better timing. Better trades."