
EB Weekly Portfolio Report - Sunday, May 22, 2022
Spring Special
Our best deal of the year began last week and runs for one more week! This is the best time to lock in your membership for an extended period of time and save A LOT of money. We want to thank all of you for your continued support during an incredibly difficult market environment and this is one way for us to say THANK YOU!
You'll find details of our Spring Special HERE!
Upcoming Earnings Reports
According to Zacks.com, the following companies will be reporting earnings this week and each is a component of one of our portfolios:
Monday, May 23: None
Tuesday, May 24: None
Wednesday, May 25: None
Thursday, May 26: None
Friday, May 27: None
PLEASE NOTE: The above companies were provided using earnings dates provided by StockCharts.com. My research is limited to what StockCharts.com provides and I also can make a mistake from time to time, so please double check for earnings dates for all companies that you own from a reputable source like Zacks.com. We do hold our portfolio stocks through one earnings report, but every EarningsBeats.com member must make his/her own investing/trading decisions about holding stocks into earnings reports as it's the most volatile (risky) time to own a stock.
Portfolio Rules and Objectives
Here are the common traits and objectives of our portfolios:
- There are 10 leading stocks from up to 10 leading industries in each portfolio (at the time of selection). Generally, there will only be one stock per industry group, but there could be exceptions.
- They are held for an entire 90-day period, with no stops in place. We strive for consistency, transparency, and simplicity in our portfolios. EB.com members may hold these stocks for the entire 90 days, trade them, use stops, etc., but for purposes of our calculation, we will make no exceptions to our "buy and hold for three months" strategy.
- Every stock will generally be held through ONE earnings report
- The expectation is that relative winners will carry the portfolio to outperformance
- They were all entered into as of the close on Friday, February 18th; members may choose to try to time better entries, but EB.com "purchased" as of February 18th's closing prices
- Primary objective is to outperform the benchmark S&P 500 over time; quarter-to-quarter performance can be extremely volatile, especially if significant rotation takes place intra-quarter
Here are several considerations for EB members:
- I would expect the Aggressive, Strong AD, and Earnings Reactions portfolios to be the riskiest, followed by the Model portfolio, and then the Income portfolio
- The Strong AD portfolio will be selected from a combination of rising accumulation/distribution lines and SCTRs above 70 at the time of selection. The Earnings Reactions portfolio is based on strong accumulation the day after its quarterly earnings are released and solid relative strength (vs. its peers). These are the only two portfolios that do NOT require revenue and EPS beats in their most recent quarterly earnings reports
- The Income portfolio stocks will all pay dividends, with the expected average dividend yield to be at least 1.0%
- Drawdowns (losses) should be much milder on the Income portfolio, with more volatility expected on the other four; please review inception-to-date charts below to gain an idea of the volatility associated with each
- I believe the larger drawdown on the Income portfolio at the beginning of the pandemic was an anomaly, occurring as many defensive, higher-yielding companies uncharacteristically underperformed during a market decline.
- Large drawdowns in the February through May 2021 and the November 2021 to February 2022 periods were due to the rapid rotation from growth stocks to value stocks; each quarter, our portfolios are based on themes and there is never a guarantee that our analysis and beliefs will be proven correct
- You should consider owning or trading these stocks in whatever manner is most comfortable for you; while we will buy all 10 stocks in the manner identified above, feel free to trade certain stocks or wait for pullbacks if the stocks are overbought
- We have no idea what risk each member is willing or able to take. We are not registered investment advisors so be sure you understand the risk you take. Please consult your financial advisor.
- EarningsBeats.com shareholders/employees may own all or some of the portfolio stocks from time to time.
Weekly Snapshot
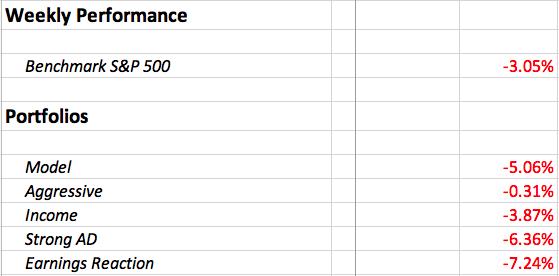
Here's a weekly recap:
Weekly Summary
Benchmark S&P 500:
The S&P 500 printed the type of daily candlestick on Friday (hammer) that would suggest a short-term bottom was found. Many times, options expiration can still have an impact into the early part of the following week and the absurd number of in-the-money puts would also suggest a possible rally to open next week. Look at the candle:
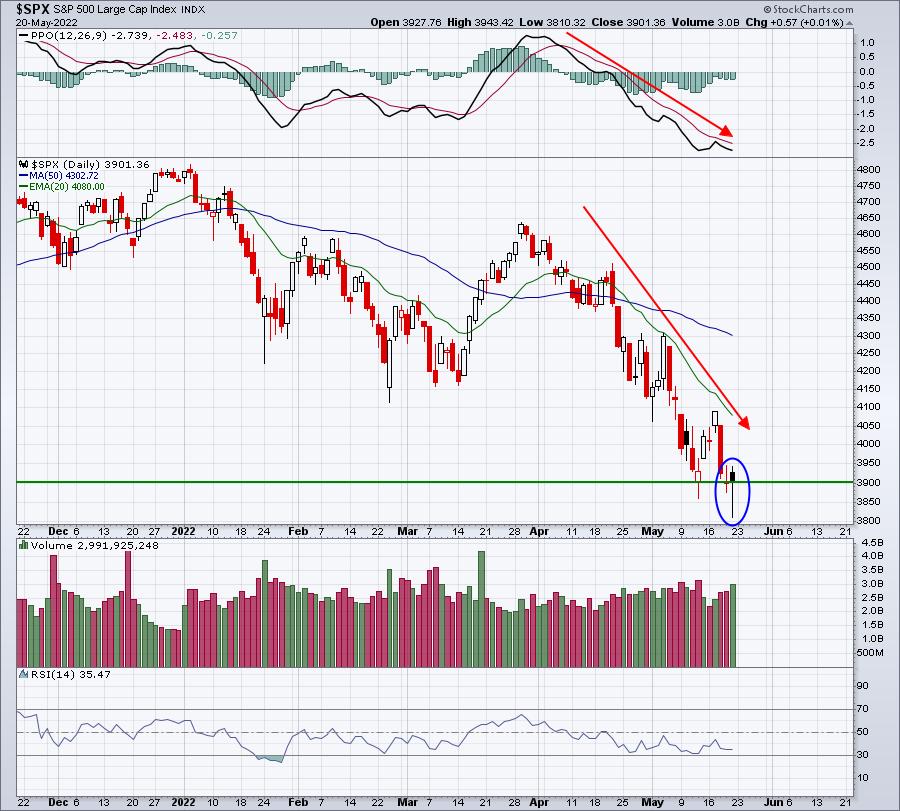
I'm not seeing any signs that THE bottom is in, so I'd treat any short-term rally as exactly that - short-term. Maybe we'll see a 20-day EMA test, however, which would represent a 3-4% jump. We'll see.
Meanwhile, let's take a glimpse at last week's sector leadership:
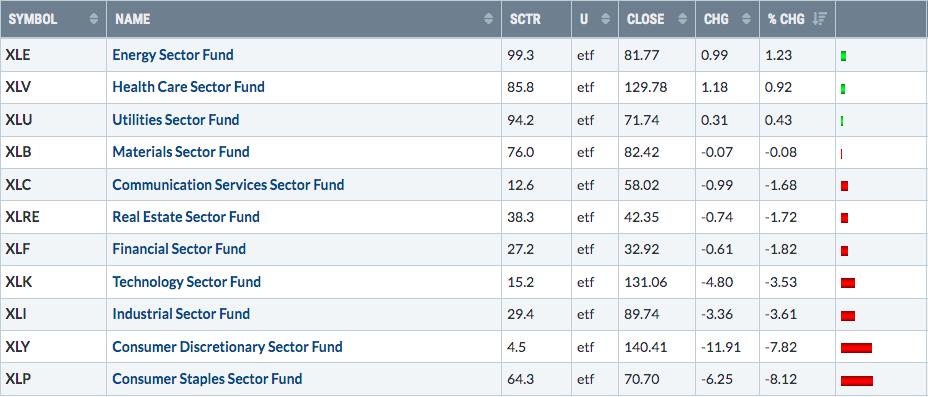
The end of week hammer was nice, but consumer stocks were CRUSHED. Consumer spending is estimated to represent two-thirds of our GDP. When I see Wall Street abandoning consumer stocks like this, I immediately think "recession". The good news, though, is that we'll VERY LIKELY mark a market bottom well before the worst of the fundamental news.
When I announced the latest portfolio stocks for each of our 5 portfolios, I made it clear that I am reserving the right to make changes within these portfolios at some point over the next 3 months if I feel the reward to risk calls for it. I could definitely see that happening over the summer months.
Model Portfolio:
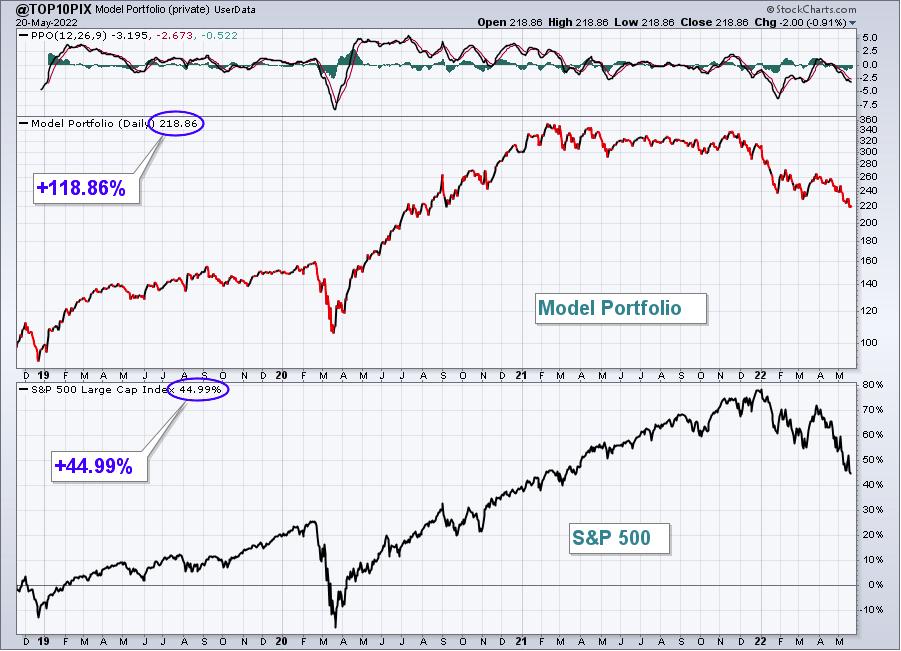
The Model Portfolio fell 5.06%, lagging the S&P 500. Here's the updated inception-to-date chart of the portfolio:
Here are how the Model portfolio component stocks performed on Friday:
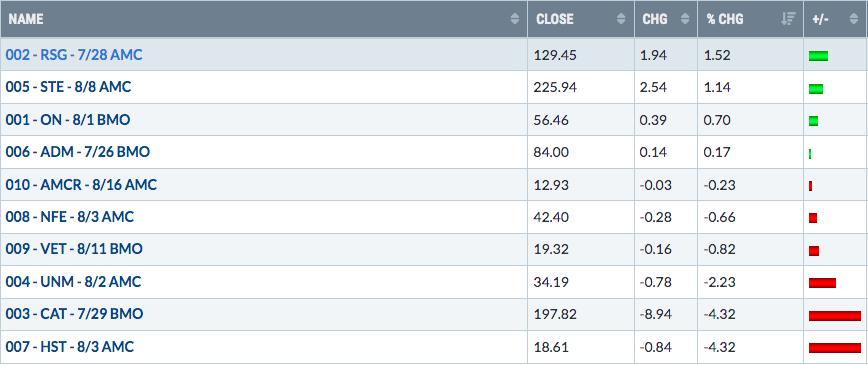
I'm only showing one day's performance since our portfolios were replaced at Thursday's close. I'll analyze an individual chart for each portfolio starting next week.
Aggressive Portfolio:
The Aggressive Portfolio dropped 0.31% last week, beating the S&P 500 soundly. Here's the updated inception-to-date chart of the portfolio:
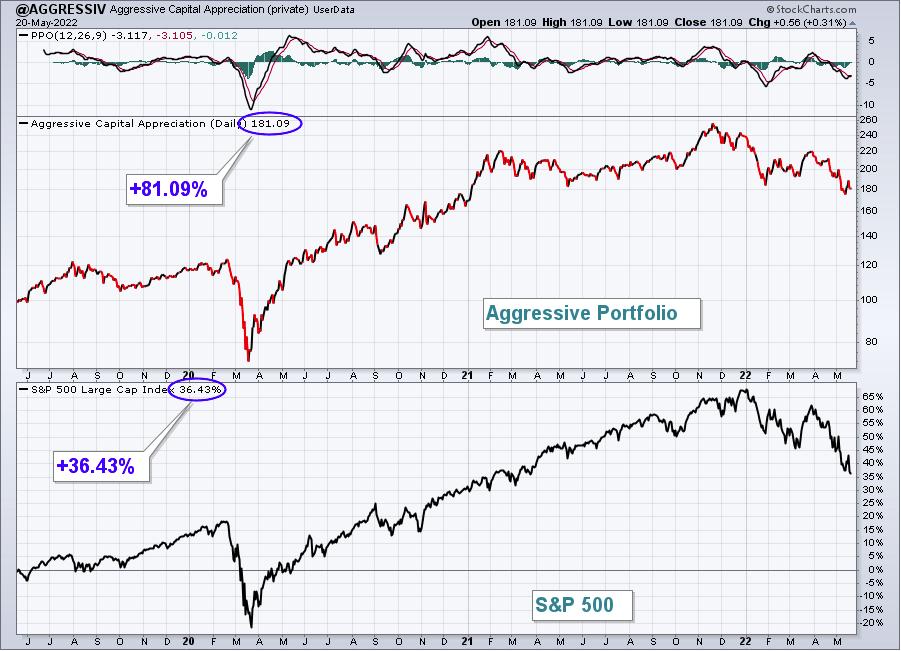
Here are how the Aggressive portfolio component stocks performed on Friday:
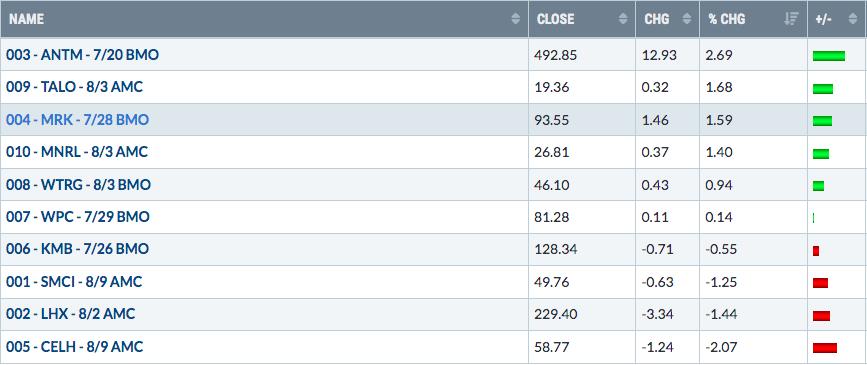
I'm only showing one day's performance since our portfolios were replaced at Thursday's close. I'll analyze an individual chart for each portfolio starting next week.
Income Portfolio:
The Income Portfolio dropped 3.87% last week, slightly underperforming the S&P 500.
Here's the updated inception-to-date chart of the portfolio:
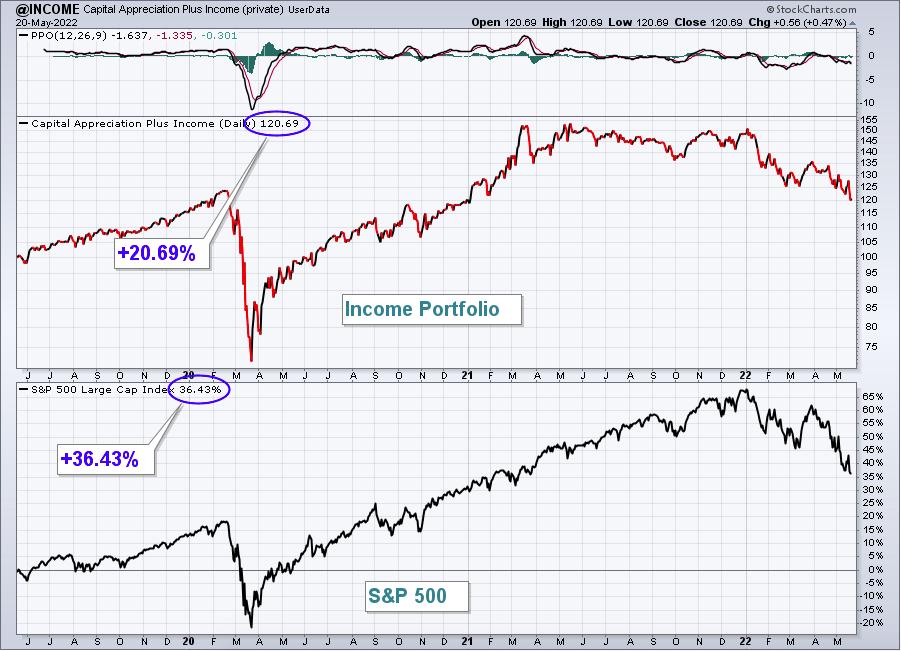
Here are how the Income portfolio component stocks performed on Friday:
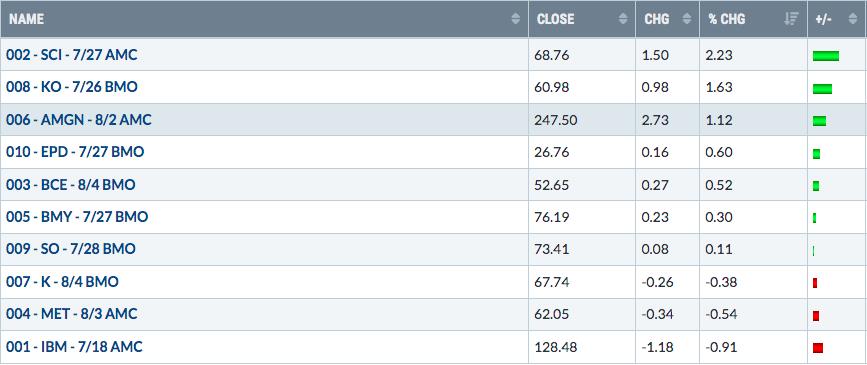
I'm only showing one day's performance since our portfolios were replaced at Thursday's close. I'll analyze an individual chart for each portfolio starting next week.
Strong AD Portfolio:
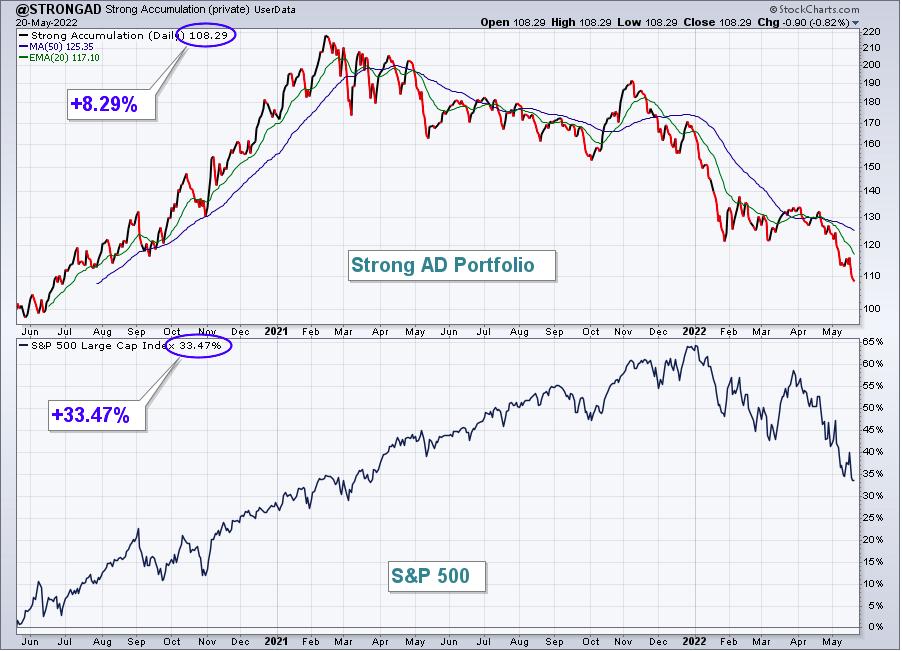
The Strong AD Portfolio fell 6.36% last week, badly lagging the S&P 500. Here's the updated inception-to-date chart of the portfolio:
Here are how the Strong AD portfolio component stocks performed on Friday:
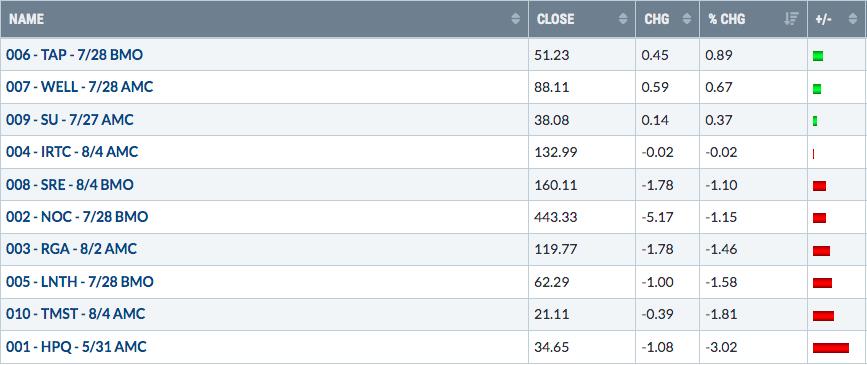
I'm only showing one day's performance since our portfolios were replaced at Thursday's close. I'll analyze an individual chart for each portfolio starting next week.
Earnings Reaction Portfolio:
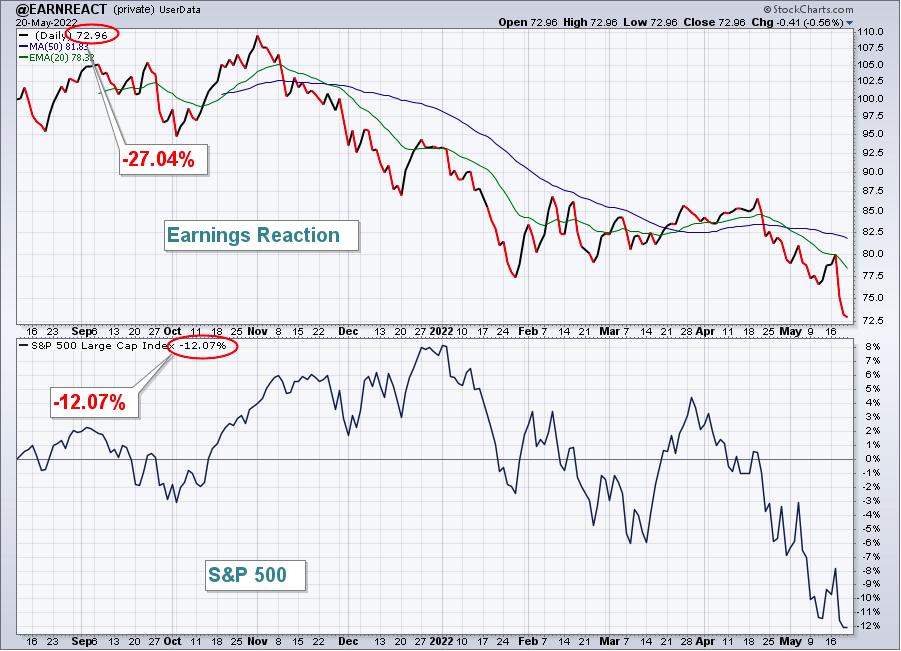
The Earnings Reaction Portfolio declined 7.24% last week, badly lagging the S&P 500. Here's the updated inception-to-date chart of the portfolio:
Here are how the Earnings Reaction portfolio component stocks performed on Friday:
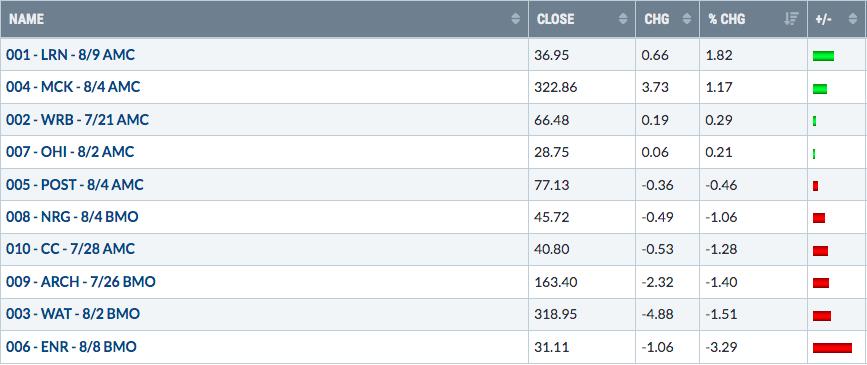
I'm only showing one day's performance since our portfolios were replaced at Thursday's close. I'll analyze an individual chart for each portfolio starting next week.
The Week Ahead
Bottoms form when no one believes they can. That's why I always look at sentiment indicators to help mark bottoms. Every significant market bottom this century has been marked by extreme Volatility Index ($VIX) and equity only put call ratio ($CPCE) readings. They are both on the rise, which is good. That's what we want to see. I continue to monitor the 253-day (1 year) moving average of the equity only put call ratio. If you recall, I suggested earlier this year that we need to see that moving average rise significantly - and it's in the process of doing it. I would expect to see this moving average reach at least .55, and probably .58, before a major bottom is formed. Here's what this chart currently looks like:
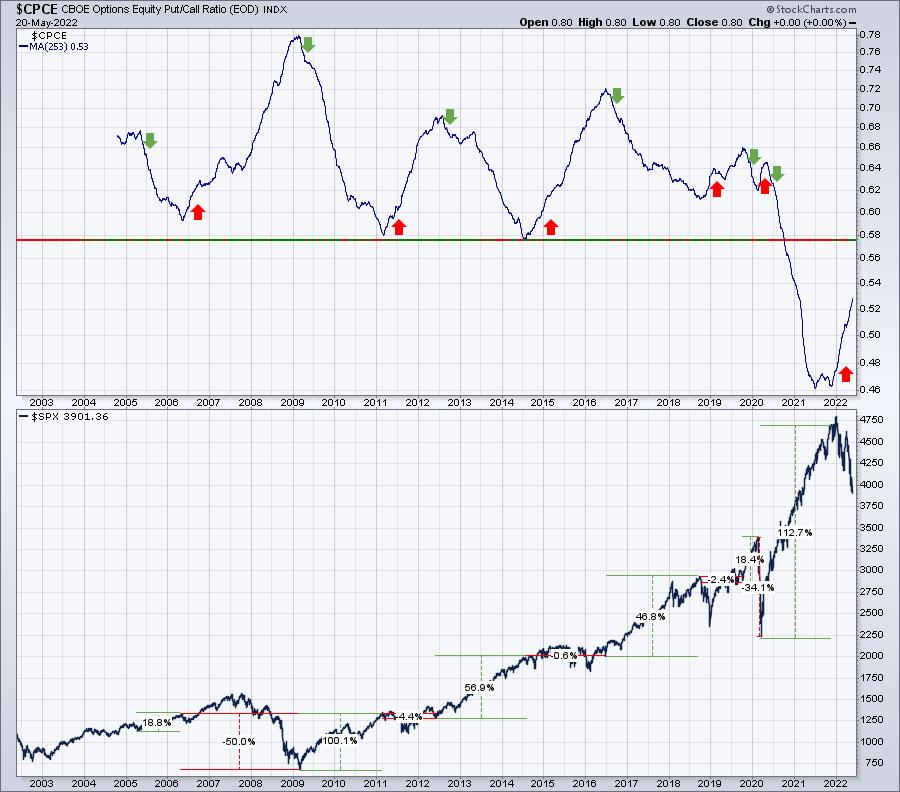
This was the chart I shared at MarketVision 2022 on Saturday, January 8th. It was important to "reset" sentiment, because we had risen more over the prior 1 year, 10 months, than in ANY prior 1 year, 10 month period since 1950 on the S&P 500. Sentiment was OFF THE CHARTS bullish and all the Reddit folks thought the stock market was an ATM machine. Reality is setting in during 2022. Cyclical bear markets are brutal - just like secular bear markets. The big difference is they don't last as long. I believe we're in a cyclical bear market and that we'll bottom sometime between now and September.
If I'm right, there'll be tremendous opportunities ahead.
Model ETF Portfolio
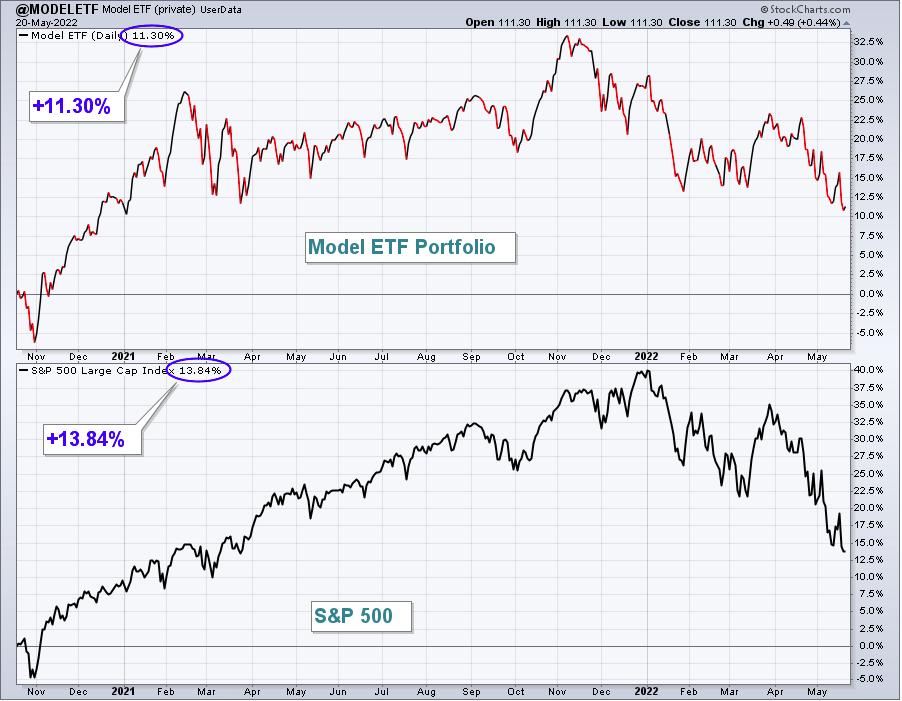
Our Model ETF Portfolio fell 2.17% last week, but easily outperformed the benchmark S&P 500, which fell more than 3%.
Here's the updated inception-to-date chart of the Model ETF Portfolio:
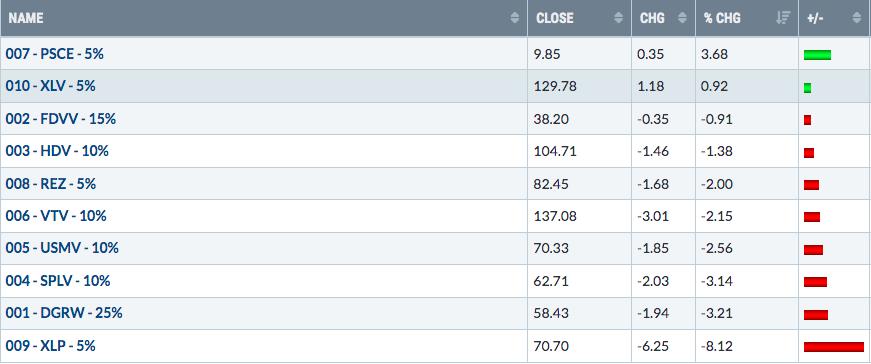
Here are how the Model ETF Portfolio component ETFs performed last week:
Happy trading!
Tom Bowley, Chief Market Strategist
EarningsBeats.com
"Better timing. Better trades."