
EB Weekly Portfolio Report - Monday, May 30, 2022
Spring Special - LAST DAY!
Our best deal of the year is almost over! This is the best time to lock in your membership for an extended period of time and save A LOT of money. We want to thank all of you for your continued support during an incredibly difficult market environment and this is one way for us to say THANK YOU!
You'll find details of our Spring Special HERE! It ends TODAY, so please hurry and extend!
Upcoming Earnings Reports
According to Zacks.com, the following companies will be reporting earnings this week and each is a component of one of our portfolios:
Monday, May 30: Memorial Day - Stock Market Closed
Tuesday, May 31: None
Wednesday, June 1: None
Thursday, June 2: None
Friday, June 3: None
PLEASE NOTE: The above companies were provided using earnings dates provided by StockCharts.com. My research is limited to what StockCharts.com provides and I also can make a mistake from time to time, so please double check for earnings dates for all companies that you own from a reputable source like Zacks.com. We do hold our portfolio stocks through one earnings report, but every EarningsBeats.com member must make his/her own investing/trading decisions about holding stocks into earnings reports as it's the most volatile (risky) time to own a stock.
Portfolio Rules and Objectives
Here are the common traits and objectives of our portfolios:
- There are 10 leading stocks from up to 10 leading industries in each portfolio (at the time of selection). Generally, there will only be one stock per industry group, but there could be exceptions.
- They are held for an entire 90-day period, with no stops in place. We strive for consistency, transparency, and simplicity in our portfolios. EB.com members may hold these stocks for the entire 90 days, trade them, use stops, etc., but for purposes of our calculation, we will make no exceptions to our "buy and hold for three months" strategy.
- Every stock will generally be held through ONE earnings report
- The expectation is that relative winners will carry the portfolio to outperformance
- They were all entered into as of the close on Friday, February 18th; members may choose to try to time better entries, but EB.com "purchased" as of February 18th's closing prices
- Primary objective is to outperform the benchmark S&P 500 over time; quarter-to-quarter performance can be extremely volatile, especially if significant rotation takes place intra-quarter
Here are several considerations for EB members:
- I would expect the Aggressive, Strong AD, and Earnings Reactions portfolios to be the riskiest, followed by the Model portfolio, and then the Income portfolio
- The Strong AD portfolio will be selected from a combination of rising accumulation/distribution lines and SCTRs above 70 at the time of selection. The Earnings Reactions portfolio is based on strong accumulation the day after its quarterly earnings are released and solid relative strength (vs. its peers). These are the only two portfolios that do NOT require revenue and EPS beats in their most recent quarterly earnings reports
- The Income portfolio stocks will all pay dividends, with the expected average dividend yield to be at least 1.0%
- Drawdowns (losses) should be much milder on the Income portfolio, with more volatility expected on the other four; please review inception-to-date charts below to gain an idea of the volatility associated with each
- I believe the larger drawdown on the Income portfolio at the beginning of the pandemic was an anomaly, occurring as many defensive, higher-yielding companies uncharacteristically underperformed during a market decline.
- Large drawdowns in the February through May 2021 and the November 2021 to February 2022 periods were due to the rapid rotation from growth stocks to value stocks; each quarter, our portfolios are based on themes and there is never a guarantee that our analysis and beliefs will be proven correct
- You should consider owning or trading these stocks in whatever manner is most comfortable for you; while we will buy all 10 stocks in the manner identified above, feel free to trade certain stocks or wait for pullbacks if the stocks are overbought
- We have no idea what risk each member is willing or able to take. We are not registered investment advisors so be sure you understand the risk you take. Please consult your financial advisor.
- EarningsBeats.com shareholders/employees may own all or some of the portfolio stocks from time to time.
Weekly Snapshot
Here's a weekly recap:
Weekly Summary
Benchmark S&P 500:
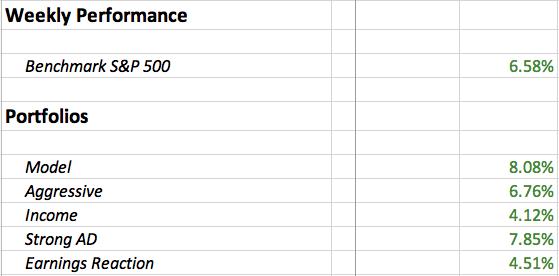
Outside of a brief scare on Tuesday morning, the S&P 500 performed exceptionally well last week, rising 6.58% and topping the 6.16% rise during options expiration week in March 2022. That's the good news, along with the composition of the rally, which favored the aggressive consumer discretionary stocks (XLY). Check out the week's rotation:
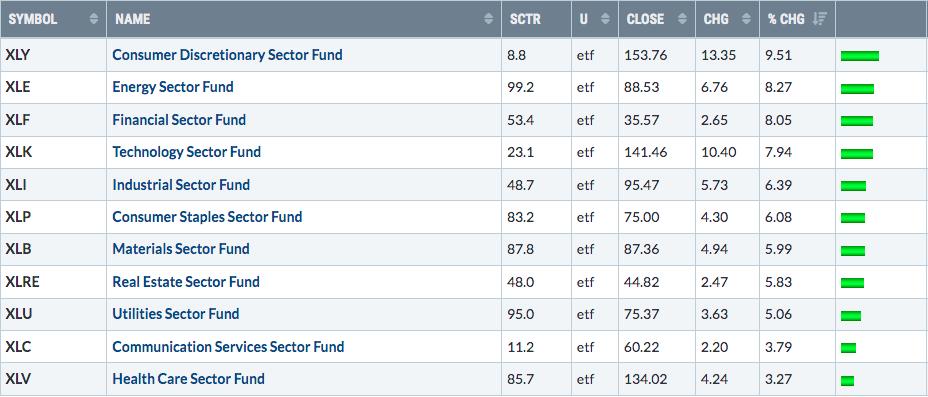
Seeing 4 of the 5 aggressive sectors within the top 5 spots was a nice change for sure. But before we get overly excited, let's first recognize how BAD the discretionary group was heading into last week. This is what the XLY chart looks like (pay particular attention to the relative weakness in the lower panel):
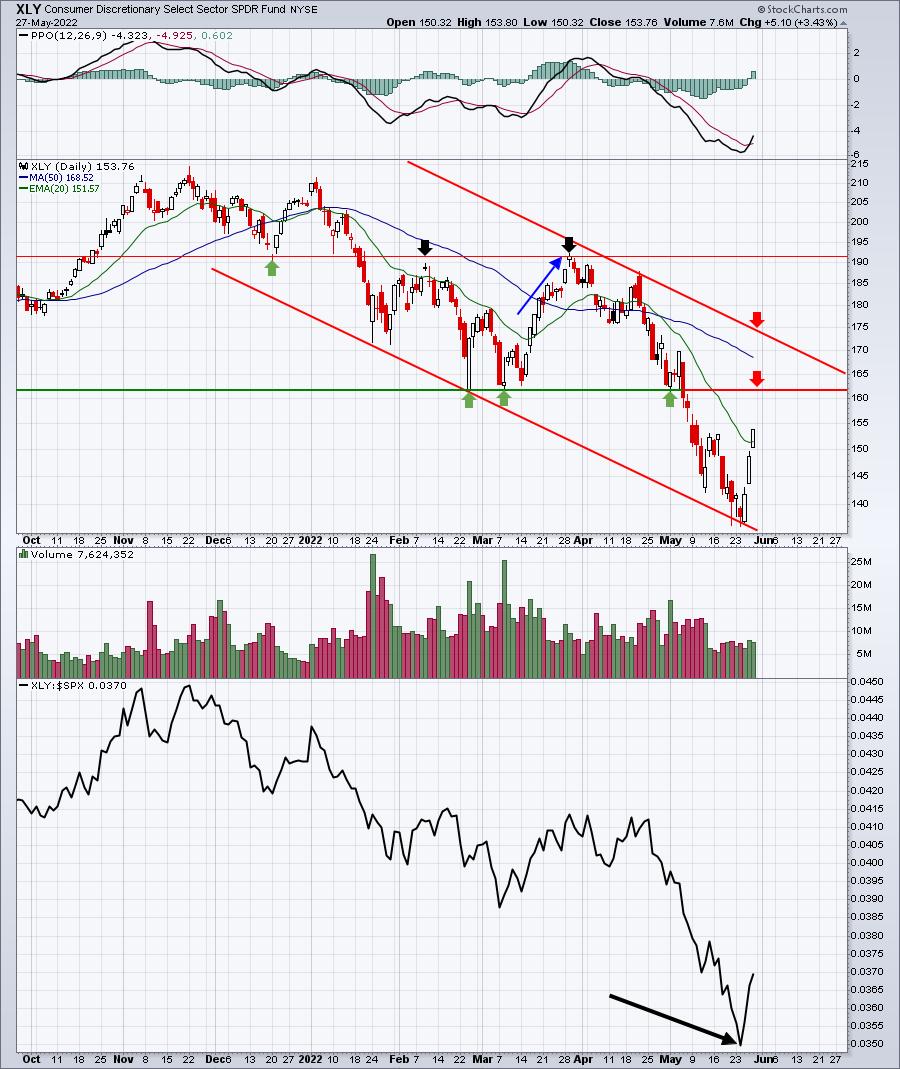
The Fed has promised to raise rates aggressively to fight inflation, which, in turn, will take a toll on our economy. (Note to self: It already has.) That's the reason why consumer stocks have been getting hammered. When Wall Street turns its attention completely AWAY from inflation, that's when we'll see the bottom in place and a rally. Why? Because that's when the Fed will turns ITS attention to the economy and away from inflation as well. That means LOWER RATES. That's right, you're hearing it here first. I believe it's possible that the Fed LOWERS its fed funds rate before the end of the year - or at the very least begins talking about that possibility. Right now, they cannot support the stock market with dovish talk, because of the current inflationary pressures.
Model Portfolio:
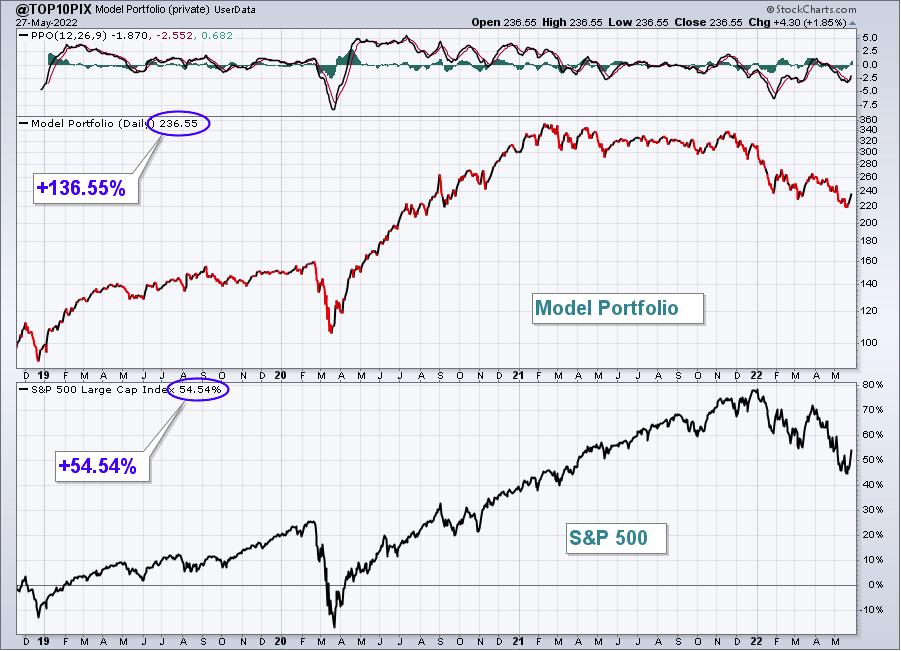
The Model Portfolio surged 8.08%, easily outperforming the S&P 500. Here's the updated inception-to-date chart of the portfolio:
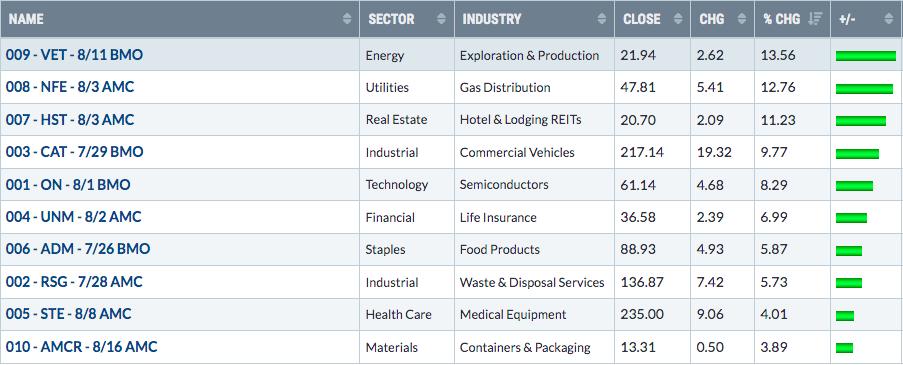
Here are how the Model portfolio component stocks performed last week:
RSG had a nice week last week, but it's just now approaching key price resistance:
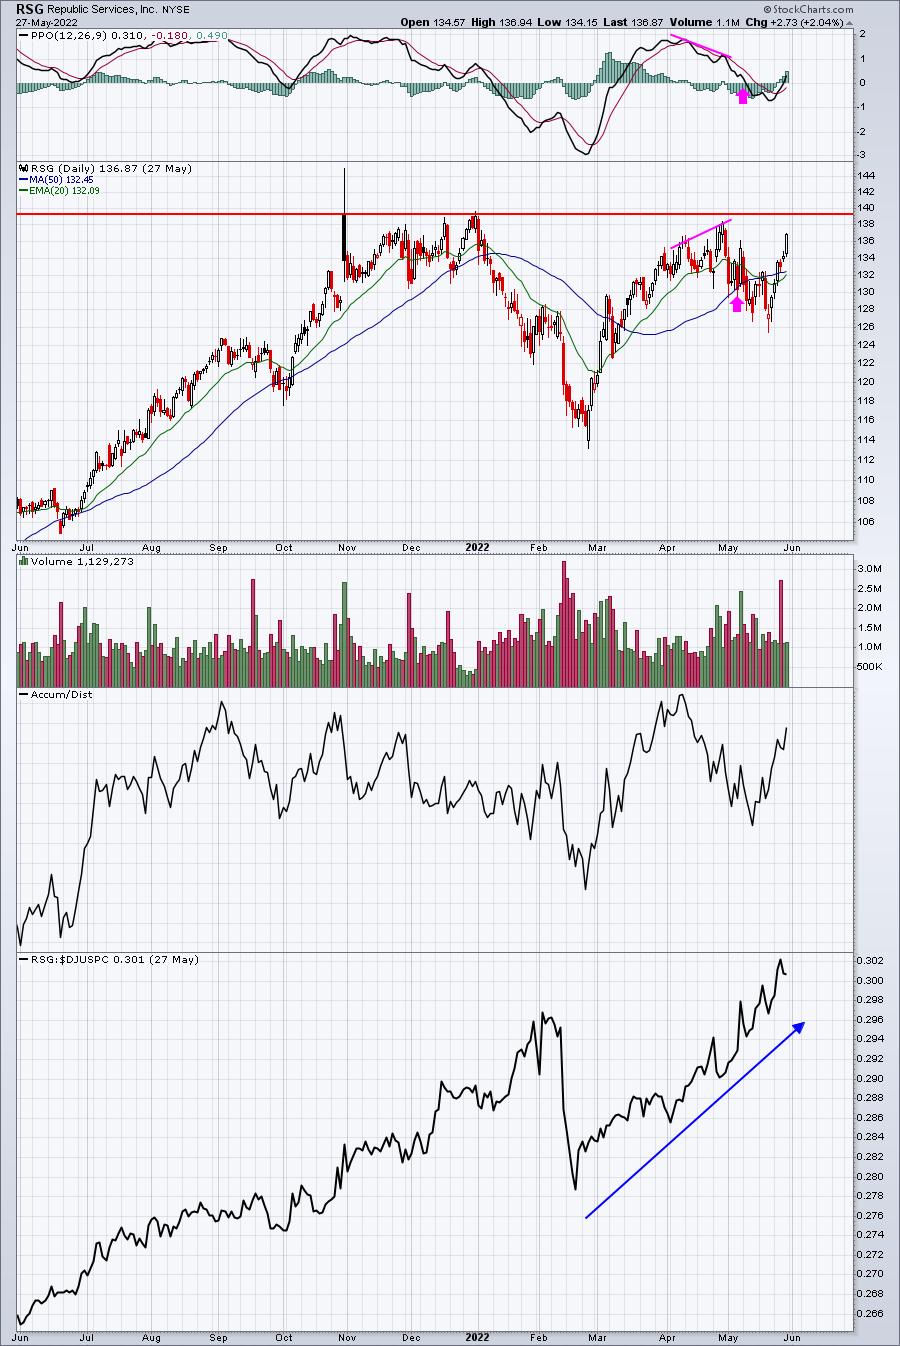
RSG had an issue with slowing price momentum, as evidenced by the negative divergence (pink lines) above. After resetting its PPO at the centerline and testing its 50-day SMA, however, I believe RSG could be preparing for a significant breakout. That would be a bullish development, so watch for a close above 139.50-140.00 - especially if accompanied by increasing volume.
Aggressive Portfolio:
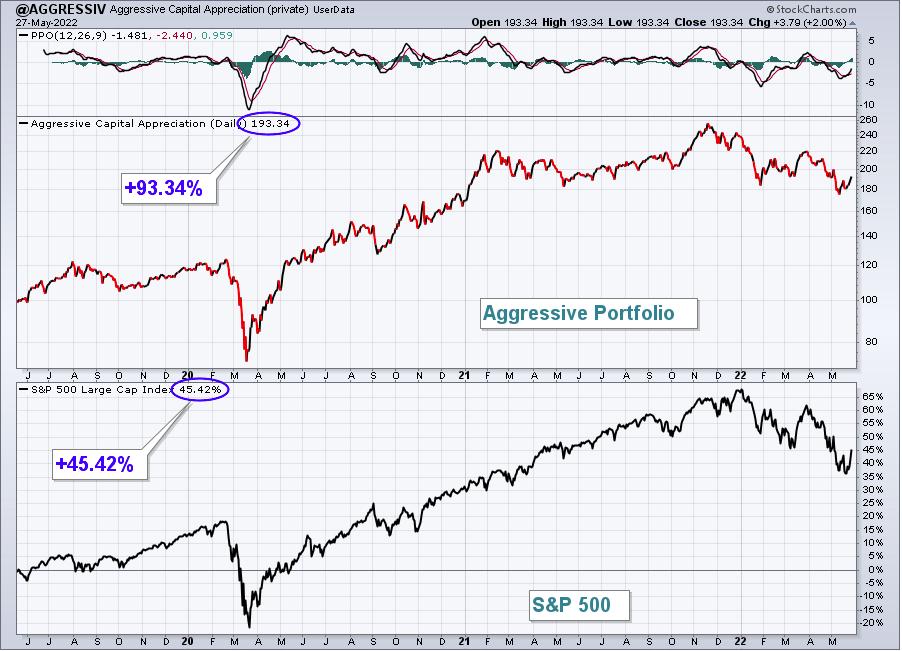
The Aggressive Portfolio rose 6.76% last week, slightly outperforming the S&P 500. Here's the updated inception-to-date chart of the portfolio:
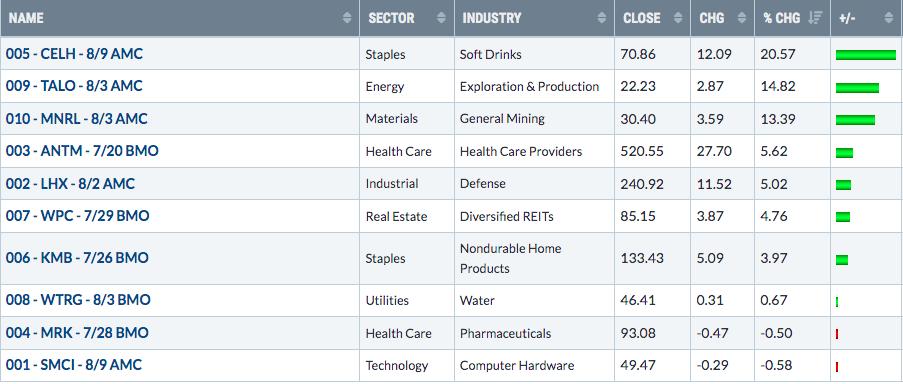
Here are how the Aggressive portfolio component stocks performed last week:
SMCI didn't participate last week, but that doesn't mean it wasn't doing good things technically. I like the reversing piercing candle just as key gap support was giving way:
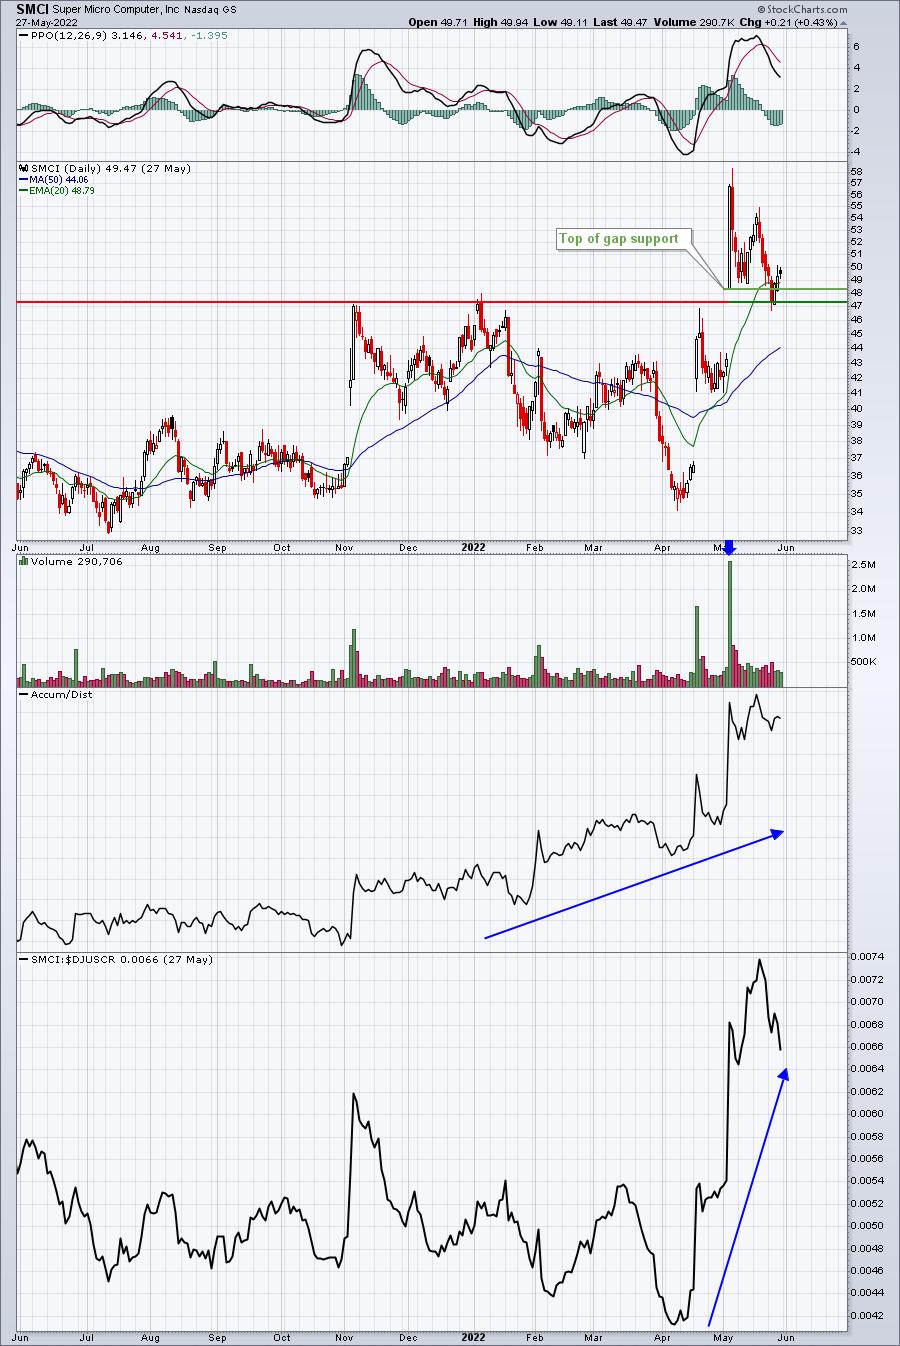
I wouldn't be at all surprised to see continuing price strength in the week ahead after a key reversal. Failure to hold last week's low, however, could easily lead to a lower gap support test just above 43.
Income Portfolio:
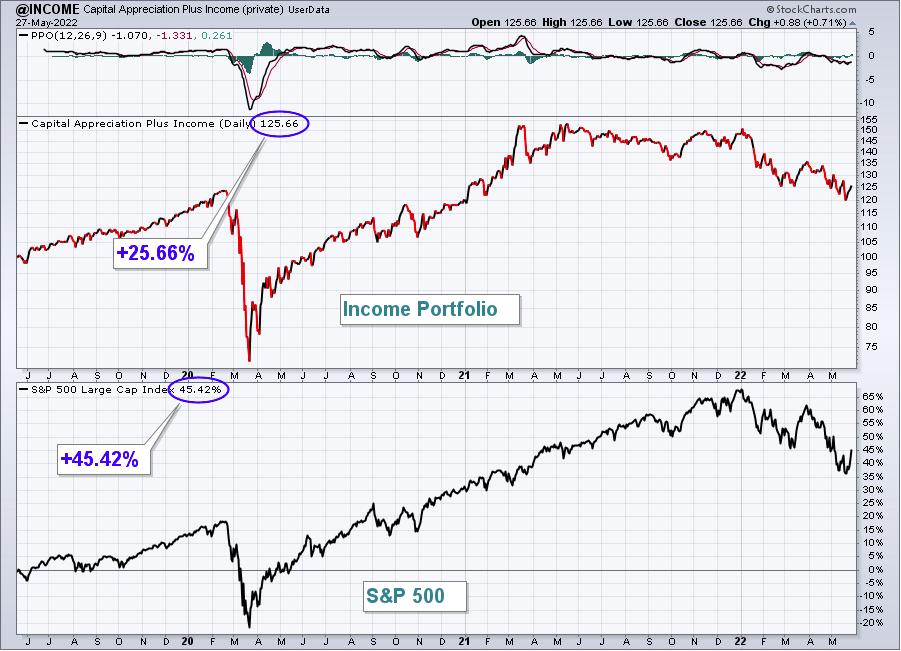
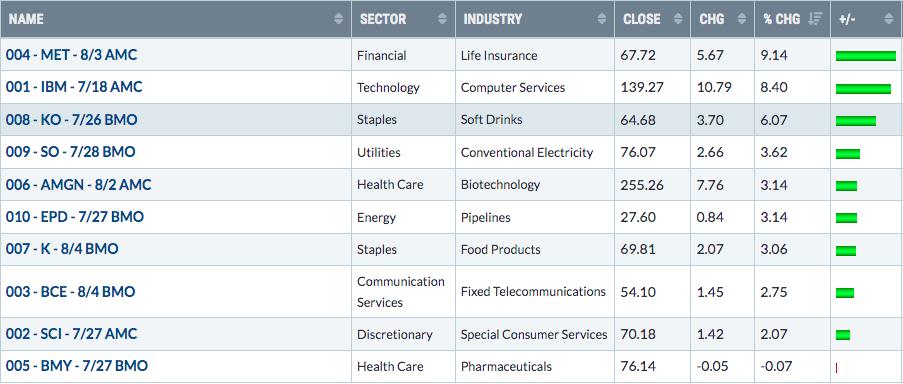
The Income Portfolio gained 4.12% last week, but underperformed the S&P 500.
Here's the updated inception-to-date chart of the portfolio:
Here are how the Income portfolio component stocks performed last week:
Want to talk about a beautiful gap support test? Check out IBM last week:
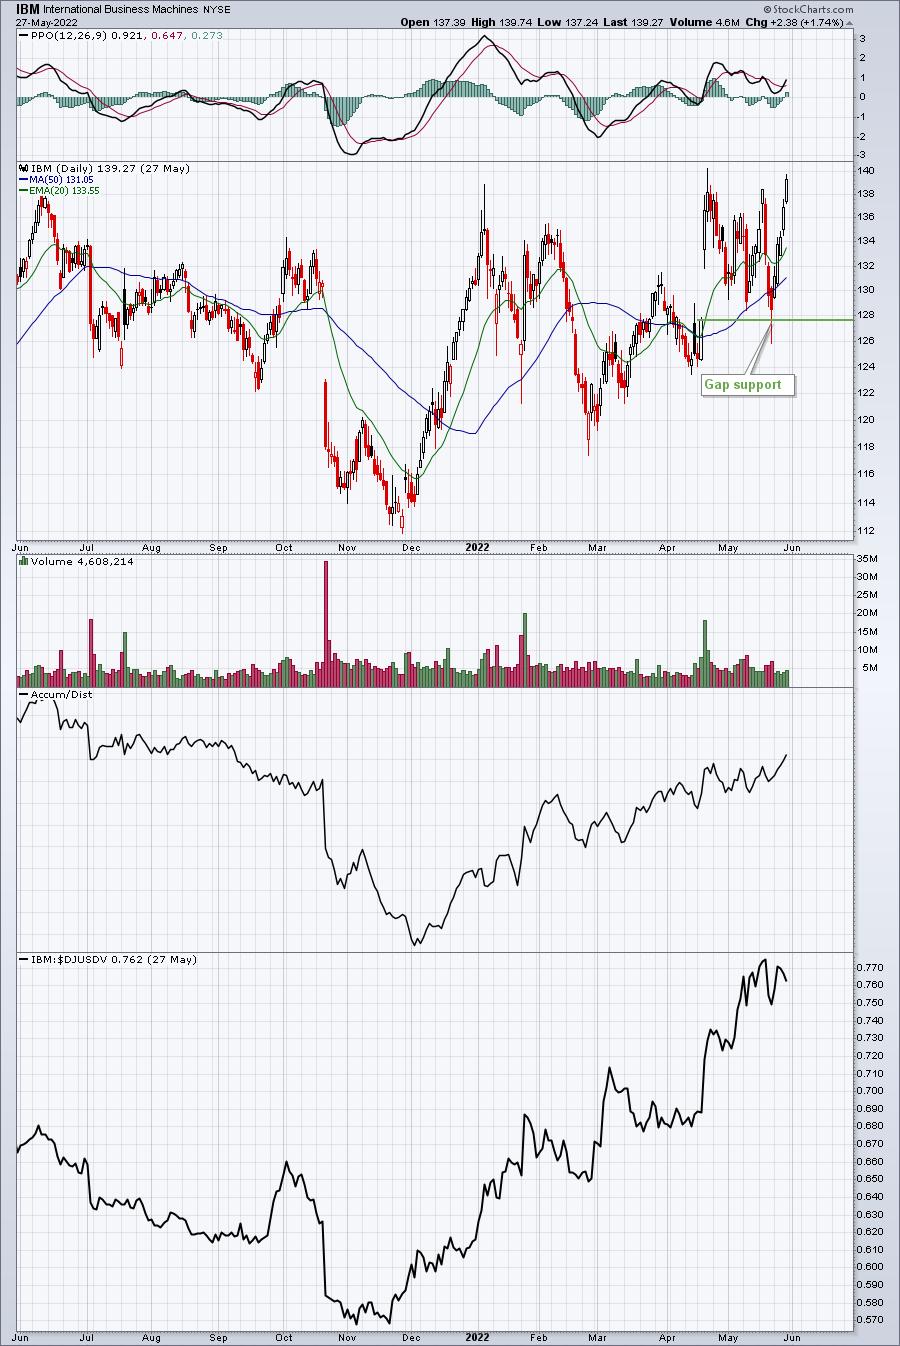
IBM looks as good technically to me as it has in the past decade. Keep in mind that IBM has struggled throughout the past decade to clear 145 on a closing basis. Doing so could be an indication that "Big Blue" is seeing BLUE SKIES ahead and could become a great long-term buy.
Strong AD Portfolio:
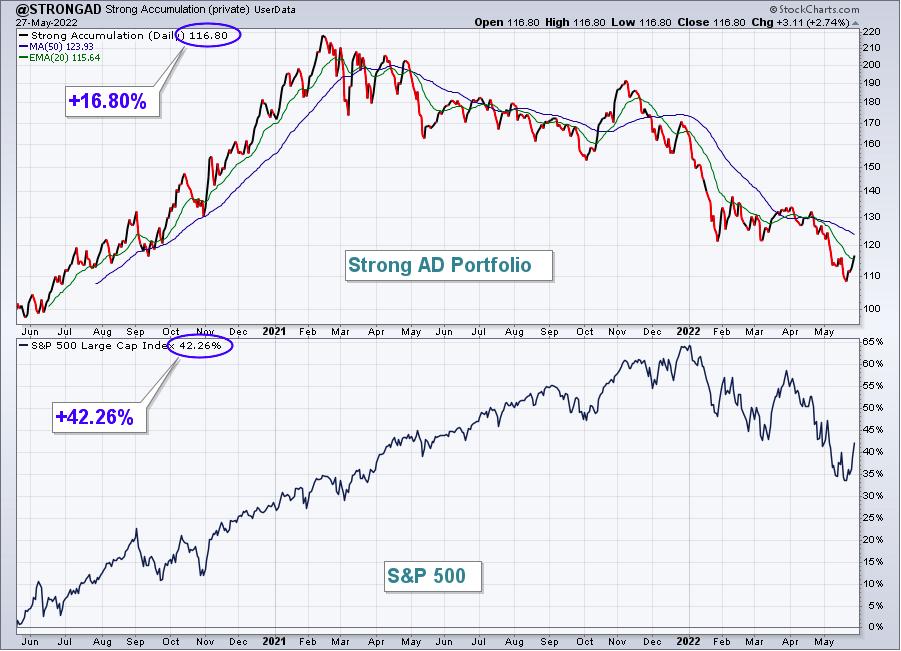
The Strong AD Portfolio jumped 7.85% last week, outperforming the S&P 500. Here's the updated inception-to-date chart of the portfolio:
Here are how the Strong AD portfolio component stocks performed last week:
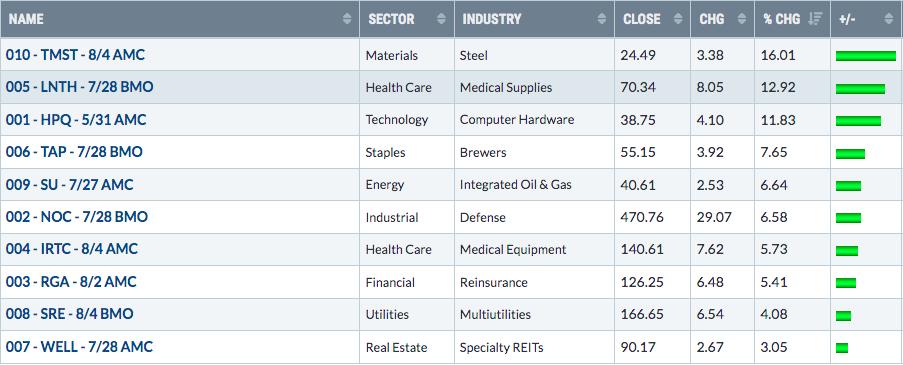
TMST obviously had a huge week last week, but it's now up against key price resistance. Those with a shorter-term trading mentality might consider selling and trying to buy back - either on a confirming breakout or on a rising 20-day EMA test:
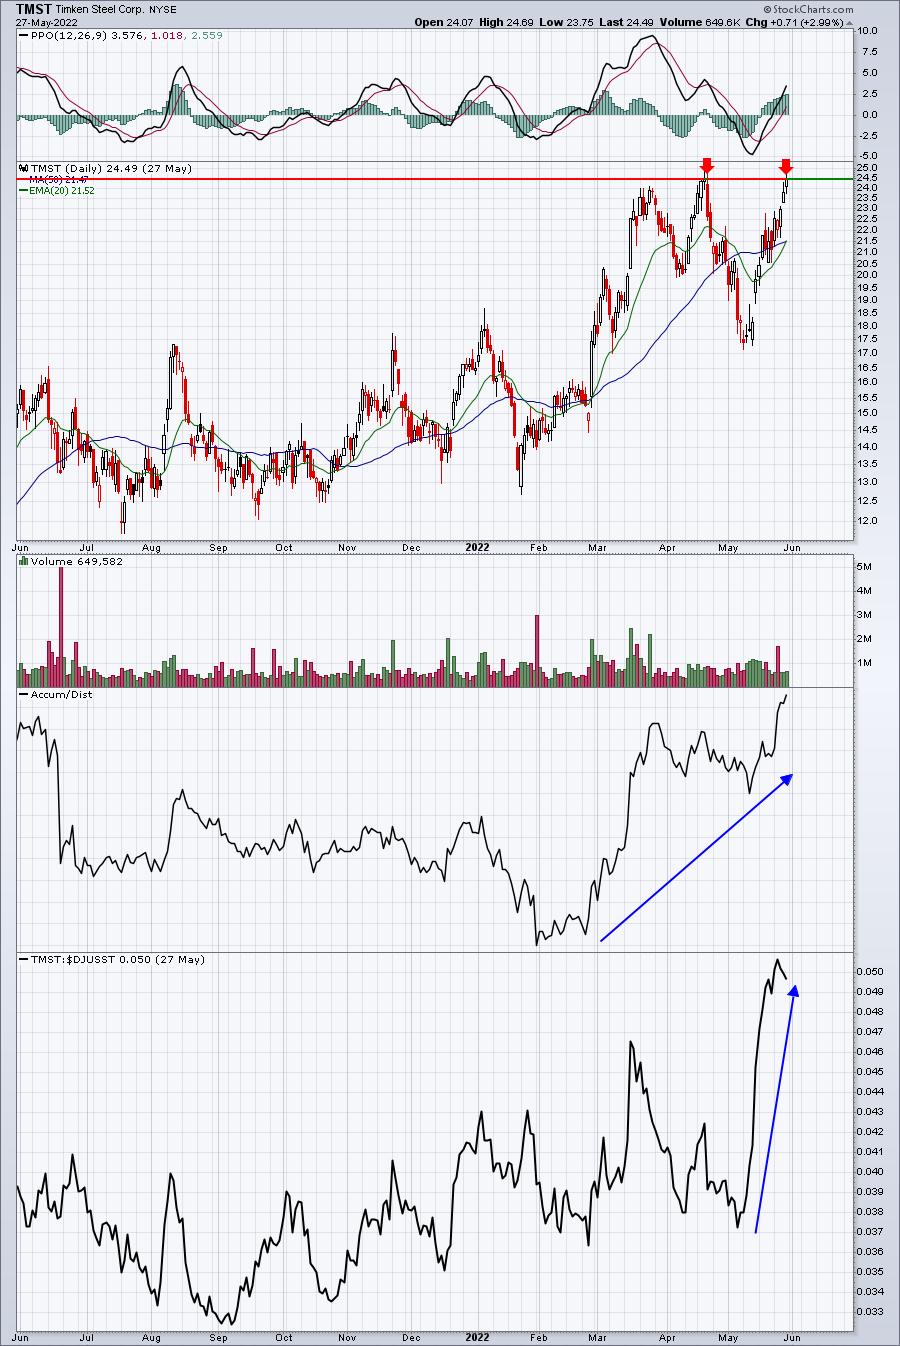
Clearly, TMST is a volatile stock. The only downside I see on this chart was last week's volume was underwhelming, suggesting that the sellers at resistance may not have too much difficulty regaining control of the action. Eventually, I like the breakout here, especially if inflation-speak remains front and center.
Earnings Reaction Portfolio:
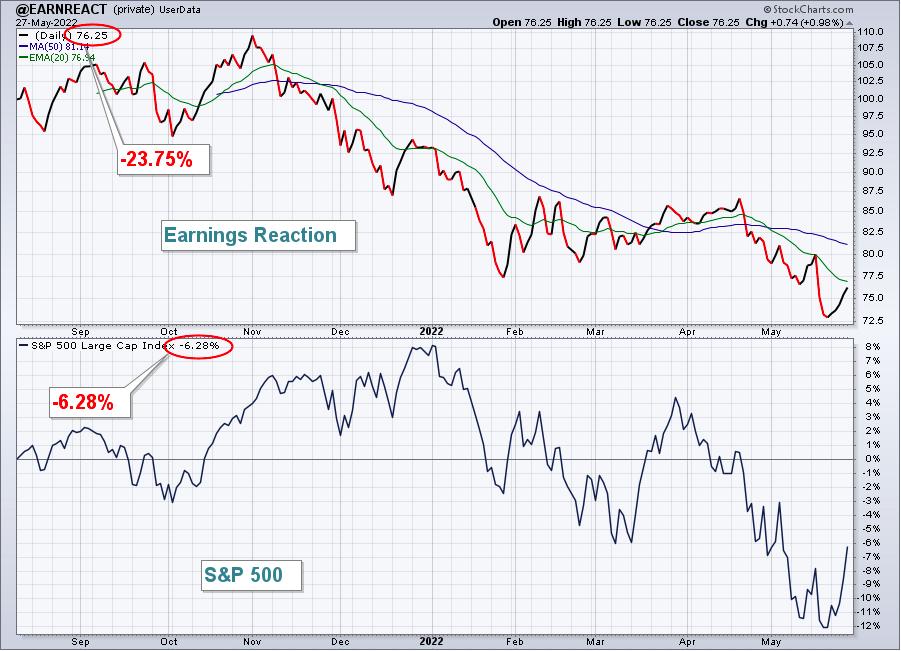
The Earnings Reaction Portfolio climbed 4.51% last week, trailing the S&P 500. Here's the updated inception-to-date chart of the portfolio:
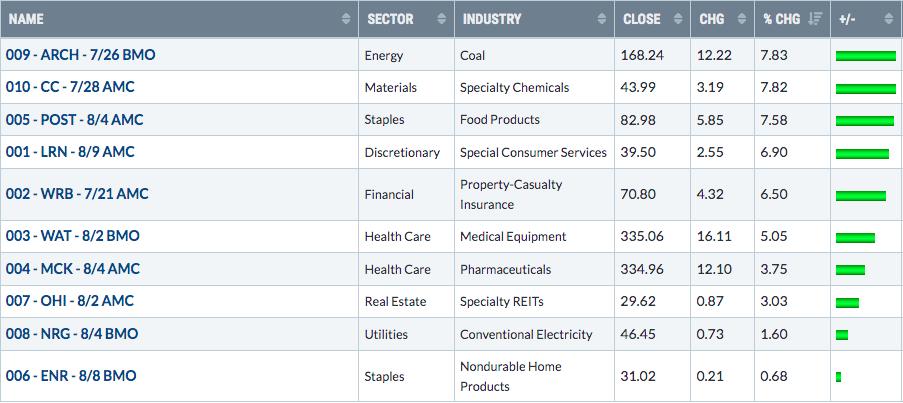
Here are how the Earnings Reaction portfolio component stocks performed last week:
ENR was a relatively poor performer last week, but there's still much hope here. After a big earnings-related move higher earlier in May, we've returned to the "scene of the crime" as ENR currently resides almost exactly where it gapped up to after earnings. I could most definitely see a surge from here:
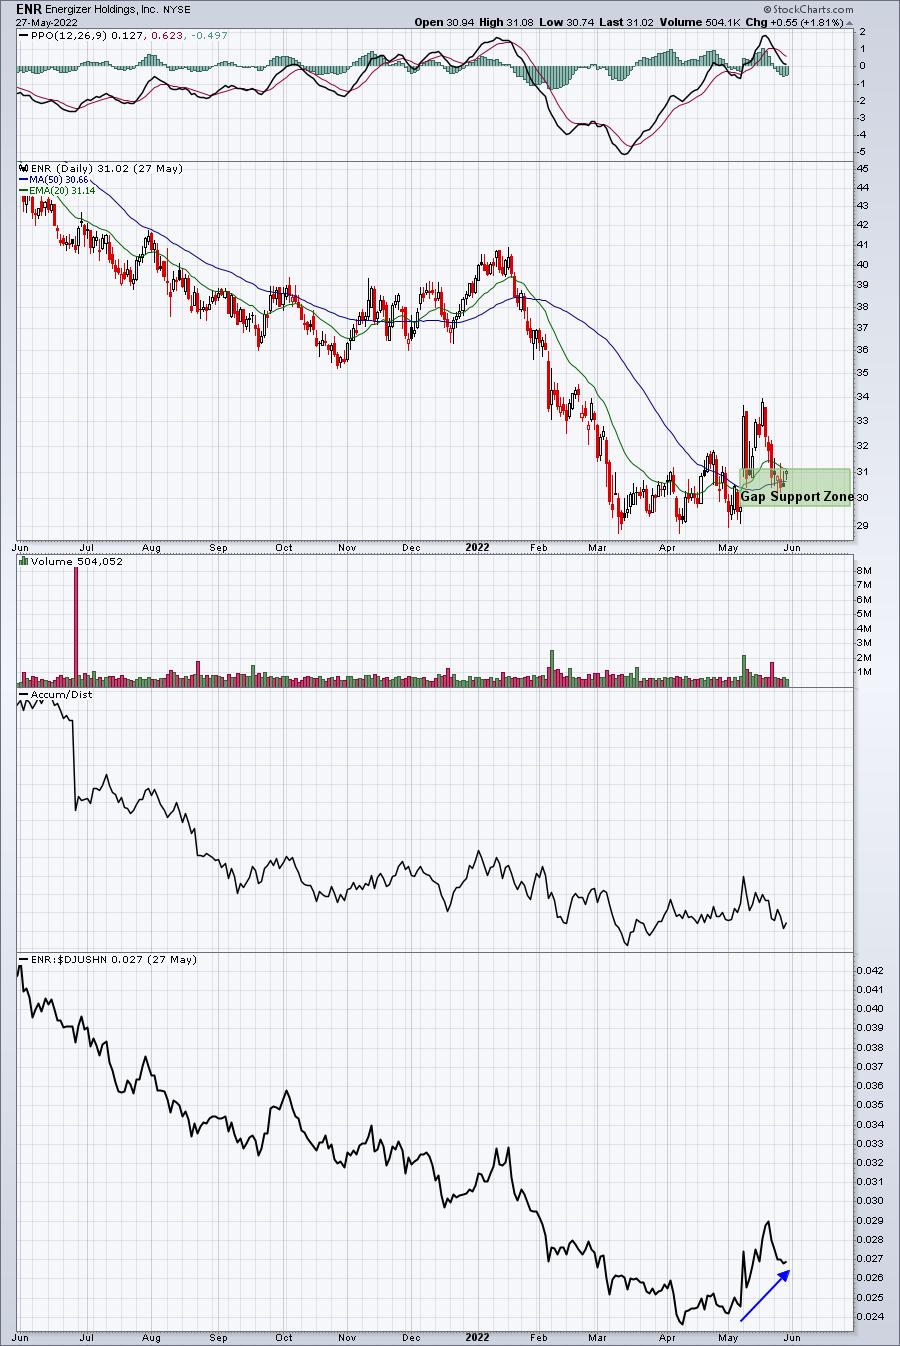
I'd be very careful if ENR loses gap support to the downside. But I don't believe it will. On the long side, I'd be looking to see if relative strength in that bottom panel returns. If so, look for at least a test of the recent price high near 34.
The Week Ahead
I don't know if we've bottomed, but if we haven't, we're getting close. We all need to keep an eye on the inflationary data and how the stock market reacts to it. There's a sure-fire way to interpret the stock market's reaction. It's really simple. Watch growth stocks. This chart of the S&P 500 will tell us most of what we'll need to know. IGNORE what the media is saying and watch THIS chart:
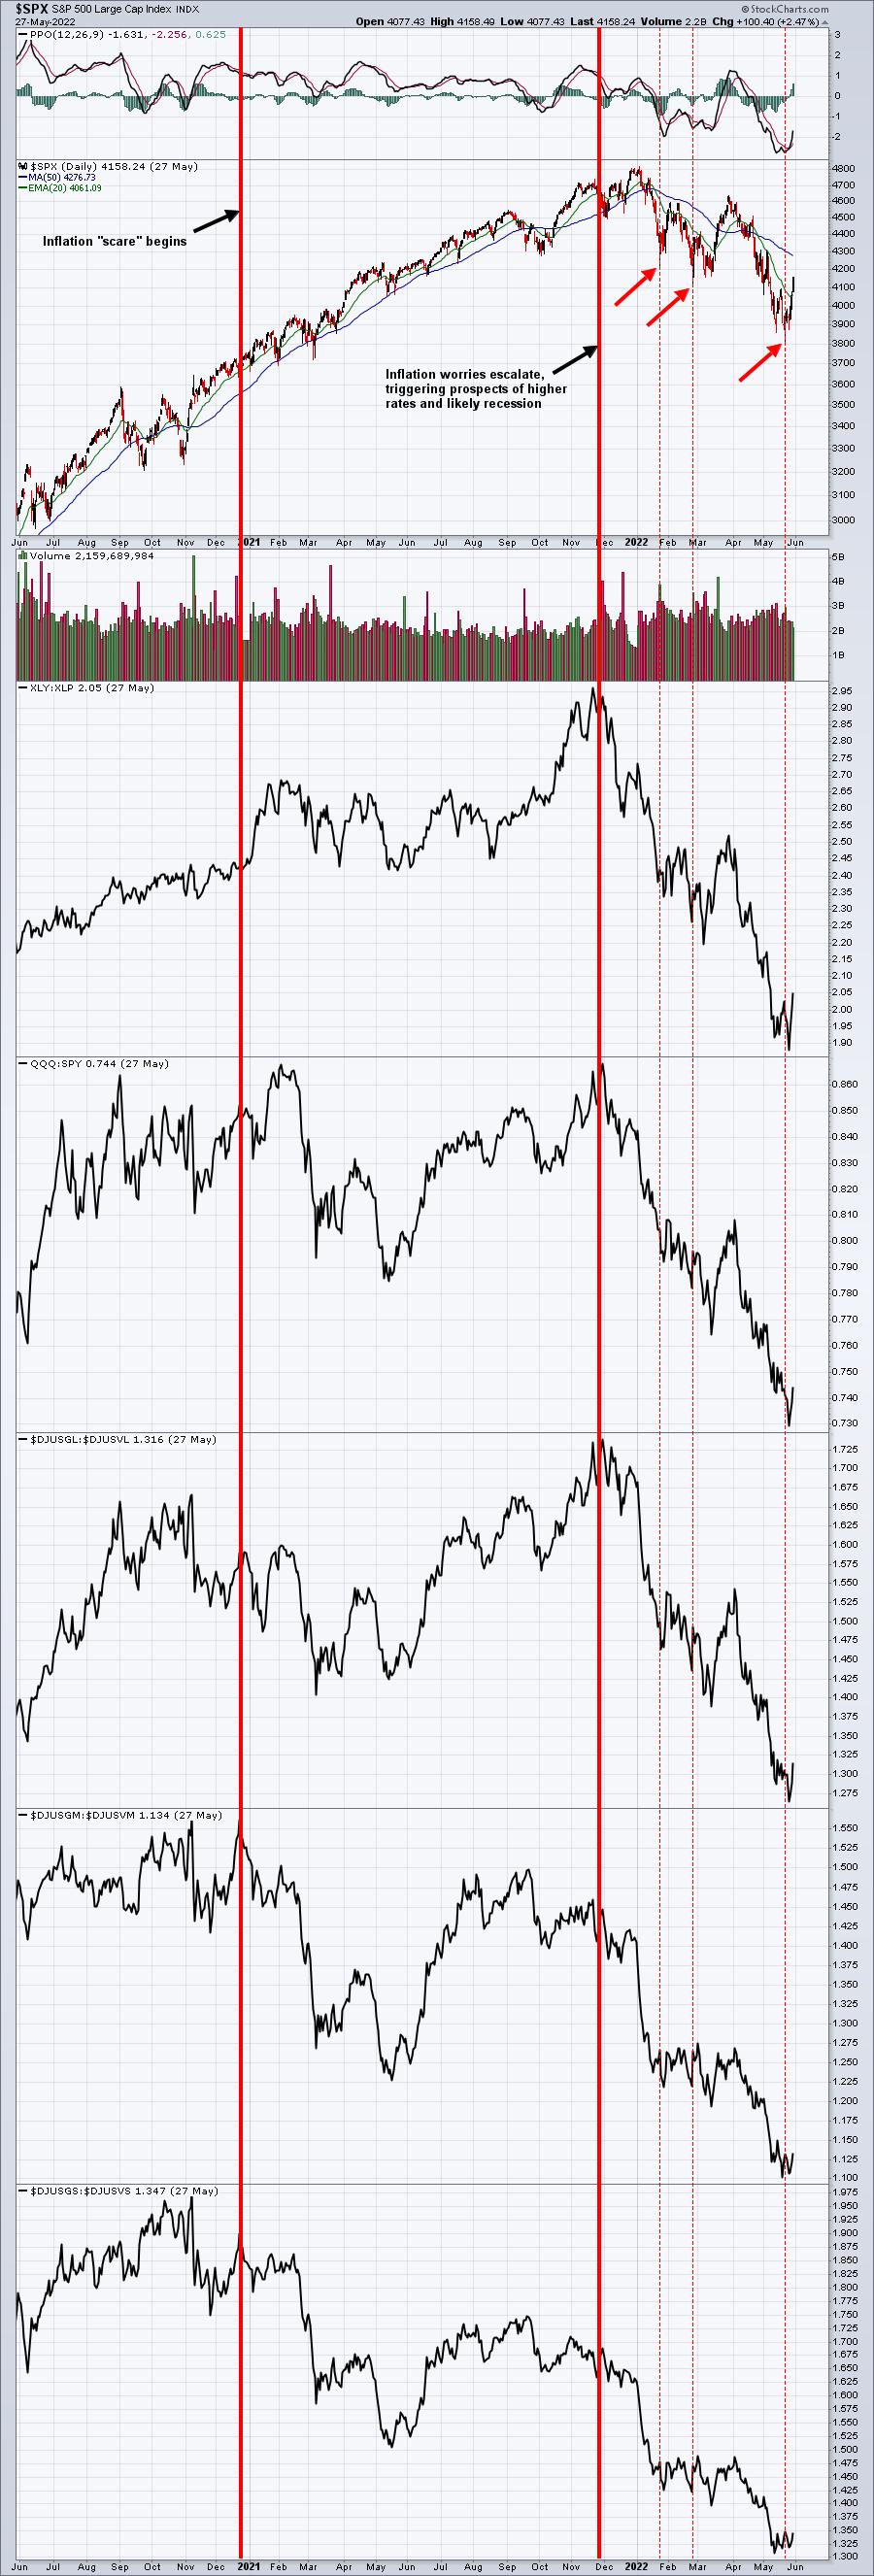
The two solid red vertical candles mark two points in time. The first, in my opinion, was Wall Street reacting to "potential" inflation issues. The large cap growth stocks performed much better, because stocks like Apple (AAPL) and Microsoft (MSFT) have pricing power. They could raise prices and it wouldn't impact their market share. Smaller growth companies don't have that pricing luxury, so they were sold immediately. The second solid red vertical line was inflation reality. It wasn't going away and the Fed needed to fight it. At that point - again, in my opinion, the stock market moved away from "just an inflation scare" to a likely recession, because the Fed would need to act aggressively to fight inflation, becoming increasingly hawkish. That has been taking a serious toll on our economy. Q1 GDP unexpectedly turned negative. Consumer stocks were crushed. Consumer sentiment predicted this, dropping for a year prior to this selling episode.
Now let's turn our attention to the current 2022 downtrend. Note that the three lower lows on the S&P 500 are accompanied by lower lows on the accompanying "sustainability" ratios. We're not seeing Wall Street repositioning just yet in growth areas. That is very likely to take place over the summer months, if I'm right about Fed getting inflation under control. Honestly, I don't really think the Fed will have to do too much. A recession will help as demand will ease considerably, allowing companies the ability to catch up on the supply side. This surge in inflation was caused by BOTH a demand issue and a supply issue. It all came together simultaneously due to pandemic-related circumstances. I believe we're starting to work our way through those issues and U.S. equities are getting closer and closer to LAUNCHING higher. While it's possible that launch has already begun, I still believe we're likely to see one more move lower - especially if we see ANY bad news on the inflation front. If so, watch the "under the surface" signals for key rotation back into growth. That's what we'll be looking for.
Model ETF Portfolio
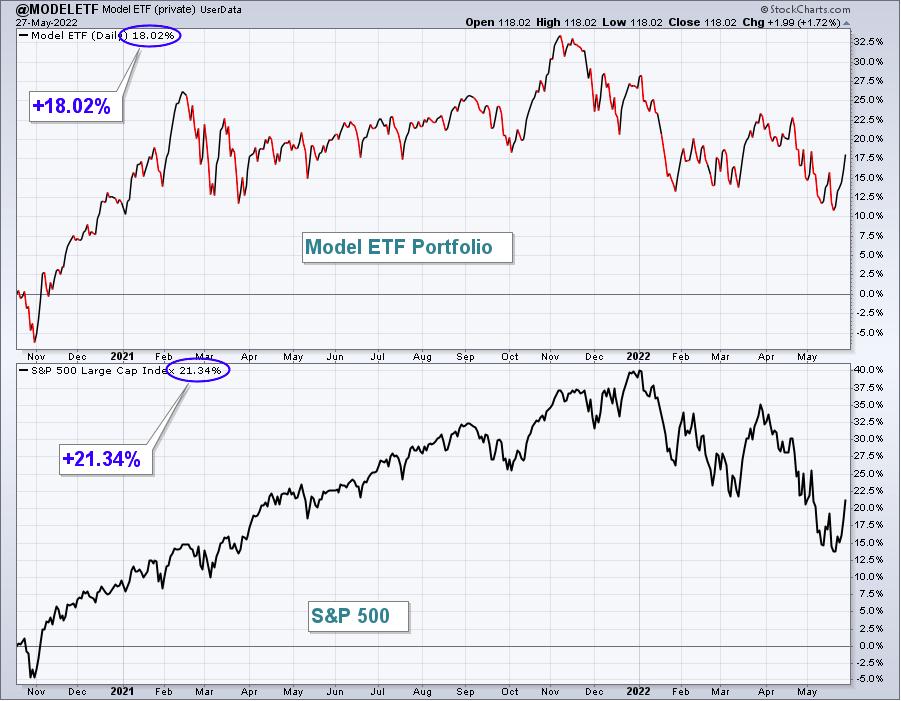
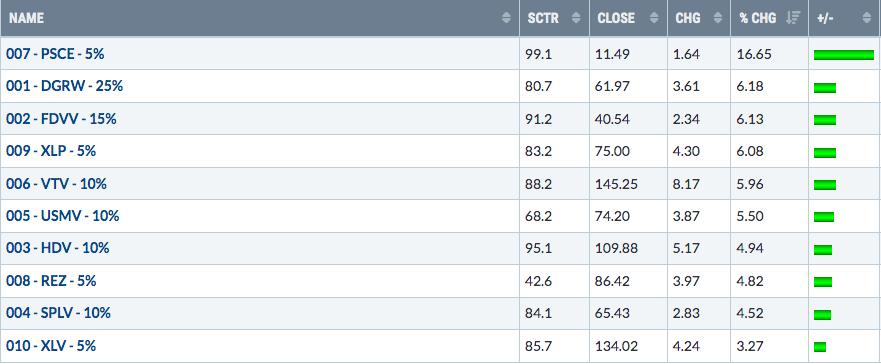
Our Model ETF Portfolio gained 6.04% last week, but fell just shy of the S&P 500's performance.
Here's the updated inception-to-date chart of the Model ETF Portfolio:
Here are how the Model ETF Portfolio component ETFs performed last week:
Happy trading!
Tom Bowley, Chief Market Strategist
EarningsBeats.com
"Better timing. Better trades."