
EB Weekly Portfolio Report - Sunday, June 12, 2022
Upcoming Earnings Reports
According to Zacks.com, the following companies will be reporting earnings this week and each is a component of one of our portfolios:
Monday, June 13: None
Tuesday, June 14: None
Wednesday, June 15: None
Thursday, June 16: None
Friday, June 17: None
PLEASE NOTE: The above companies were provided using earnings dates provided by StockCharts.com. My research is limited to what StockCharts.com provides and I also can make a mistake from time to time, so please double check for earnings dates for all companies that you own from a reputable source like Zacks.com. We do hold our portfolio stocks through one earnings report, but every EarningsBeats.com member must make his/her own investing/trading decisions about holding stocks into earnings reports as it's the most volatile (risky) time to own a stock.
Portfolio Rules and Objectives
Here are the common traits and objectives of our portfolios:
- There are 10 leading stocks from up to 10 leading industries in each portfolio (at the time of selection). Generally, there will only be one stock per industry group, but there could be exceptions.
- They are held for an entire 90-day period, with no stops in place. We strive for consistency, transparency, and simplicity in our portfolios. EB.com members may hold these stocks for the entire 90 days, trade them, use stops, etc., but for purposes of our calculation, we will make no exceptions to our "buy and hold for three months" strategy.
- Every stock will generally be held through ONE earnings report
- The expectation is that relative winners will carry the portfolio to outperformance
- They were all entered into as of the close on Friday, February 18th; members may choose to try to time better entries, but EB.com "purchased" as of February 18th's closing prices
- Primary objective is to outperform the benchmark S&P 500 over time; quarter-to-quarter performance can be extremely volatile, especially if significant rotation takes place intra-quarter
Here are several considerations for EB members:
- I would expect the Aggressive, Strong AD, and Earnings Reactions portfolios to be the riskiest, followed by the Model portfolio, and then the Income portfolio
- The Strong AD portfolio will be selected from a combination of rising accumulation/distribution lines and SCTRs above 70 at the time of selection. The Earnings Reactions portfolio is based on strong accumulation the day after its quarterly earnings are released and solid relative strength (vs. its peers). These are the only two portfolios that do NOT require revenue and EPS beats in their most recent quarterly earnings reports
- The Income portfolio stocks will all pay dividends, with the expected average dividend yield to be at least 1.0%
- Drawdowns (losses) should be much milder on the Income portfolio, with more volatility expected on the other four; please review inception-to-date charts below to gain an idea of the volatility associated with each
- I believe the larger drawdown on the Income portfolio at the beginning of the pandemic was an anomaly, occurring as many defensive, higher-yielding companies uncharacteristically underperformed during a market decline.
- Large drawdowns in the February through May 2021 and the November 2021 to February 2022 periods were due to the rapid rotation from growth stocks to value stocks; each quarter, our portfolios are based on themes and there is never a guarantee that our analysis and beliefs will be proven correct
- You should consider owning or trading these stocks in whatever manner is most comfortable for you; while we will buy all 10 stocks in the manner identified above, feel free to trade certain stocks or wait for pullbacks if the stocks are overbought
- We have no idea what risk each member is willing or able to take. We are not registered investment advisors so be sure you understand the risk you take. Please consult your financial advisor.
- EarningsBeats.com shareholders/employees may own all or some of the portfolio stocks from time to time.
Weekly Snapshot
Here's a weekly recap:
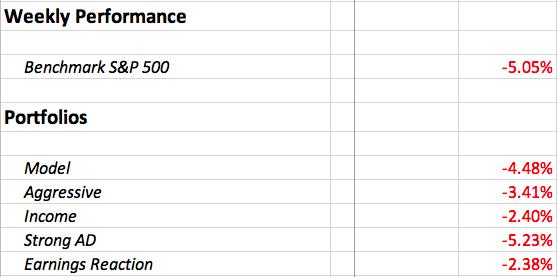
Weekly Summary
Benchmark S&P 500:
Early last week in a Daily Market Report (DMR), I indicated to watch out for a big red-filled candle to break below the recent trading range. Also, in last week's EB Weekly Portfolio Report, I highlighted a 100-point trading range with key support at 4083 (20-day EMA). On Thursday, we saw the very bearish short-term candle that I feared:
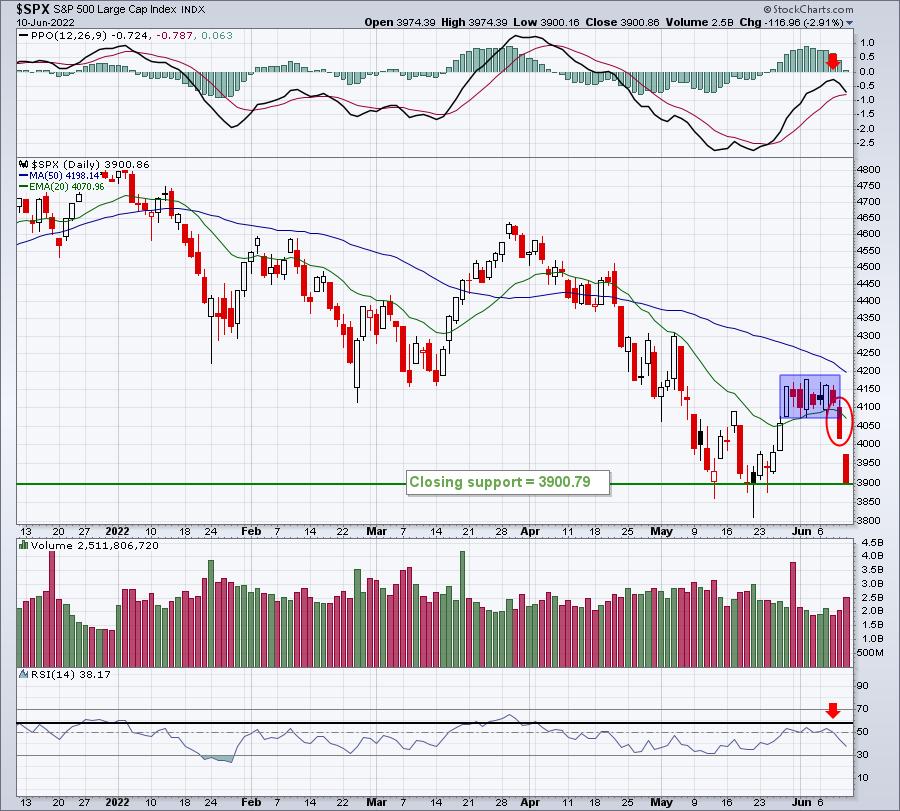
As I mentioned last week, I REALLY want to call a bottom, but there simply haven't been any definitive signs of one yet and last week's price action suggests we have another leg lower. It's the reason we remain so cautious with our portfolios right now, remaining much more heavily invested in defensive sectors, along with energy (XLE) and materials (XLB). We have a bit of growth in our portfolios, but not much.
Below is a reprint of the S&P 500 chart that I provided last weekend. I'm bringing it up again not only so that you can study the current technical picture again, but also to highlight the subjectiveness of drawing trend lines and channel lines. Last week, I highlighted a channel, which is the black-dotted parallel lines. By connecting slightly different prices (some intraday lows instead of candle body lows), I come up with a slightly different slope on my down channel (thick red-dotted parallel lines):
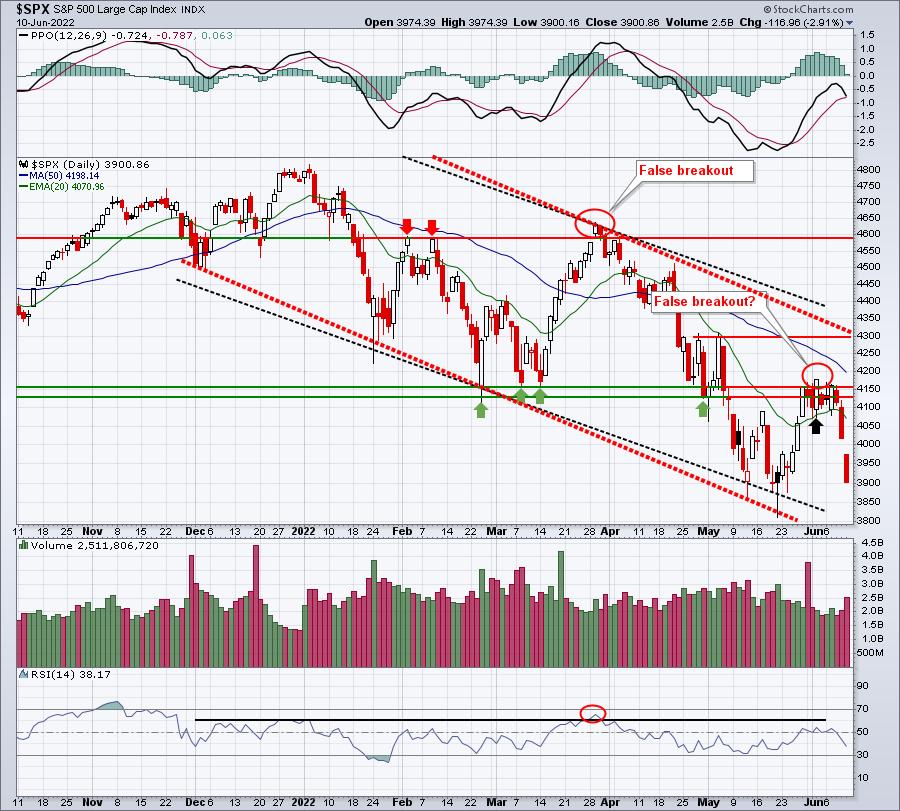
Thursday and Friday were both brutal days that look to extend this cyclical bear market to a lower level.
Model Portfolio:
The Model Portfolio lost 4.48% last week, but did manage to outperform the S&P 500. Here's the updated inception-to-date chart of the portfolio:
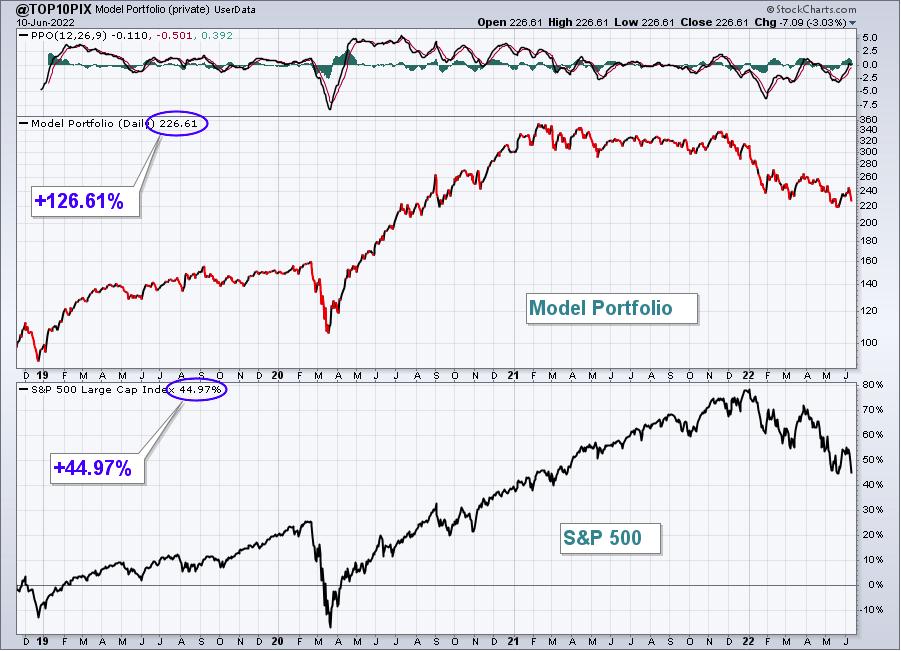
Here are how the Model portfolio component stocks performed last week:
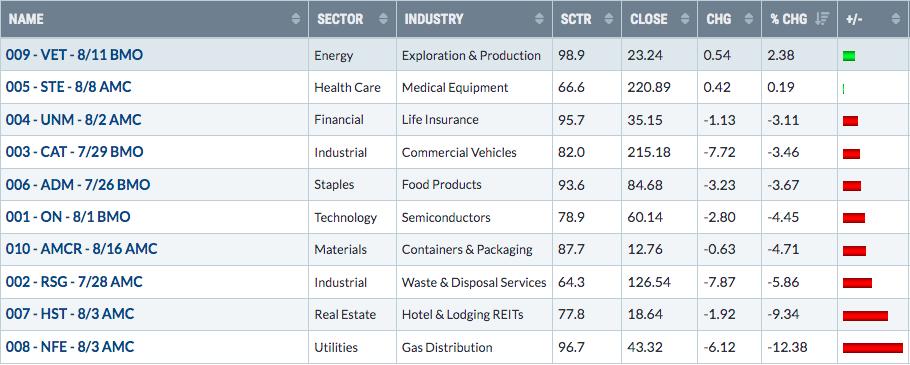
Life insurance ($DJUSIL) has dropped maybe 14% or so over the past couple months, but it's holding its own vs. the benchmark S&P 500 after a steady relative rise earlier this year. UNM is an excellent performer within this space and it's getting close to a key gap support:
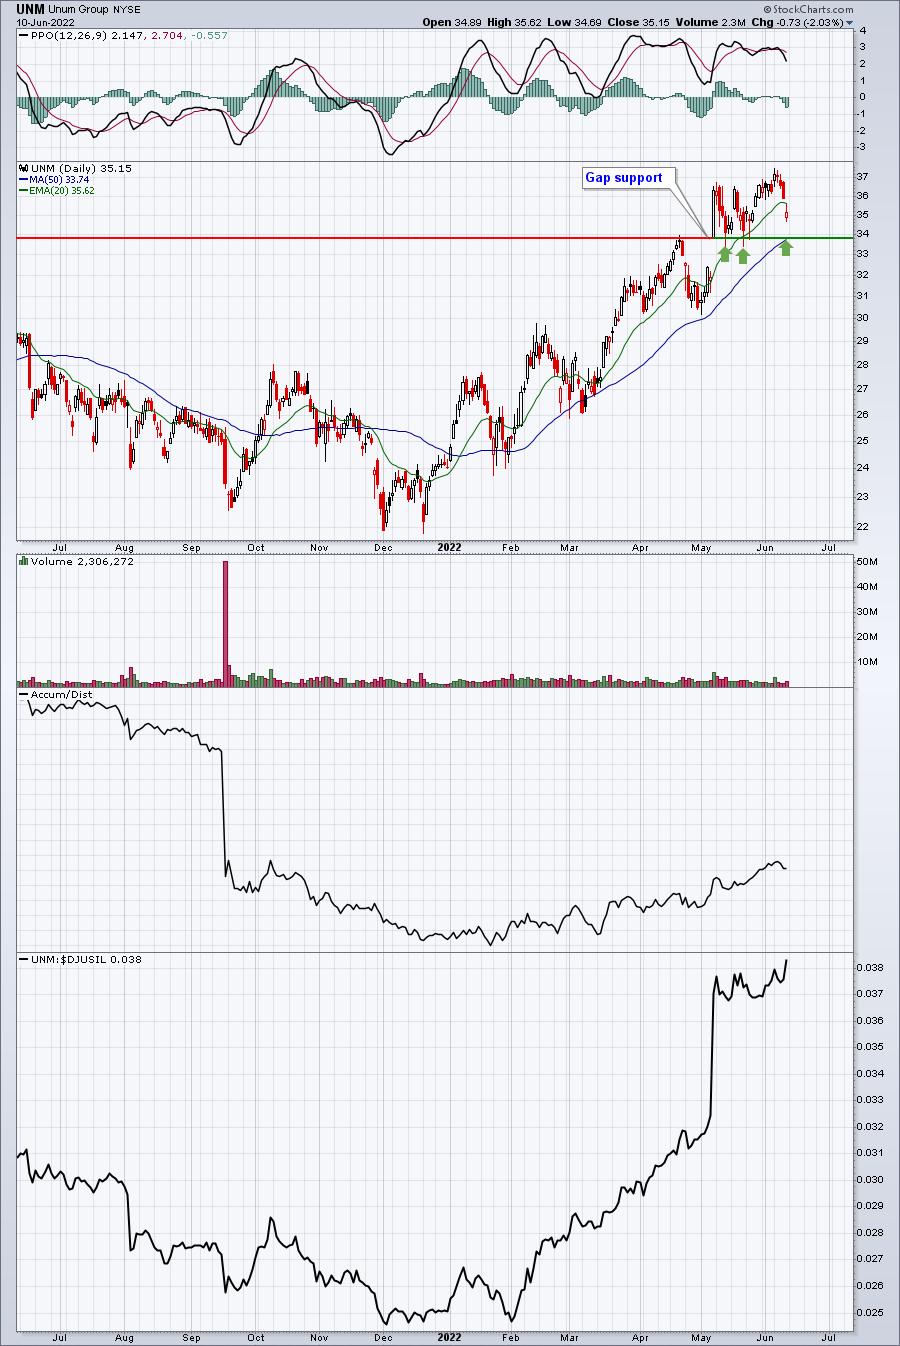
Note that gap support also coincides with the rising 50-day SMA, two potential reasons for buyers to step up there.
Aggressive Portfolio:
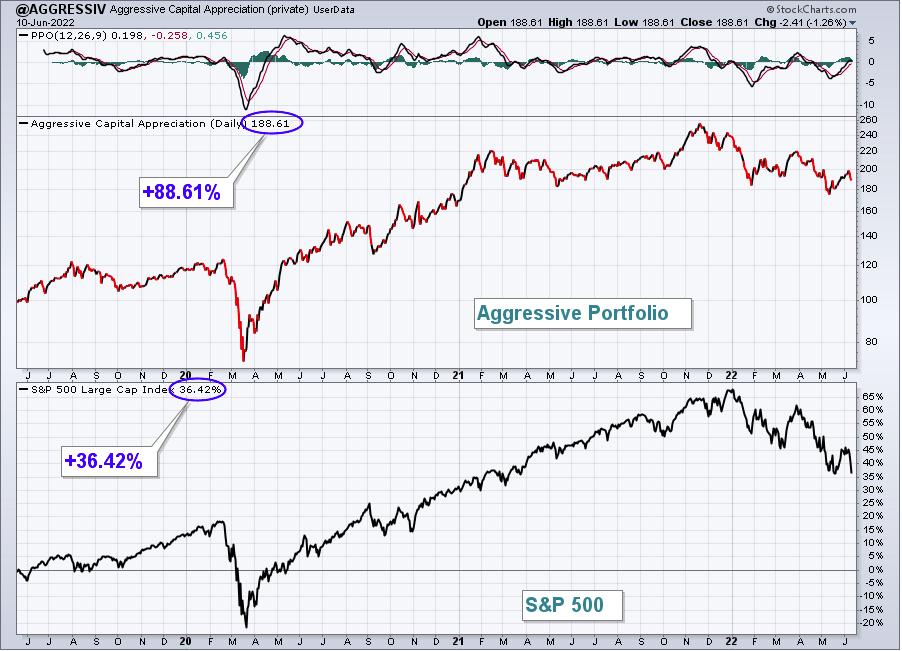
The Aggressive Portfolio fell 3.41% last week, outperforming the benchmark S&P 500. Here's the updated inception-to-date chart of the portfolio:
Here are how the Aggressive portfolio component stocks performed last week:
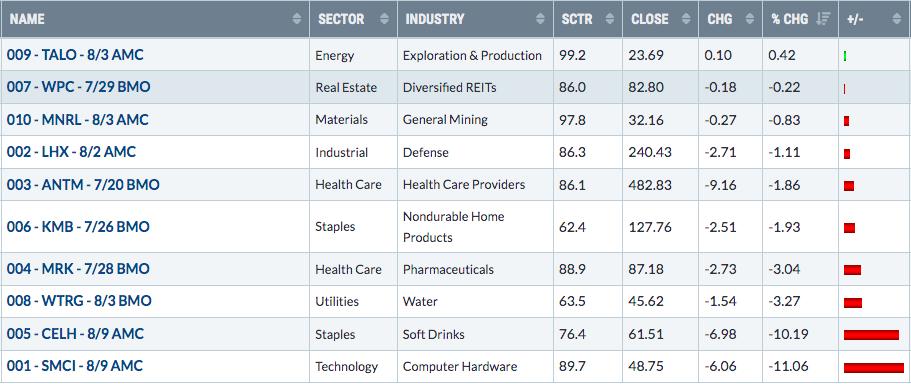
If the stock market weakens further, defensive stocks should do better on a relative basis, possibly even rising. Therefore, a stock like MRK is a stock I'd consider if I were to trade in this environment. While it did lose its 50-day SMA support late last week, I still see a possible turnaround area in an upcoming gap support zone:
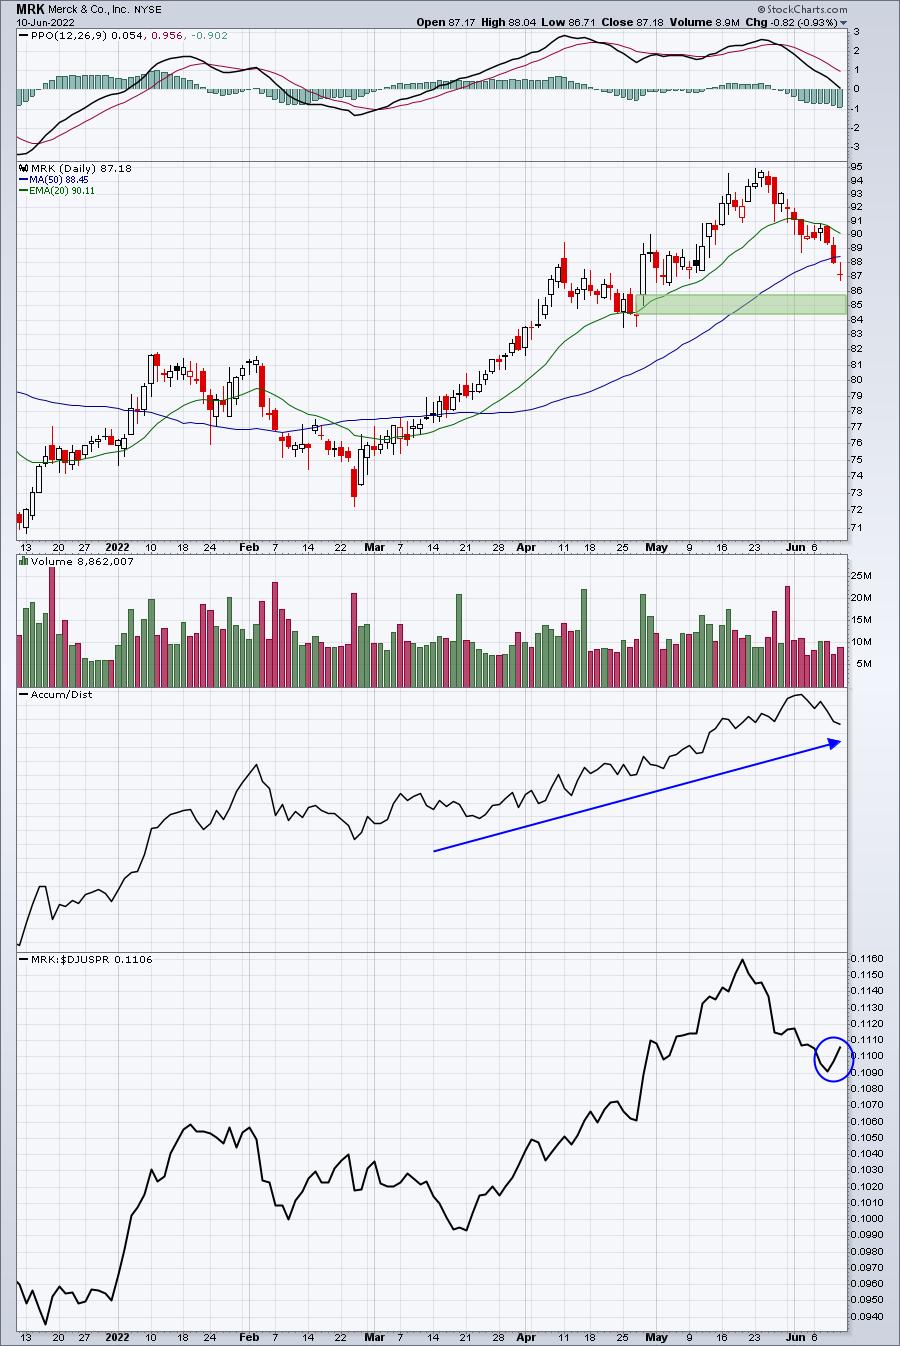
MRK has been a leader in pharmas ($DJUSPR) and its relative strength line appears to be turning higher. Meanwhile, its AD line has been strong throughout 2022 and its PPO line is now back to centerline support. I wouldn't be surprised to see buyers step back in here soon.
Income Portfolio:
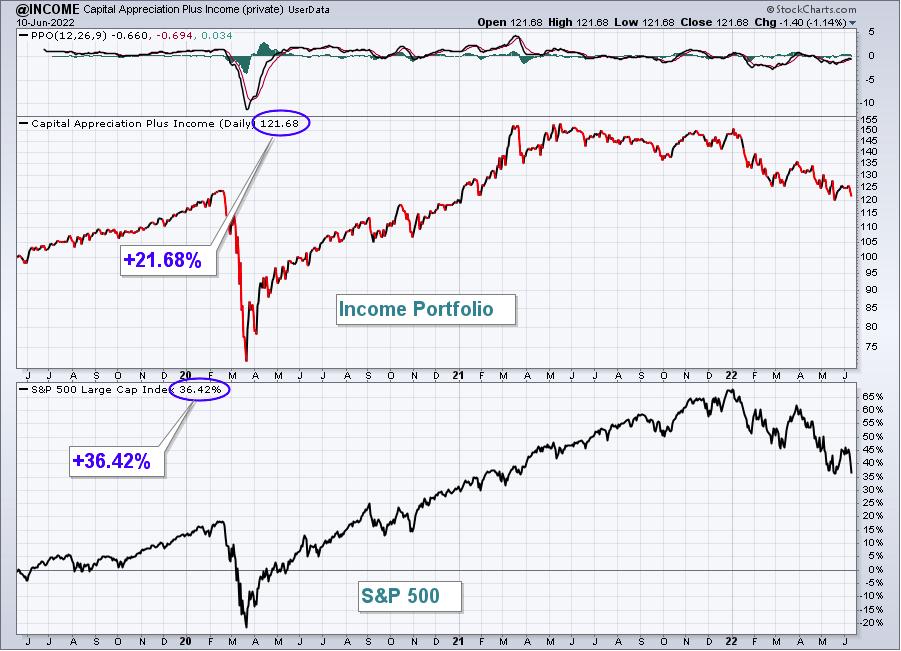
The Income Portfolio lost 2.40% last week, but outperformed the S&P 500 by a wide margin.
Here's the updated inception-to-date chart of the portfolio:
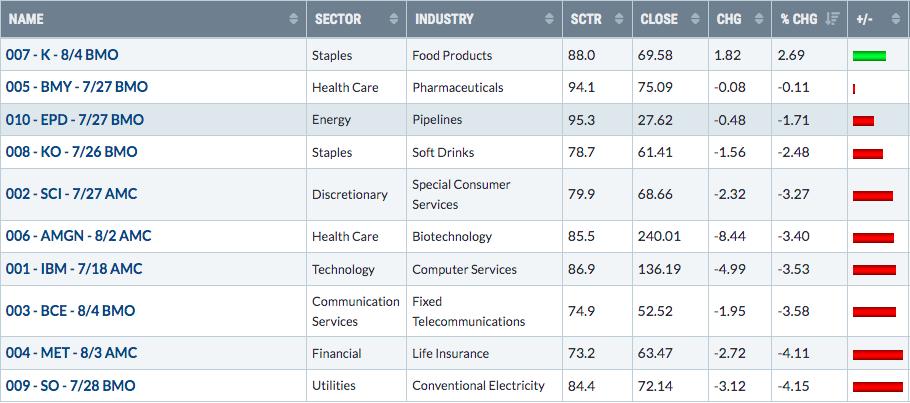
Here are how the Income portfolio component stocks performed last week:
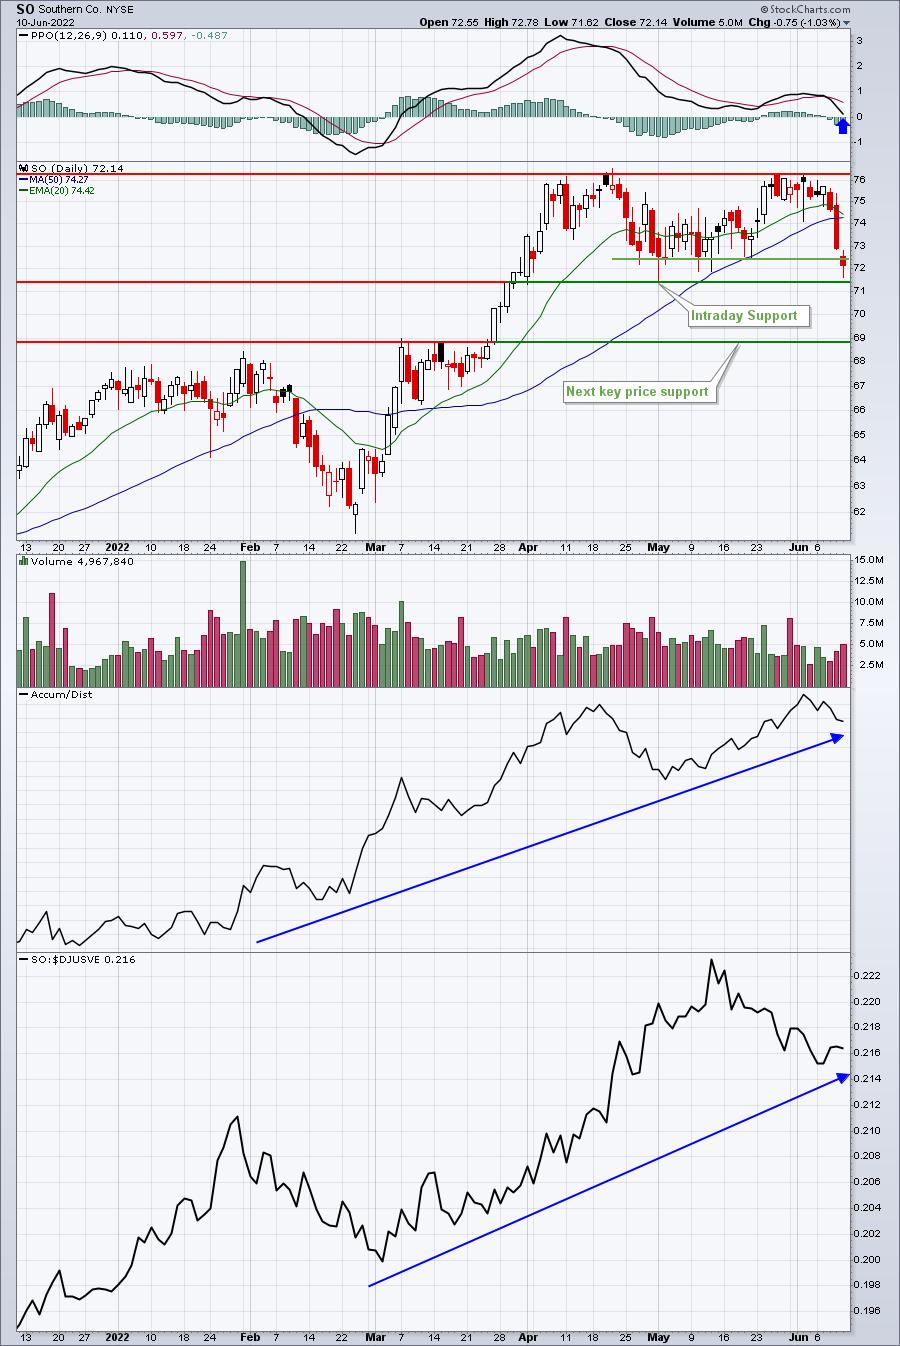
SO had a rough week, but is still hanging onto intraday price support. It needs to turn quickly or the 69 price support level could be tested:
Strong AD Portfolio:
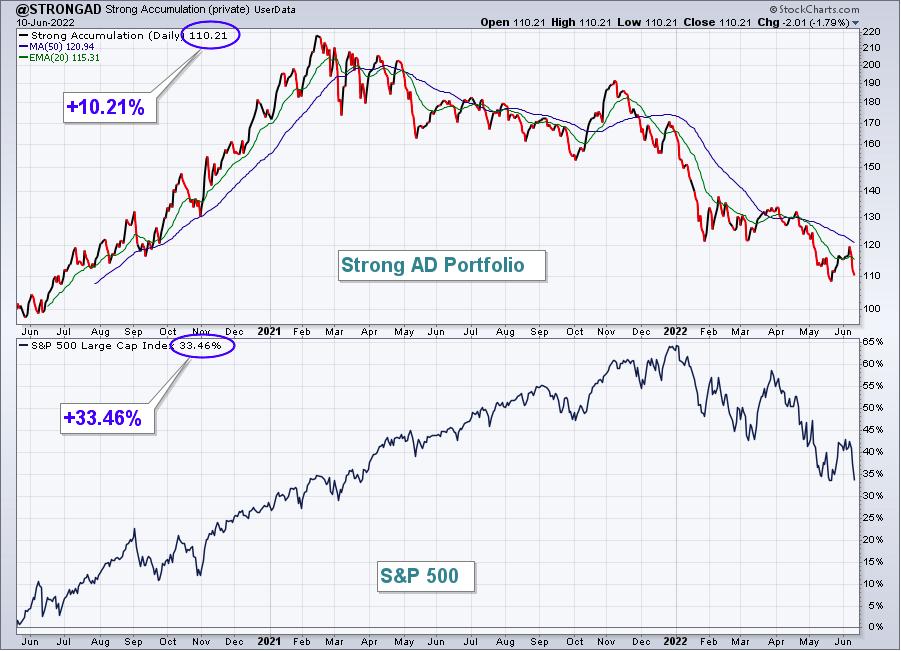
The Strong AD Portfolio tumbled 5.23% last week, slightly underperforing the S&P 500. Here's the updated inception-to-date chart of the portfolio:
Here are how the Strong AD portfolio component stocks performed last week:
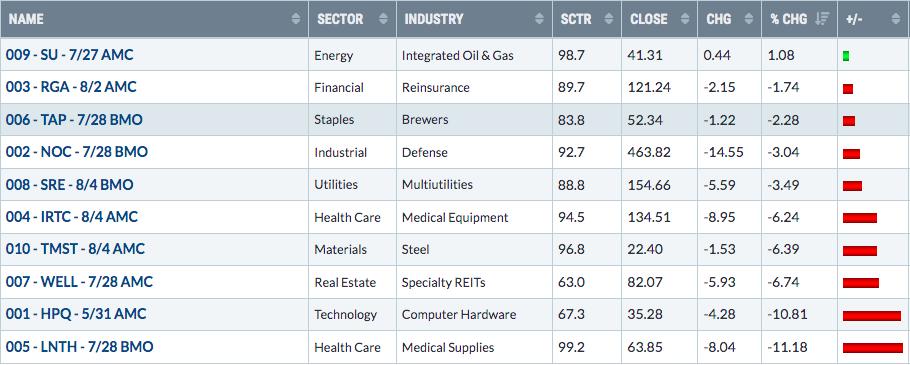
There's been a lot of back and forth on NOC. I see a very bullish ascending triangle pattern that followed an uptrend (prerequisite). There was a breakout, but to confirm this pattern, we want to see heavy volume. Unfortunately, we didn't get that. However, now that NOC has fallen back to test its 50-day SMA, I believe the reward to risk trading opportunity is solid. I like entry at the current price and again just below 450. A close below 440 would be damaging technically.
Earnings Reaction Portfolio:
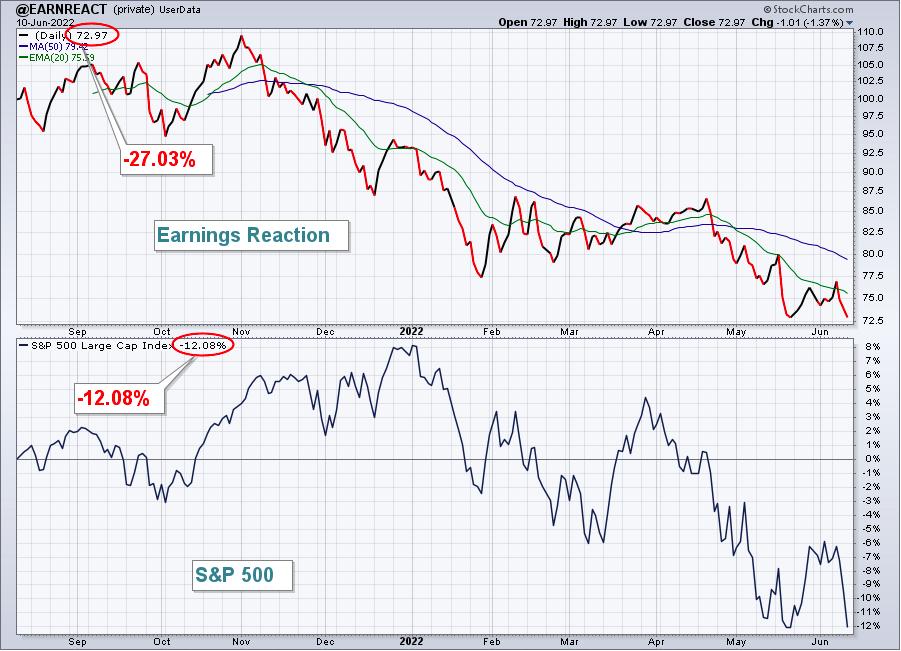
The Earnings Reaction Portfolio fell 2.38% last week, but easily outperformed the S&P 500. Here's the updated inception-to-date chart of the portfolio:
Here are how the Earnings Reaction portfolio component stocks performed last week:
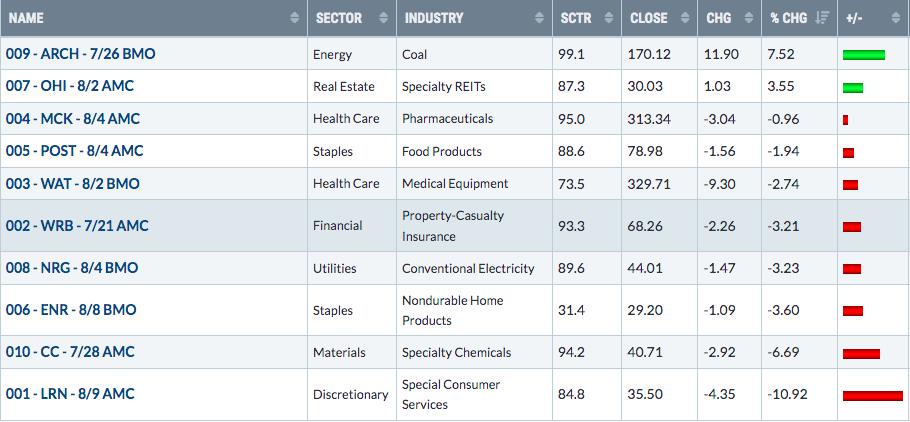
MCK has been a very strong performer during the recent shift from growth stocks to value stocks. It's certainly benefited considerably from this shift and its strong AD line suggests that Wall Street has been consistently buying the stock. Given its recent selling, MCK also shows a solid reward to risk trading opportunity off of 306-310 price support. However, if 306 support is lost, MCK easily could see a drop to its last breakout at 281:
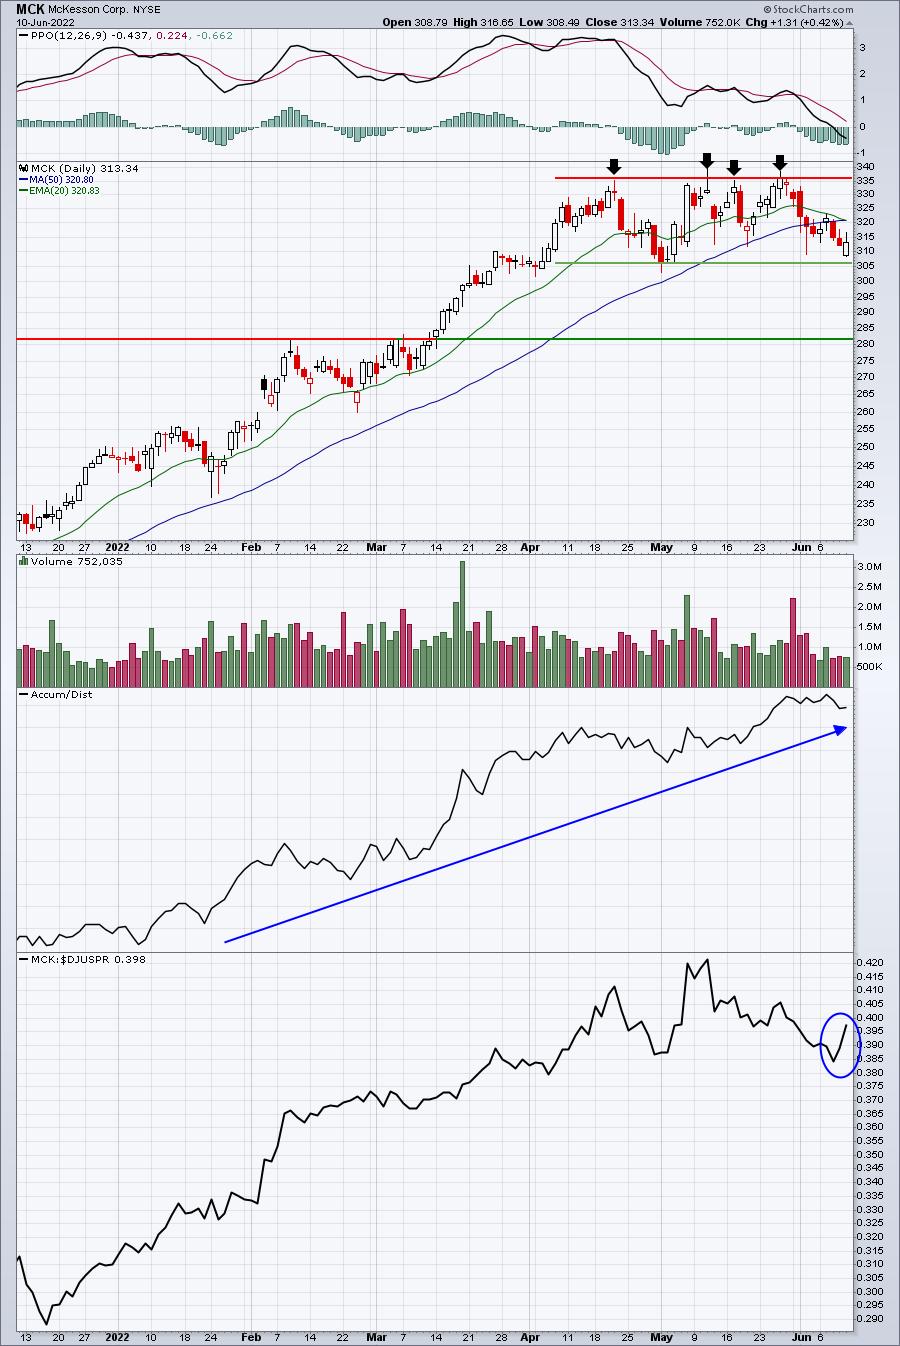
The current trading range is roughly 306-336. From 336, that's approximately a 9% difference. If MCK breaks down at 306, the measurement of 9% would take the stock down to roughly 279. That's very close to where I see next support. I'm not saying it's going to 279-281, but the odds certainly increase considerably if 306 price support is lost.
The Week Ahead
As we look at the week ahead, clearly the outlook is much different than it was one week ago. Last week, we were pausing, but we were coming off an uptrend and trading above 20-day EMA support. The bulls had hope that an uptrend had begun and there was key support at the rising 20-day EMA.
What a difference a week makes.
Now, we're sitting squarely on critical bear market support at 3900. If we break down, I do see price support in the 3500 area, but keep in mind that bear market lows are typically set by EXTREME panic and fear, not necessarily by prior support. A MAJOR bottom would likely be established on the next big decline, IF it's accompanied by insane volatility ($VIX) and/or equity only put call readings ($CPCE). The upper-30s to low-40s would qualify as insane on the VIX and a 5-day moving average on the CPCE at .80 or above would be the insane equivalent there. Here's where we stand with both right now:
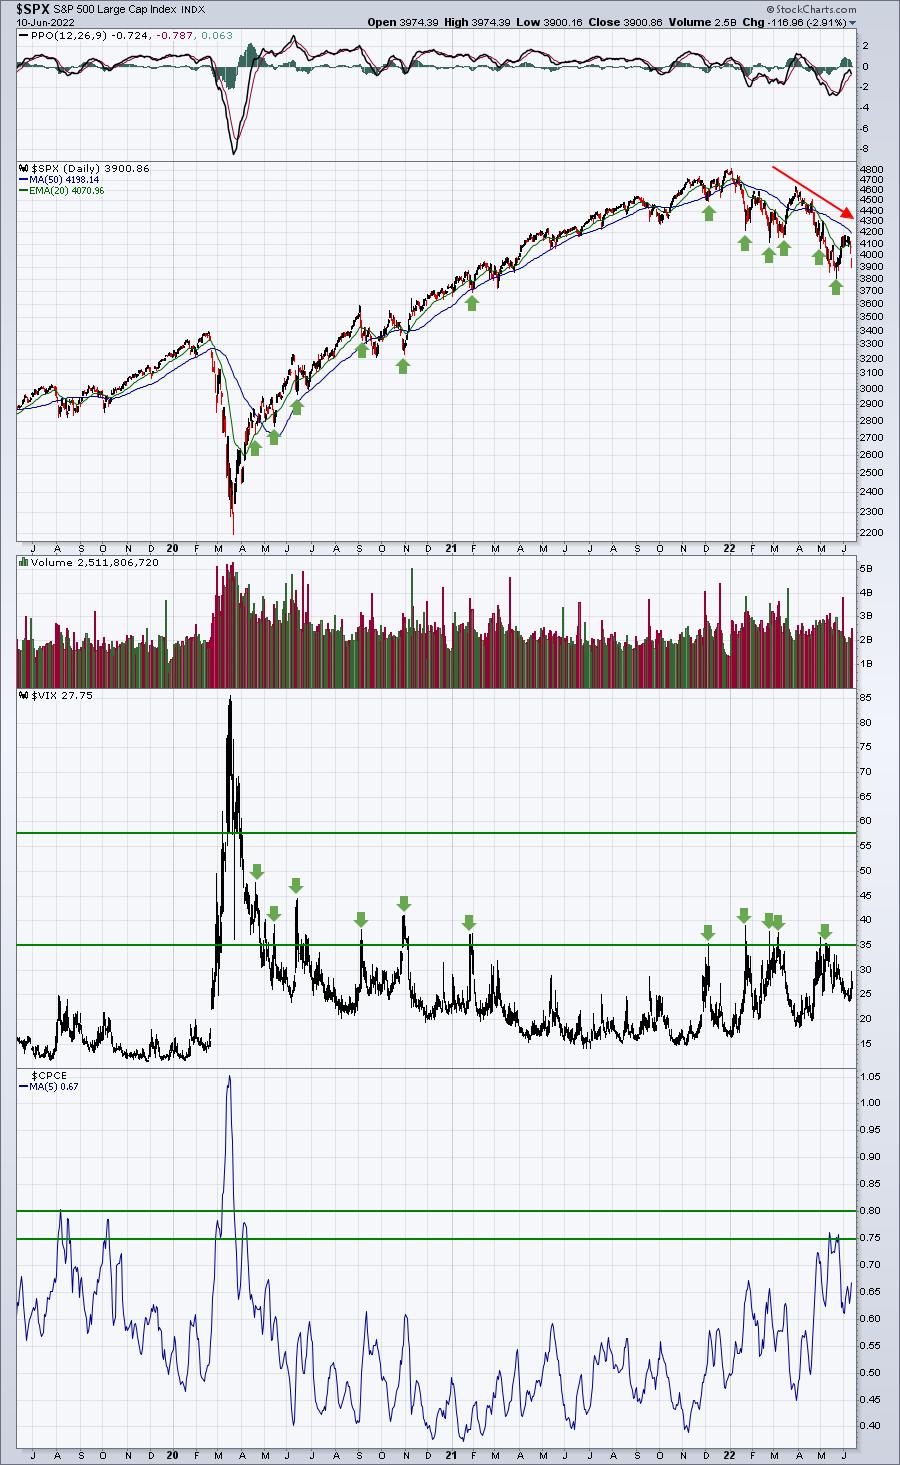
The green arrows highlight the VIX readings above 35 and how they coincide with key market bottoms. These are not necessarily long-term bottoms. Sometimes they're simply the short-term bottom, so keep that in mind. However, the 5-day moving average of the CPCE does a better job of helping us find MAJOR bottoms. I went back to year 2000 and identified what I considered to be the 18 most significant S&P 500 lows this century. In ALL 18 cases, the 5-day moving average of the CPCE hit .75. In 15 of these 18 cases, that 5-day moving average reached .80 or above. At the May low, we did see this moving average touch .75. That's a good start. But it would much, much better for the stock market psyche to see one more tumbling exercise that's accompanied by a skyrocketing VIX and soaring 5-day moving average of the CPCE that moves above .80.
At the beginning of the year, I indicated that the incredibly bullish sentiment needed to "reset". The only way that happens is via big losses. Why would investors panic if prices kept moving higher or even went sideways for awhile? They wouldn't. We needed sentiment to grow incredibly bearish and THAT is what's happening. I'm not saying that economic conditions are great. Obviously, they are not. But the stock market doesn't need great news to bottom. That's the disconnect that nearly every individual investor struggles with. I've learned to trust the charts. There is ZERO CHANCE (less than zero if that's possible) that I'll call a bottom based on information through the media.
If I can convince all of our EarningsBeats.com members to do one thing, it would be this: Do not EVER listen to what you're hearing in the media or in a meeting or in a bar in trying to determine which direction the stock market is heading. It'll cost you thousands and thousands of dollars over your lifetime.
Watch and follow the charts, including critical intermarket relationships. Follow the sentiment. These are the tools to help us all manage our finances much more effectively and enable us to reach our financial goals.
Model ETF Portfolio
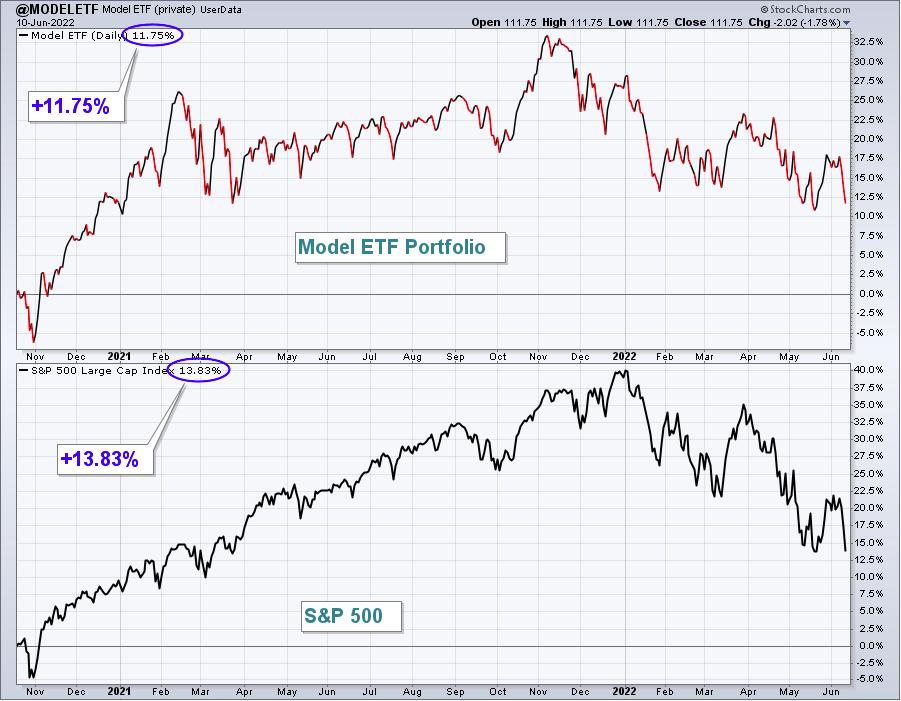
Our Model ETF Portfolio fell 4.01% last week, outperforming the S&P 500 by a full percentage point.
Here's the updated inception-to-date chart of the Model ETF Portfolio:
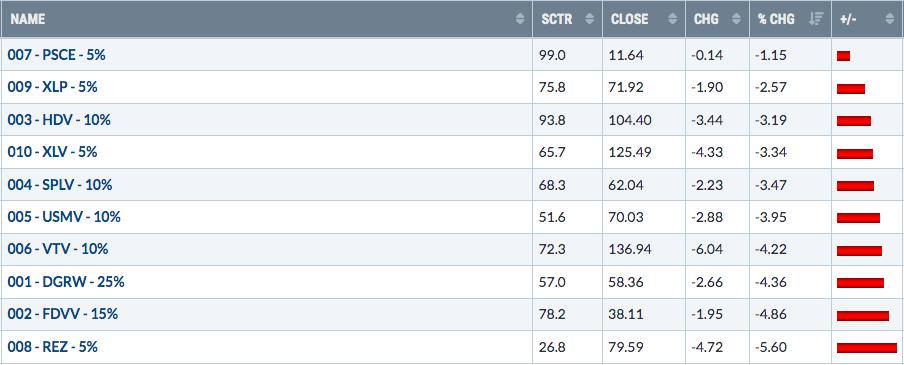
Here are how the Model ETF Portfolio component ETFs performed last week:
Happy trading!
Tom Bowley, Chief Market Strategist
EarningsBeats.com
"Better timing. Better trades."