
EB Weekly Portfolio Report - Sunday, June 27, 2022
Upcoming Earnings Reports
According to Zacks.com, the following companies will be reporting earnings this week and each is a component of one of our portfolios:
Monday, June 27: None
Tuesday, June 28: None
Wednesday, June 29: None
Thursday, June 30: None
Friday, July 1: None
PLEASE NOTE: The above companies were provided using earnings dates provided by StockCharts.com. My research is limited to what StockCharts.com provides and I also can make a mistake from time to time, so please double check for earnings dates for all companies that you own from a reputable source like Zacks.com. We do hold our portfolio stocks through one earnings report, but every EarningsBeats.com member must make his/her own investing/trading decisions about holding stocks into earnings reports as it's the most volatile (risky) time to own a stock.
Portfolio Rules and Objectives
Here are the common traits and objectives of our portfolios:
- There are 10 leading stocks from up to 10 leading industries in each portfolio (at the time of selection). Generally, there will only be one stock per industry group, but there could be exceptions.
- They are typically held for an entire 90-day period, with no stops in place. We strive for consistency, transparency, and simplicity in our portfolios. EB.com members may hold these stocks for the entire 90 days, trade them, use stops, etc., but for purposes of our calculation, we will make no exceptions to our "buy and hold for three months" strategy.
- Every stock will generally be held through ONE earnings report
- The expectation is that relative winners will carry the portfolio to outperformance
- They were all entered into as of the close on Thursday, May 19th (but we held a "re-draft" as of the Tuesday, June 21st close; members may choose to try to time better entries, but EB.com originally "purchased" as of May 19th's closing prices, then as of June 21st closing prices for the re-draft
- Primary objective is to outperform the benchmark S&P 500 over time; quarter-to-quarter performance can be extremely volatile, especially if significant rotation takes place intra-quarter
Here are several considerations for EB members:
- The Income Portfolio should have the least amount of volatility as it will typically be comprised of quality large cap stocks with solid dividends
- The Model, Aggressive, Strong AD, and Earnings Reactions Portfolios should be viewed similar to aggressive growth funds; they will typically have a lot of volatility
- The Strong AD portfolio will be selected from a combination of rising accumulation/distribution lines and SCTRs above 70 at the time of selection. The Earnings Reactions portfolio is based on strong accumulation the day after its quarterly earnings are released and solid relative strength (vs. its peers). These are the only two portfolios that do NOT require revenue and EPS beats in their most recent quarterly earnings reports
- The Income portfolio stocks will all pay dividends, with the expected average dividend yield to be at least 1.0%
- Drawdowns (losses) should be much milder on the Income portfolio, with more volatility expected on the other four; please review inception-to-date charts below to gain an idea of the volatility associated with each
- I believe the larger drawdown on the Income portfolio at the beginning of the pandemic was an anomaly, occurring as many defensive, higher-yielding companies uncharacteristically underperformed during a market decline.
- Large drawdowns in the February through May 2021 and the November 2021 to February 2022 periods were due to the rapid rotation from growth stocks to value stocks; each quarter, our portfolios are based on themes and there is never a guarantee that our analysis and beliefs will be proven correct
- Consider owning or trading these stocks in whatever manner is most comfortable for you; while we will buy all 10 stocks in the manner identified above, feel free to trade certain stocks or wait for pullbacks if the stocks are overbought
- We have no idea what risk each member is willing or able to take. We are not registered investment advisors so be sure you understand the risk you take. Please consult your financial advisor.
- EarningsBeats.com shareholders/employees may own all or some of the portfolio stocks from time to time.
Weekly Snapshot
Here's a weekly recap:
Weekly Summary
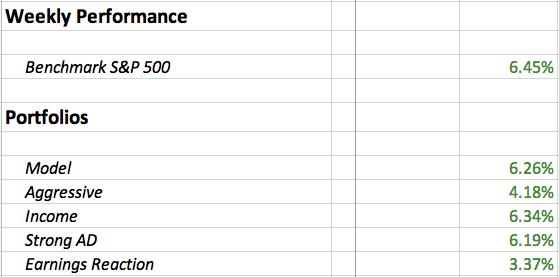
Benchmark S&P 500:
U.S. equities had a HUGE relief rally last week, ignited by the 5-day moving average of the equity only put call ratio finally reaching .80 - a serious level of bearish sentiment that can mark key market bottoms. This is a very important piece of the market puzzle as resetting sentiment from bullish to bearish was one of the top priorities during this cyclical bear market. That's now been accomplished.
Here's a quick look at sector leadership last week:
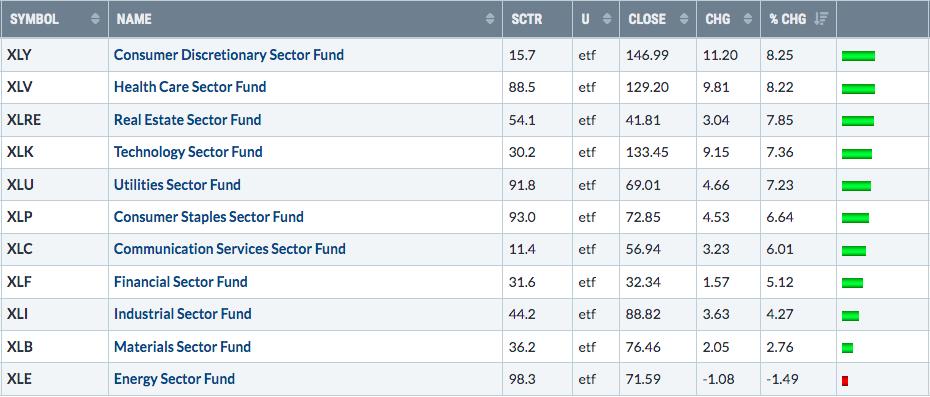
Money rotated significantly away from both energy (XLE) and materials (XLB). Also, it looks to me as if the relative strength in utilities (XLU) has ended. Here's a look at a 10-year weekly chart of the XLU:$SPX:
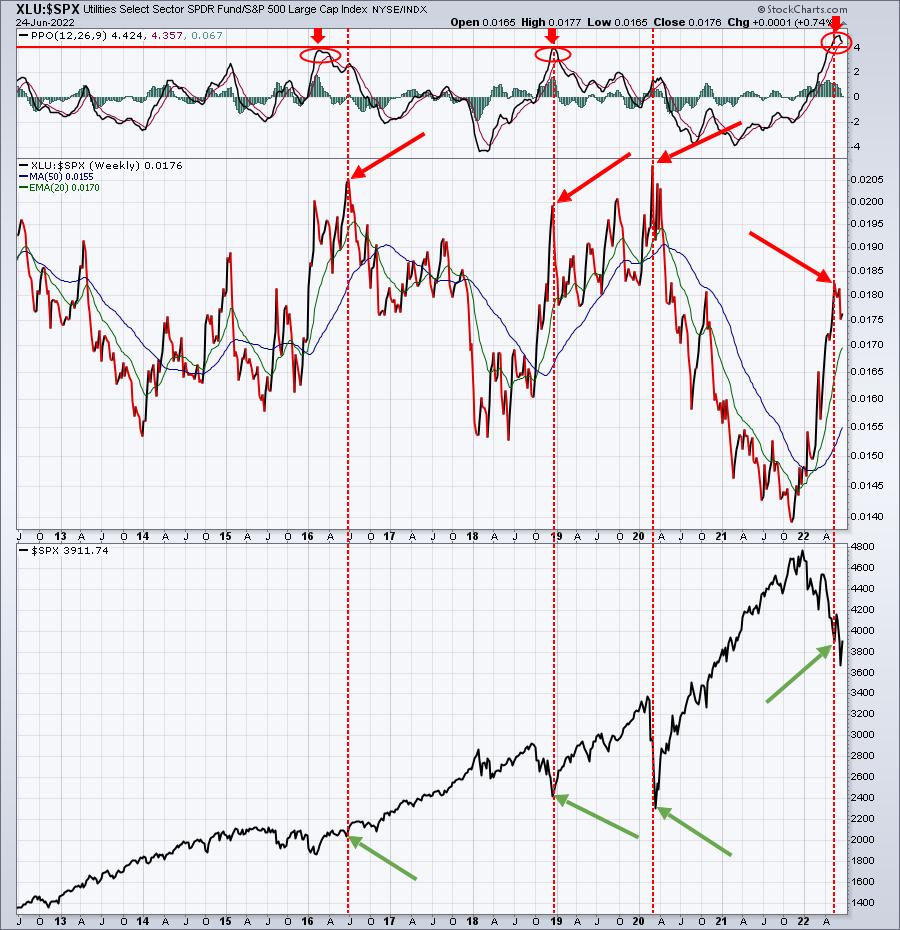
Historically, when the relative strength in utilities rolls over, we should expect very bullish behavior in the S&P 500. The relative PPO on the XLU:$SPX was at its 10-year high recently, and it certainly looks as if it's rolling over to me. This is just one more signal that suggests we have much further upside ahead - eventually.
Model Portfolio:
The Model Portfolio surged 6.26% last week, barely underperforming the S&P 500. Here's the updated inception-to-date chart of the portfolio:
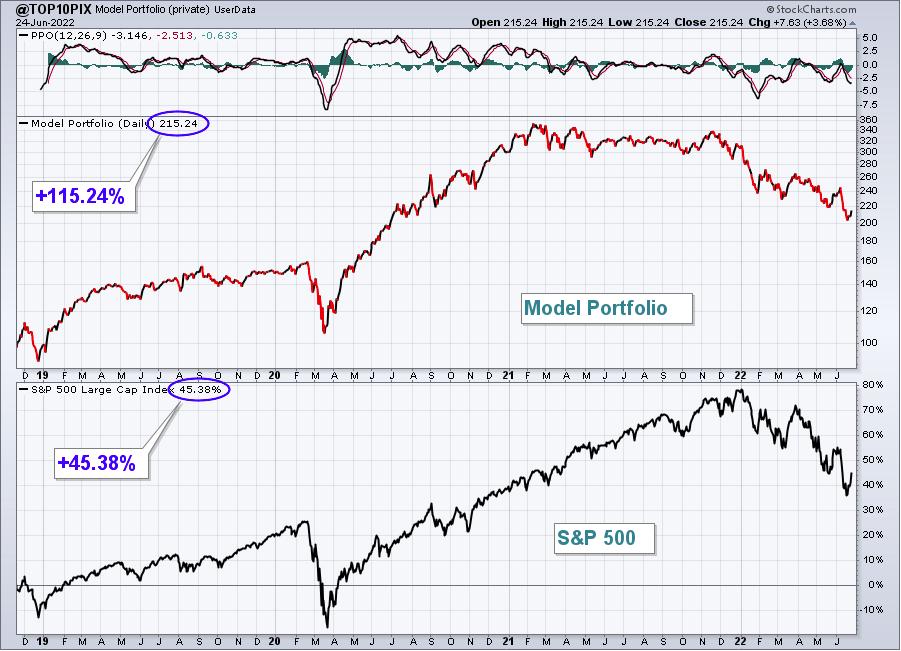
Here are how the Model portfolio component stocks performed last week:
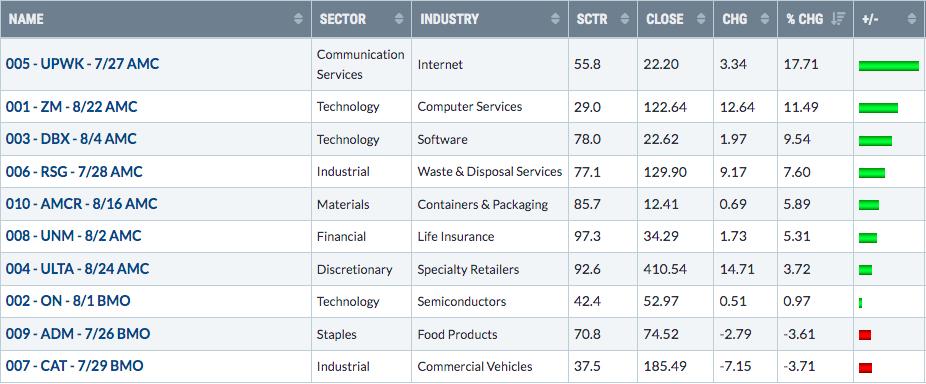
Aggressive Portfolio:
The Aggressive Portfolio rose 4.18% last week, underperforming the S&P 500. Here's the updated inception-to-date chart of the portfolio:
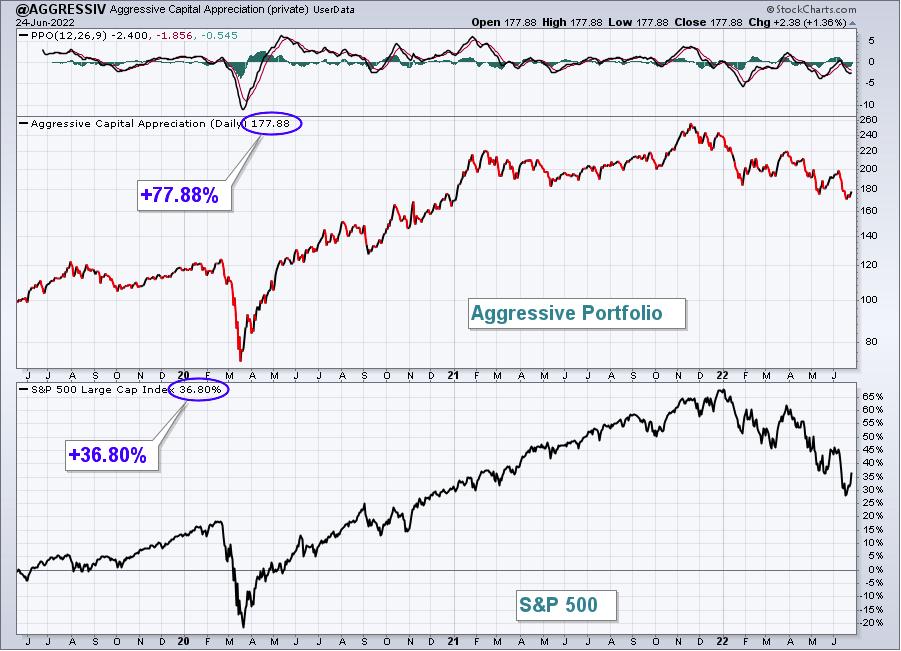
Here are how the Aggressive portfolio component stocks performed last week:
Income Portfolio:
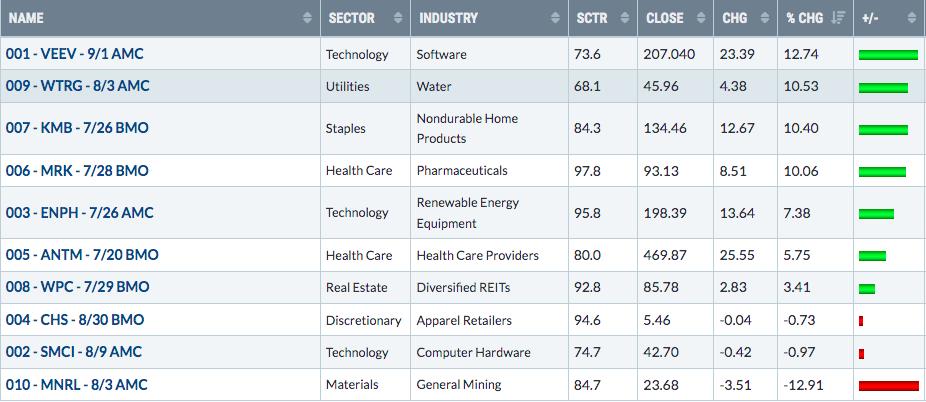
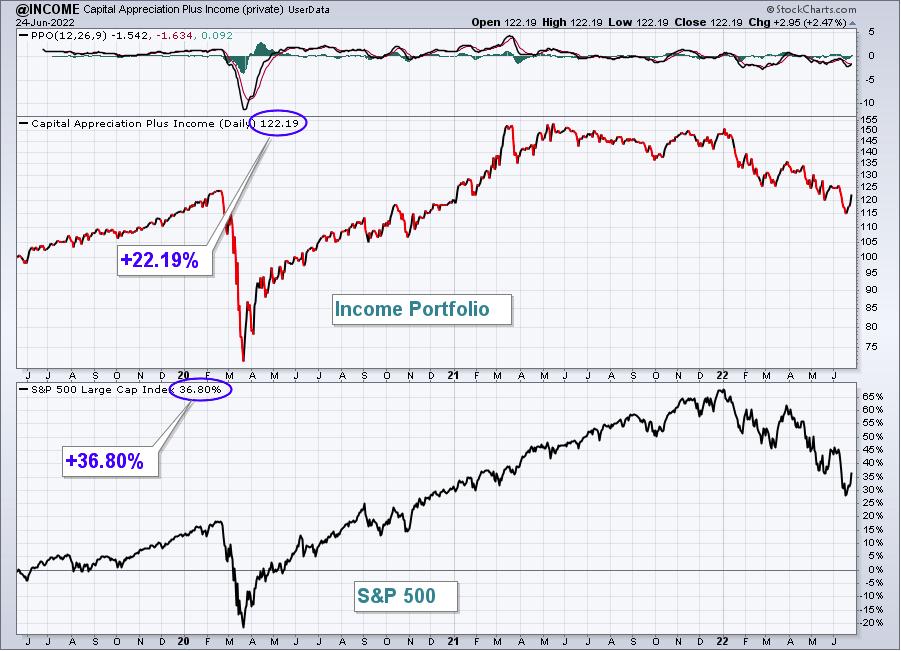
The Income Portfolio jumped 6.34% last week, slightly underperforming the S&P 500.
Here's the updated inception-to-date chart of the portfolio:
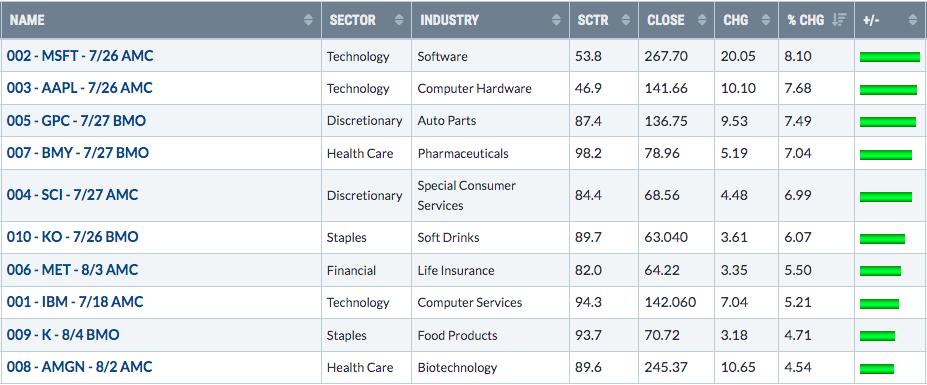
Here are how the Income portfolio component stocks performed last week:
Strong AD Portfolio:
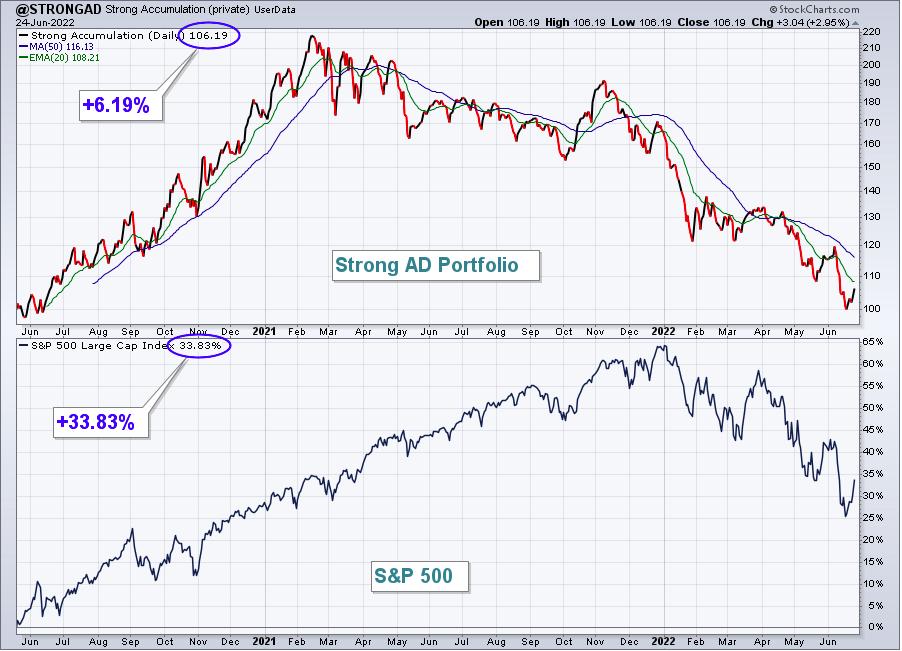
The Strong AD Portfolio spiked 6.19% last week, slightly underperforming the S&P 500. Here's the updated inception-to-date chart of the portfolio:
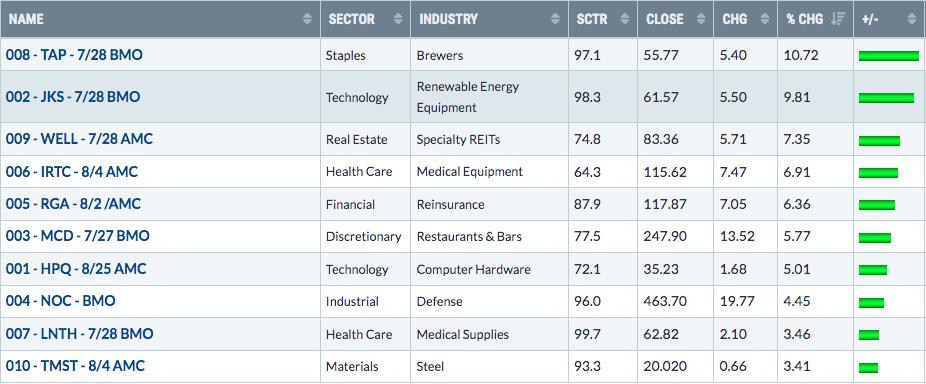
Here are how the Strong AD portfolio component stocks performed last week:
Earnings Reaction Portfolio:
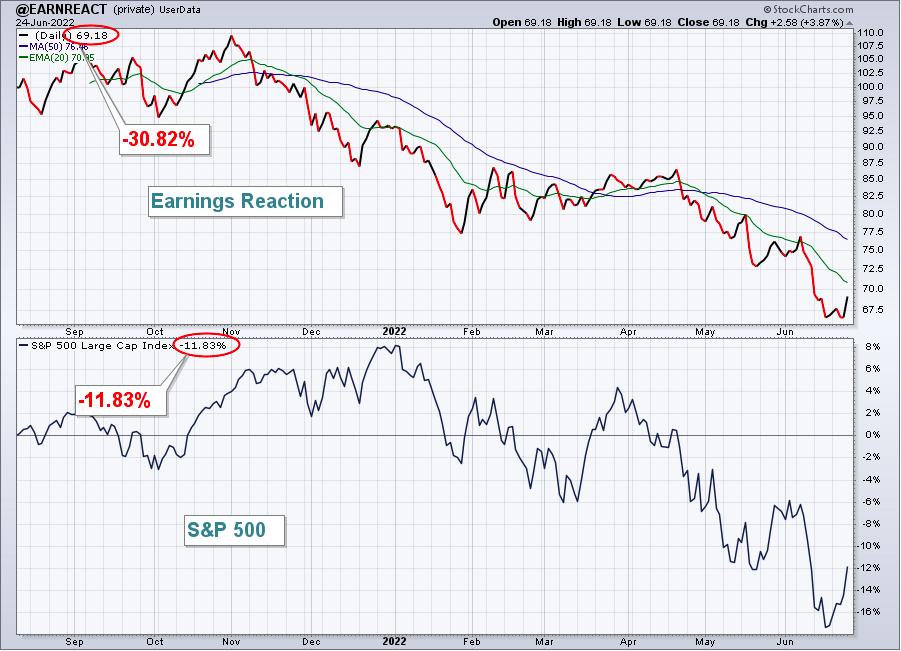
The Earnings Reaction Portfolio gained 3.37% last week, underperforming the S&P 500. Here's the updated inception-to-date chart of the portfolio:
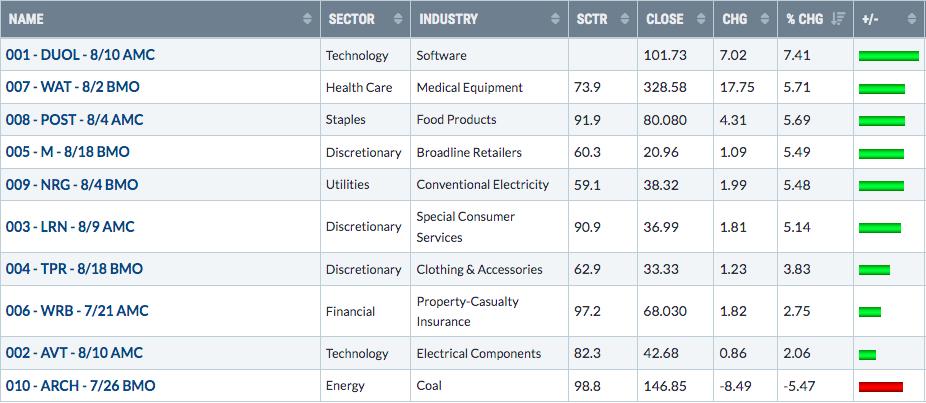
Here are how the Earnings Reaction portfolio component stocks performed last week:
The Week Ahead
My bottom call certainly looks much more plausible after last week's big rally. But don't kid yourself. There is still a lot of work to be done. While anything is possible, I do not expect that we're going to go back up in a straight line. Even if the bottom truly has been set, there will be plenty of pullbacks and trading opportunities. The primary change now is that I believe we're in an environment where we can begin to think about buying pullbacks rather than shorting rallies. First, let's continue to watch key sustainability ratios. This is a chart that I featured last week and is worth reviewing again:
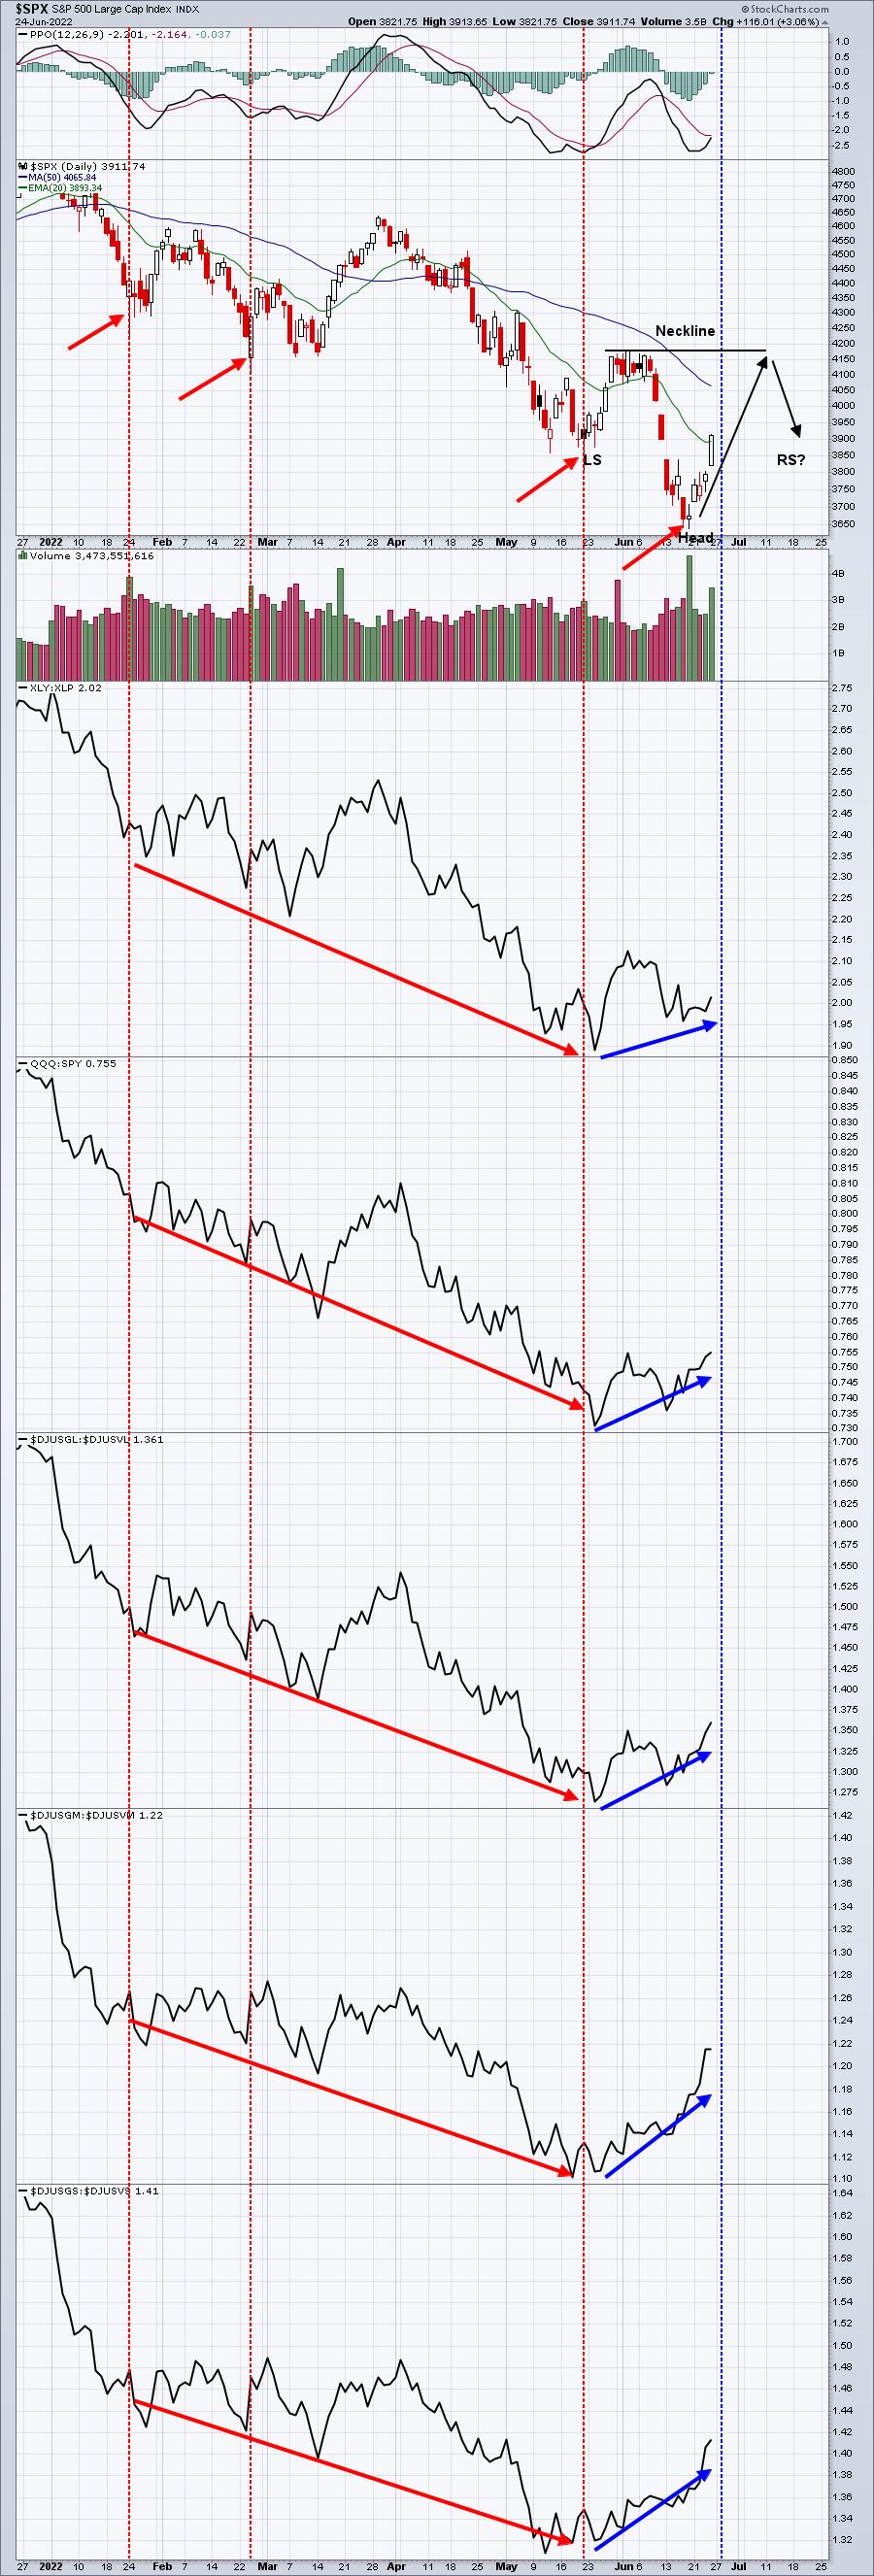
Are we moving back up to challenge that 4180 level to establish what could be the right side of a bottoming head & shoulders neckline? It's possible. We've seen moves back above the 20-day EMA before in 2022, so there'd be no reason to get overly excited about that.......except that it's now occurring after we've received bottoming signals. So I pay much more attention to these technical moves.
The NASDAQ gapped up and out of an island cluster, which is a very bullish candlestick pattern:
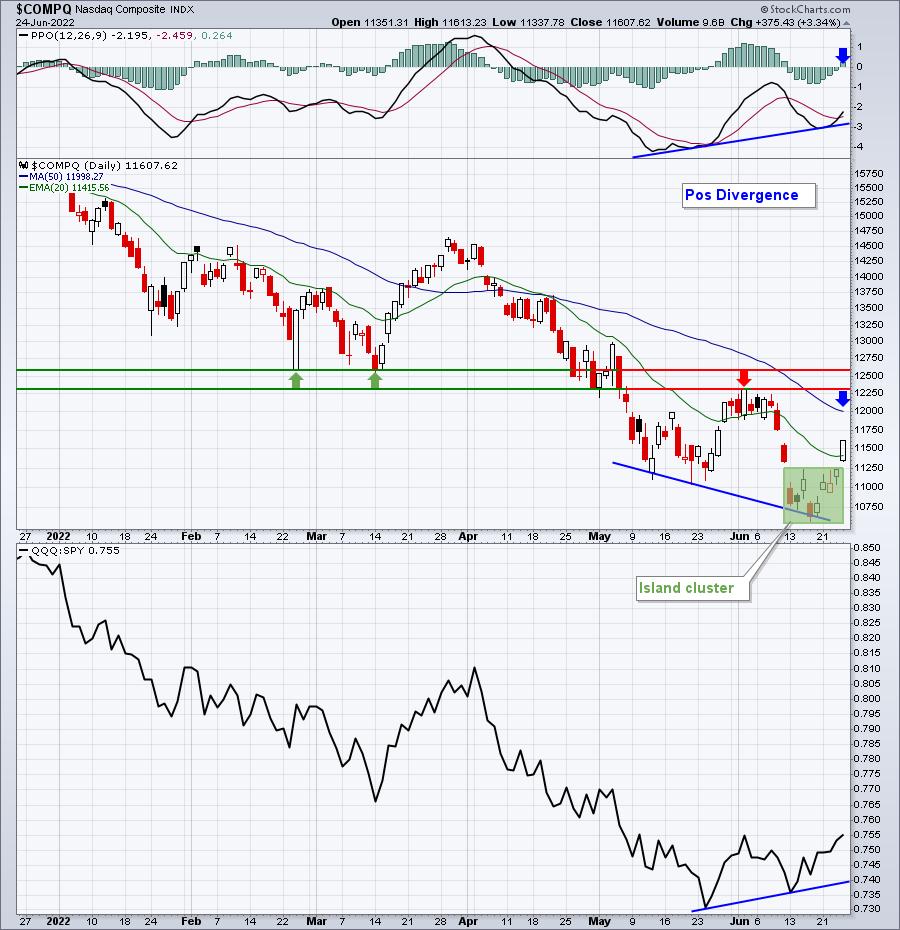
There's lots to like on this chart. The blue arrows mark key potential resistance levels after a positive divergence prints. But that bottom panel highlights a more important positive divergence - one in which money rotates from the S&P 500 to the NASDAQ 100 as prices move lower on the benchmark. This type of positive rotation towards growth has marked key market bottoms in the past, so we MUST at least recognize that Wall Street is repositioning into higher growth areas. The opposite was a key signal in marking the top, remember? The final move higher in December 2021 and into early January 2022 was led by defensive sectors and value stocks. That was a huge warning sign and history now tells us that signal was worth paying attention to. Ignore the current rotation at your own risk.
I'm being asked what would need to happen for me to think this was a false move higher. Follow the charts, that's always my response. If we're truly going lower, then we should see the sustainability ratios all turn lower in a big way and establish NEW LOWS vs. the lows we saw in April/May.
Model ETF Portfolio
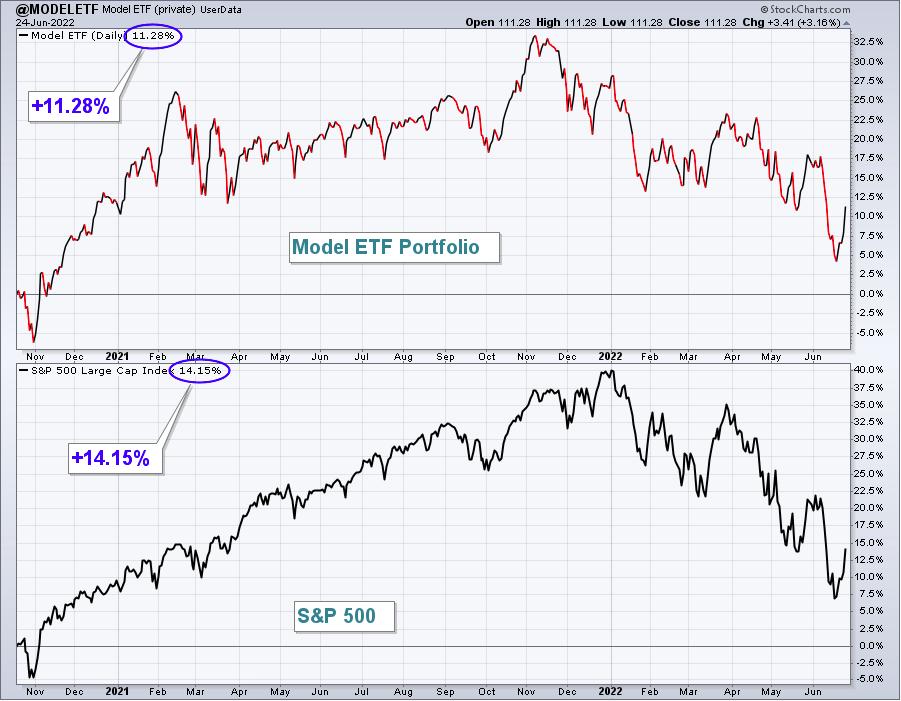
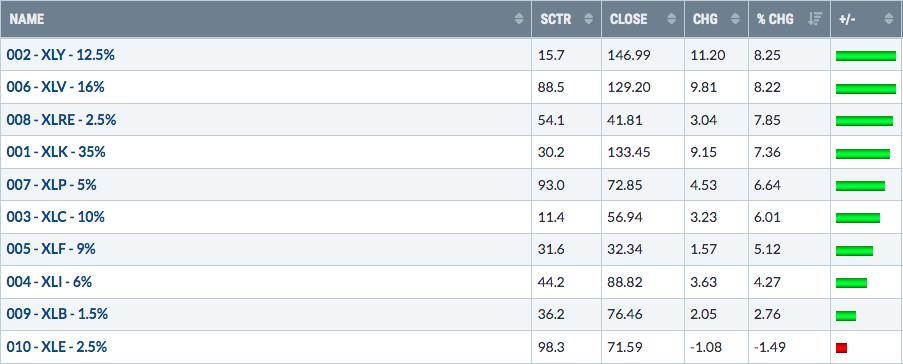
Our Model ETF Portfolio jumped 6.75% last week, outperforming the S&P 500.
Here's the updated inception-to-date chart of the Model ETF Portfolio:
Here are how the Model ETF Portfolio component ETFs performed last week:
Happy trading!
Tom Bowley, Chief Market Strategist
EarningsBeats.com
"Better timing. Better trades."