
EB Weekly Portfolio Report - Sunday, July 3, 2022
Upcoming Earnings Reports
According to Zacks.com, the following companies will be reporting earnings this week and each is a component of one of our portfolios:
Monday, July 4: None - Market Closed
Tuesday, July 5: None
Wednesday, July 6: None
Thursday, July 7: None
Friday, July 8: None
PLEASE NOTE: The above companies were provided using earnings dates provided by StockCharts.com. My research is limited to what StockCharts.com provides and I also can make a mistake from time to time, so please double check for earnings dates for all companies that you own from a reputable source like Zacks.com. We do hold our portfolio stocks through one earnings report, but every EarningsBeats.com member must make his/her own investing/trading decisions about holding stocks into earnings reports as it's the most volatile (risky) time to own a stock.
Portfolio Rules and Objectives
Here are the common traits and objectives of our portfolios:
- There are 10 leading stocks from up to 10 leading industries in each portfolio (at the time of selection). Generally, there will only be one stock per industry group, but there could be exceptions.
- They are typically held for an entire 90-day period, with no stops in place. We strive for consistency, transparency, and simplicity in our portfolios. EB.com members may hold these stocks for the entire 90 days, trade them, use stops, etc., but for purposes of our calculation, we will make no exceptions to our "buy and hold for three months" strategy.
- Every stock will generally be held through ONE earnings report
- The expectation is that relative winners will carry the portfolio to outperformance
- They were all entered into as of the close on Thursday, May 19th (but we held a "re-draft" as of the Tuesday, June 21st close; members may choose to try to time better entries, but EB.com originally "purchased" as of May 19th's closing prices, then as of June 21st closing prices for the re-draft
- Primary objective is to outperform the benchmark S&P 500 over time; quarter-to-quarter performance can be extremely volatile, especially if significant rotation takes place intra-quarter
Here are several considerations for EB members:
- The Income Portfolio should have the least amount of volatility as it will typically be comprised of quality large cap stocks with solid dividends
- The Model, Aggressive, Strong AD, and Earnings Reactions Portfolios should be viewed similar to aggressive growth funds; they will typically have a lot of volatility
- The Strong AD portfolio will be selected from a combination of rising accumulation/distribution lines and SCTRs above 70 at the time of selection. The Earnings Reactions portfolio is based on strong accumulation the day after its quarterly earnings are released and solid relative strength (vs. its peers). These are the only two portfolios that do NOT require revenue and EPS beats in their most recent quarterly earnings reports
- The Income portfolio stocks will all pay dividends, with the expected average dividend yield to be at least 1.0%
- Drawdowns (losses) should be much milder on the Income portfolio, with more volatility expected on the other four; please review inception-to-date charts below to gain an idea of the volatility associated with each
- I believe the larger drawdown on the Income portfolio at the beginning of the pandemic was an anomaly, occurring as many defensive, higher-yielding companies uncharacteristically underperformed during a market decline.
- Large drawdowns in the February through May 2021 and the November 2021 to February 2022 periods were due to the rapid rotation from growth stocks to value stocks; each quarter, our portfolios are based on themes and there is never a guarantee that our analysis and beliefs will be proven correct
- Consider owning or trading these stocks in whatever manner is most comfortable for you; while we will buy all 10 stocks in the manner identified above, feel free to trade certain stocks or wait for pullbacks if the stocks are overbought
- We have no idea what risk each member is willing or able to take. We are not registered investment advisors so be sure you understand the risk you take. Please consult your financial advisor.
- EarningsBeats.com shareholders/employees may own all or some of the portfolio stocks from time to time.
Weekly Snapshot
Here's a weekly recap:
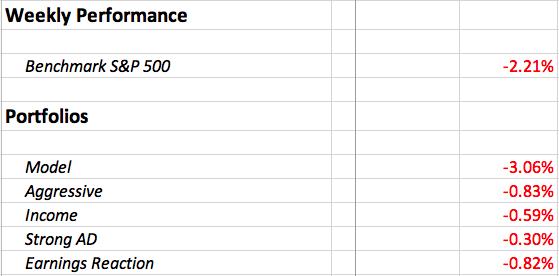
Weekly Summary
Benchmark S&P 500:
U.S. equities fell last week, but it wasn't nearly as bad as it might have felt. While the selling and distribution was clear on Tuesday as the S&P 500 fell back beneath its 20-day EMA, the other four days really weren't bad at all. The heaviest volume came on Thursday, the same day that we saw a sizable rally off the early-morning, intraday low. Friday's action was quite similar with selling in the early morning, followed by a significant advance later in the day. I always like to see afternoon buying as it paints a very bullish short-term picture.
I've already discussed my bullish long-term picture with the 100-year chart that I reference from time to time. In mid June, I called what I believe is the cyclical bear market bottom as Wall Street finally began rotation into more aggressive areas of the market. Sentiment also is playing a significant factor in my bottom call as the 5-day moving average of the equity only put call ratio ($CPCE) touched .80, which has marked key price lows in the past. Also, last week, the Volatility Index ($VIX) was falling, while the S&P 500 also fell. This is extremely odd and also occurred in the waning stage of the 2007-2009 bear market. Check out this 15-year weekly chart of the S&P 500 with the VIX and the SPX:VIX correlation in the panels beneath it:
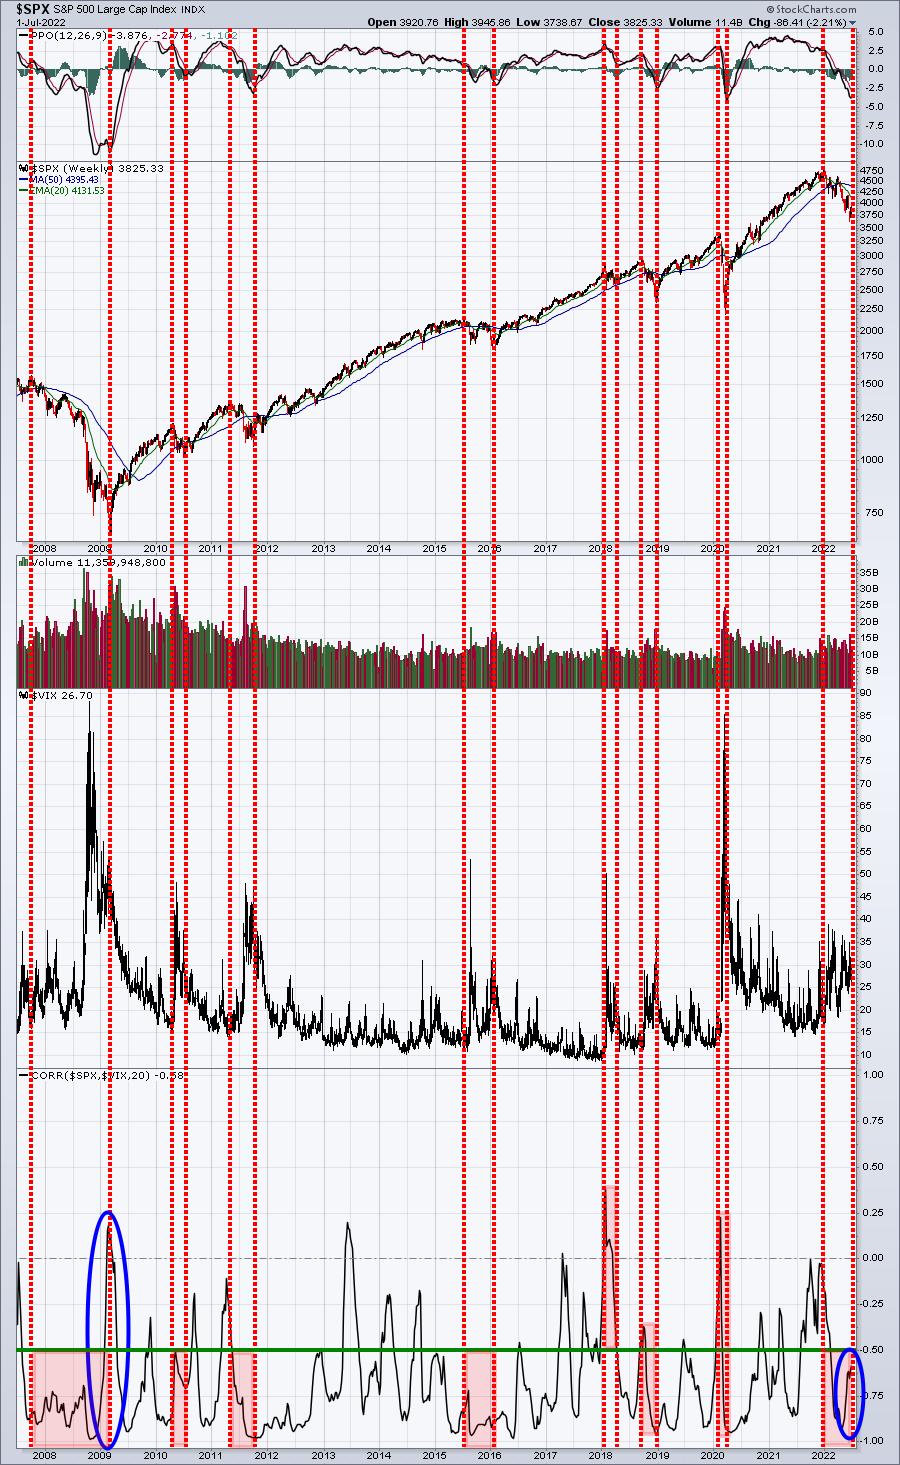
The vertical red-dotted lines highlight the key tops and bottoms of key market selloffs over the past 15 years. I've circled two in blue in the bottom panel. The first was in 2009 where the S&P 500 and the VIX both were moving lower as that bear market came to an end. That resulted in the correlation moving HIGHER, which is what I've circled. We're seeing the same thing developing right now in 2022. The past few selloffs have had the tendency to see the VIX fall as well. In other words, fear is declining while the S&P 500 falls. If fear is lost, the selling will end.
This could change, but I find this setup very bullish and it supports my theory that a bottom is in.
Model Portfolio:
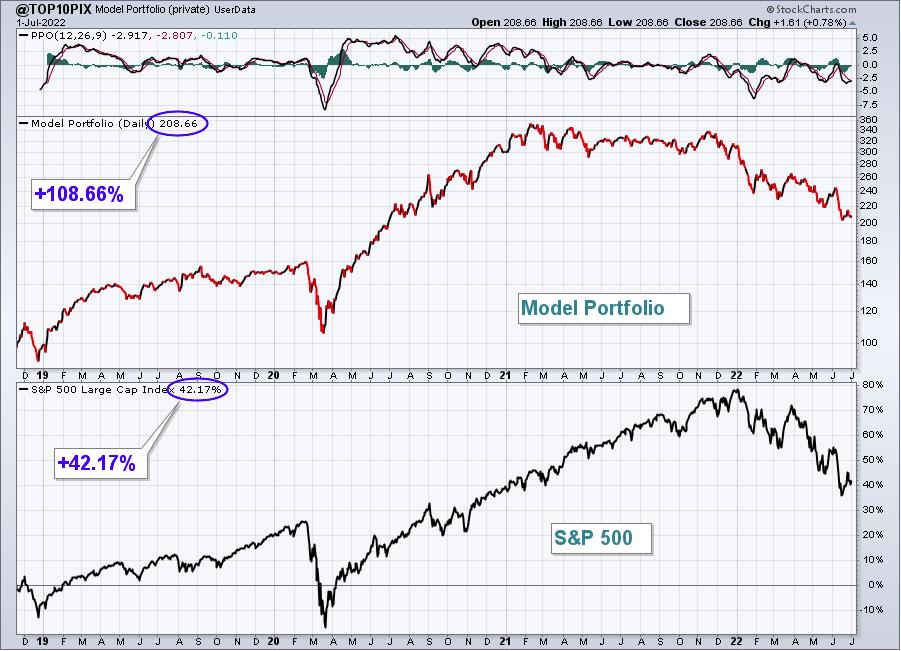
The Model Portfolio dropped 3.06% last week, underperforming the S&P 500. Here's the updated inception-to-date chart of the portfolio:
Here are how the Model portfolio component stocks performed last week:
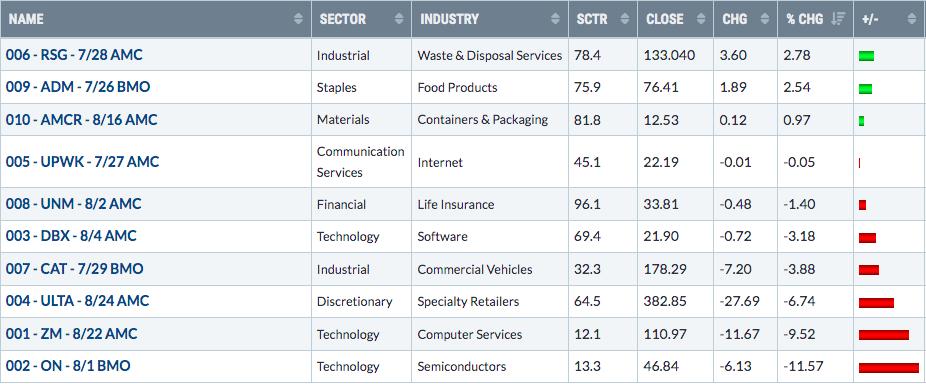
ON still remains a fairly solid relative performer within the semiconductor space, having hit a new 52-week relative high less than one month ago. But the group, as a whole, has been horrific and that's weighing on ON:
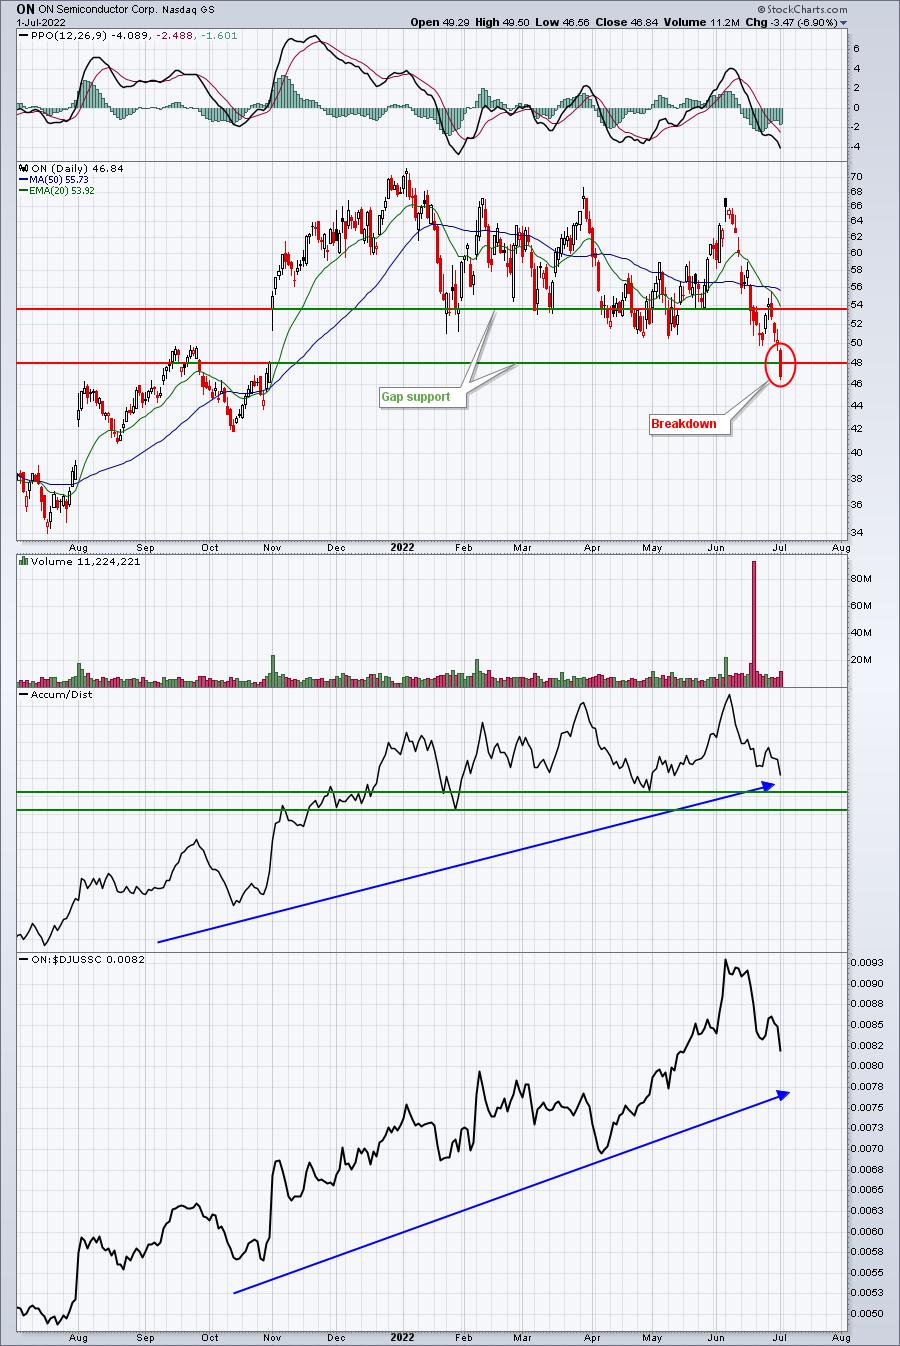
ON could use a reversing candle and strength from its semiconductor industry ($DJUSSC).
Aggressive Portfolio:
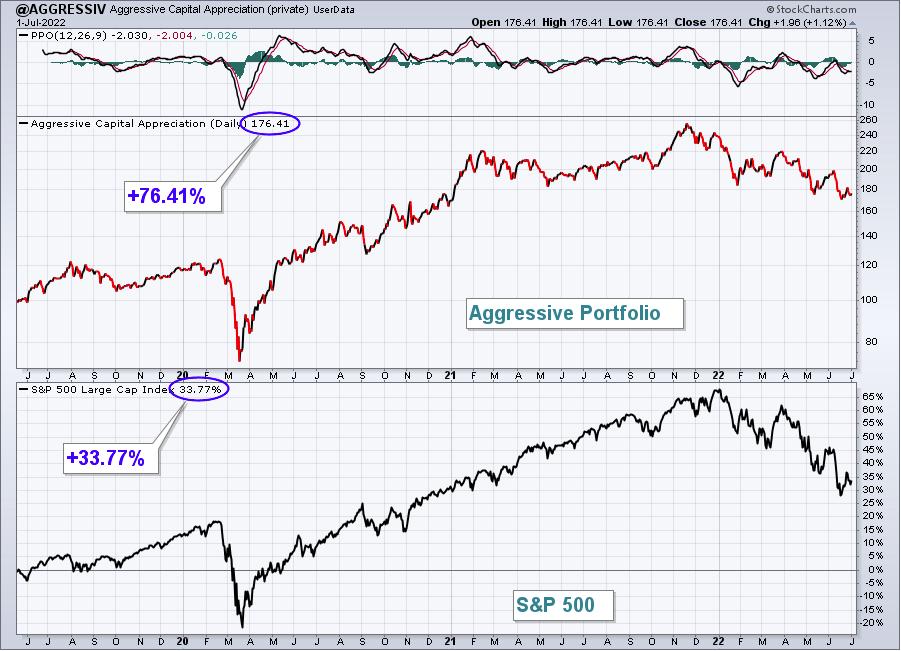
The Aggressive Portfolio fell 0.83% last week, outperforming the S&P 500. Here's the updated inception-to-date chart of the portfolio:
Here are how the Aggressive portfolio component stocks performed last week:
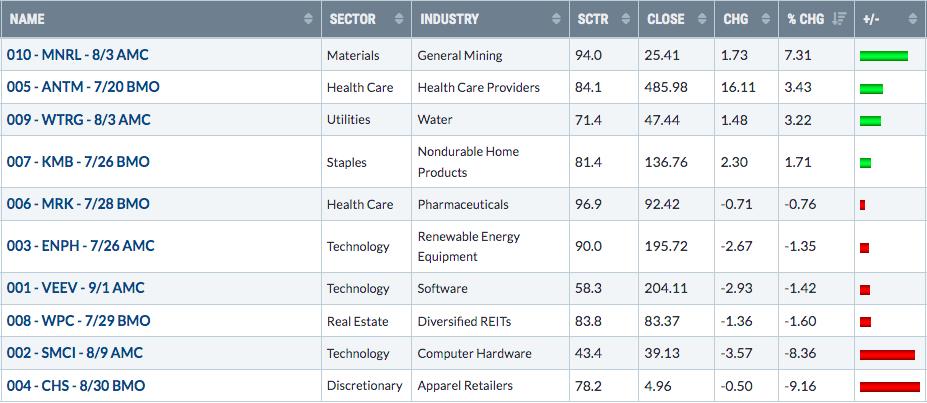
MNRL does bother me technically, despite being the best performer last week in this portfolio:
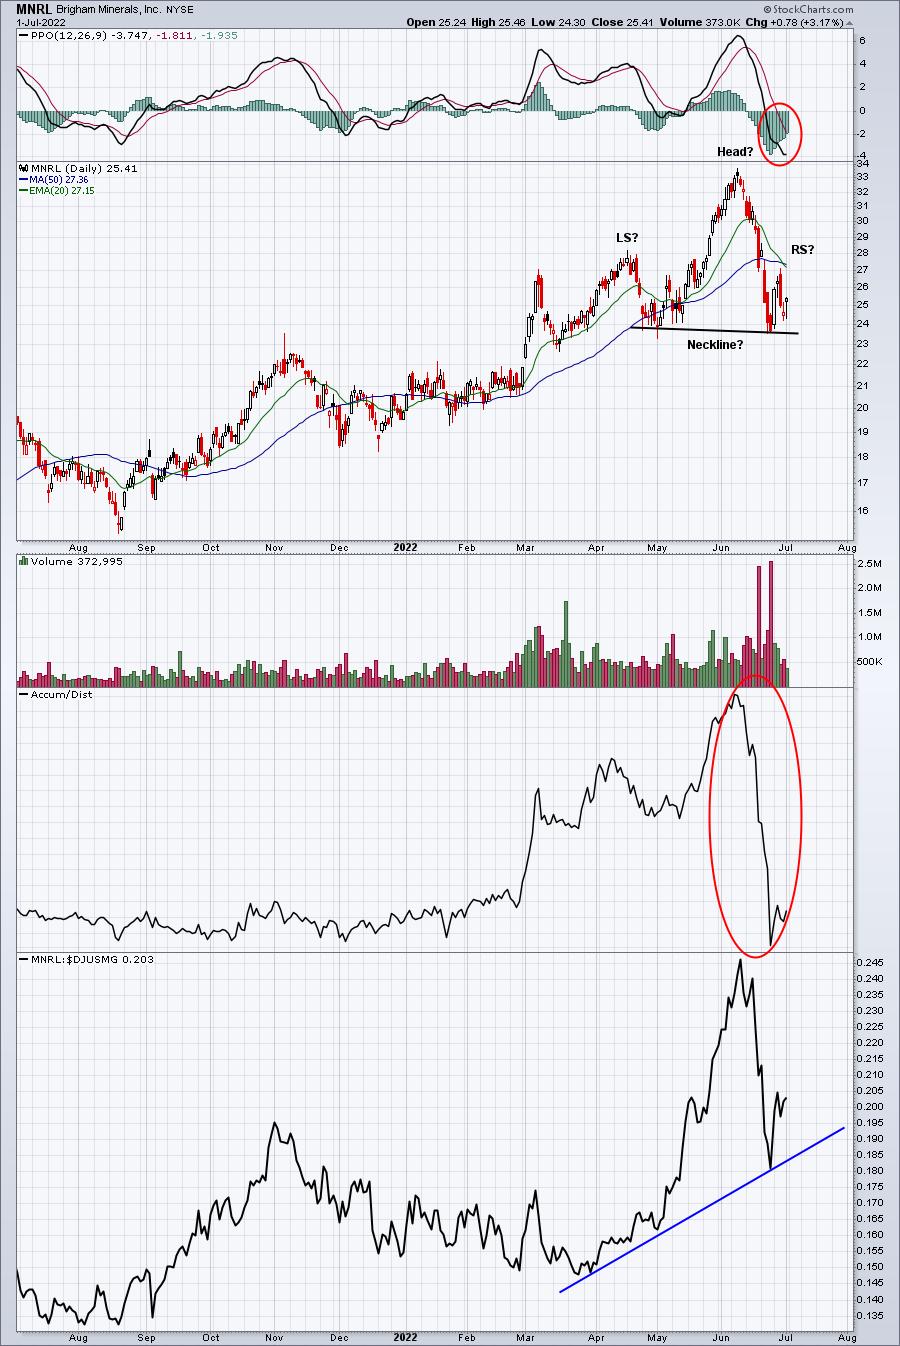
We hold our portfolio stocks through a 90-day period (with our recent rotational changes a one-time event) and do not use stops. However, I always encourage our members to do whatever is most appropriate in your own personal situation. If I'm looking at MNRL objectively, I see a neckline at roughly 23.50 that I do not want to see violated on a closing basis. MNRL is also a mining stock and those are not typically your best performers if a secular bull market is resuming.
Income Portfolio:
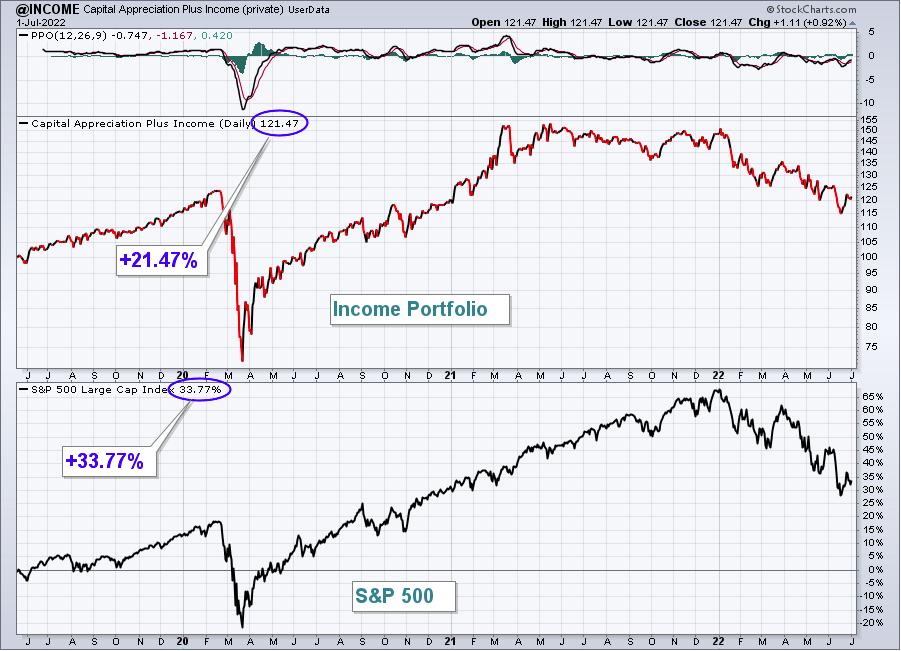
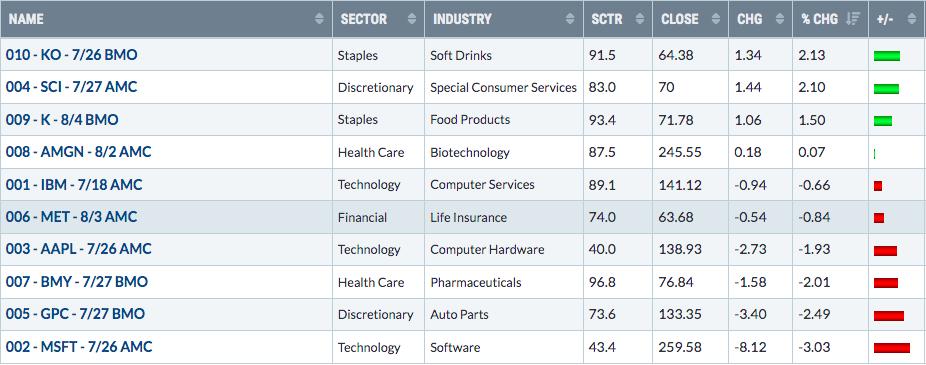
The Income Portfolio lost 0.59% last week, slightly outperforming the S&P 500.
Here's the updated inception-to-date chart of the portfolio:
Here are how the Income portfolio component stocks performed last week:
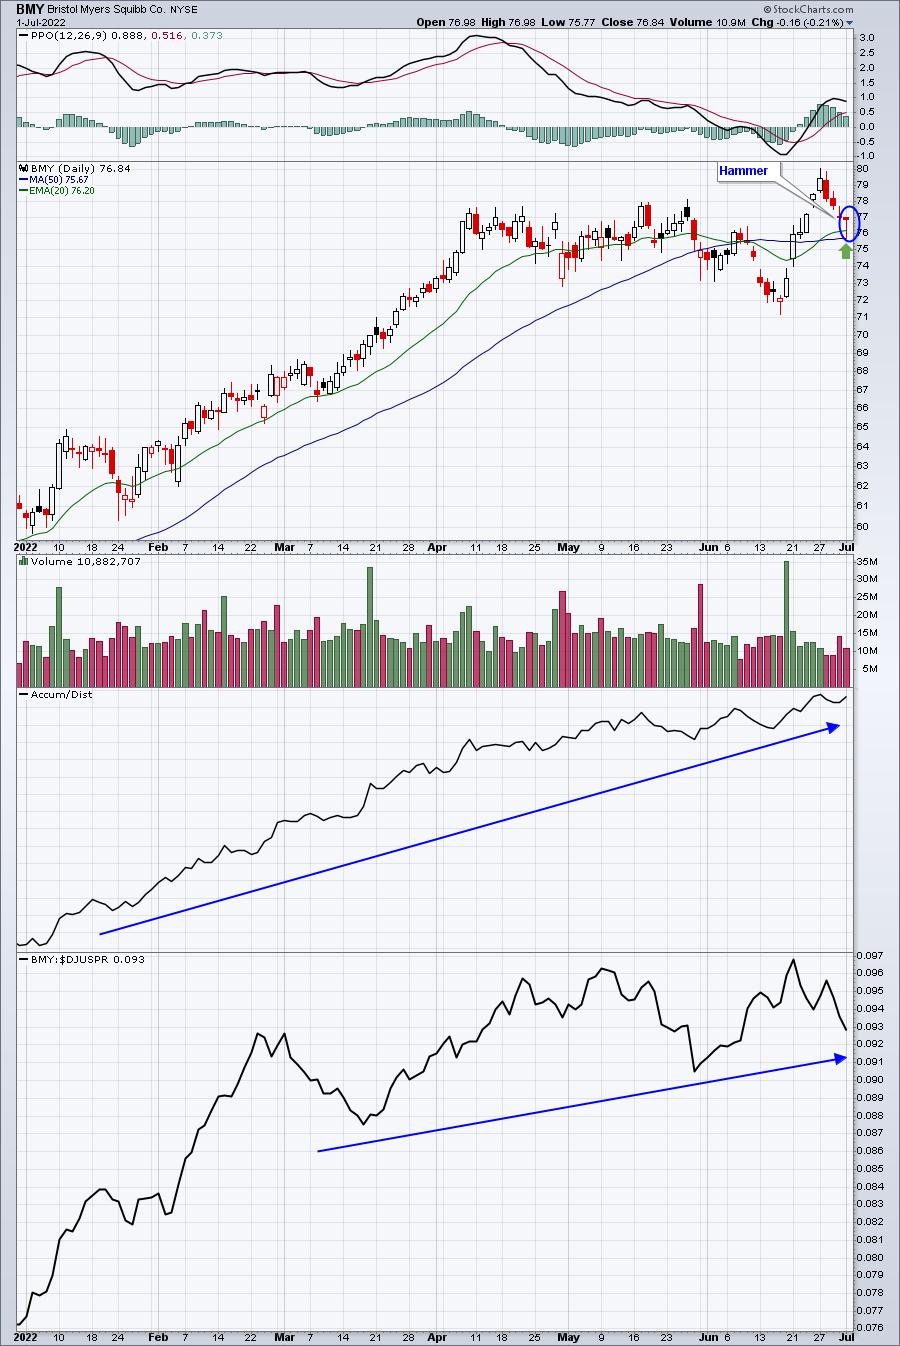
If I'm right about the secular bull market resuming, a 20-day EMA test on BMY could represent a great buying opportunity for any of you that look to short-term trade our portfolio stocks:
Strong AD Portfolio:
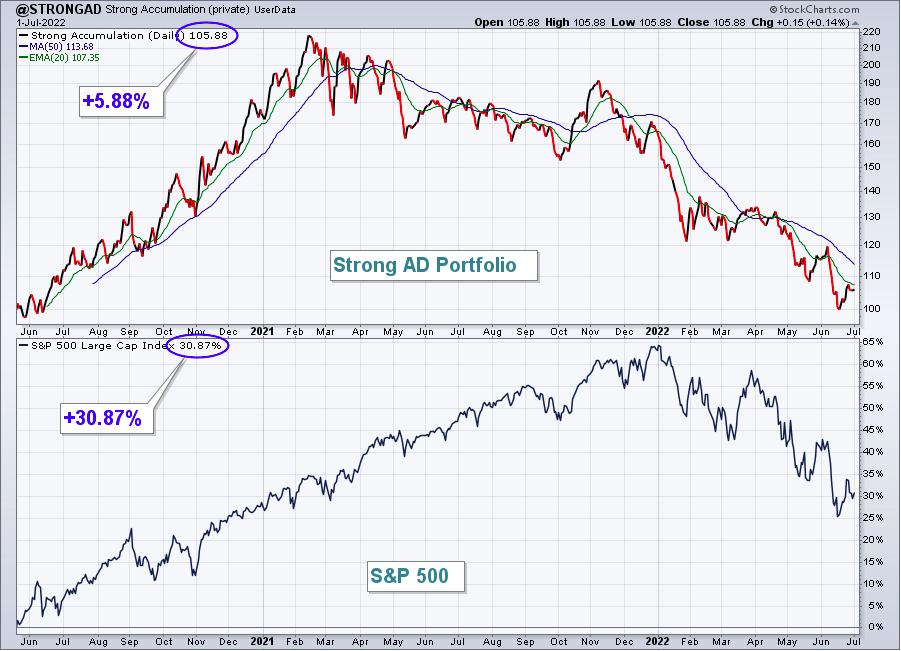
The Strong AD Portfolio fell 0.30% last week, slightly outperforming the S&P 500. Here's the updated inception-to-date chart of the portfolio:
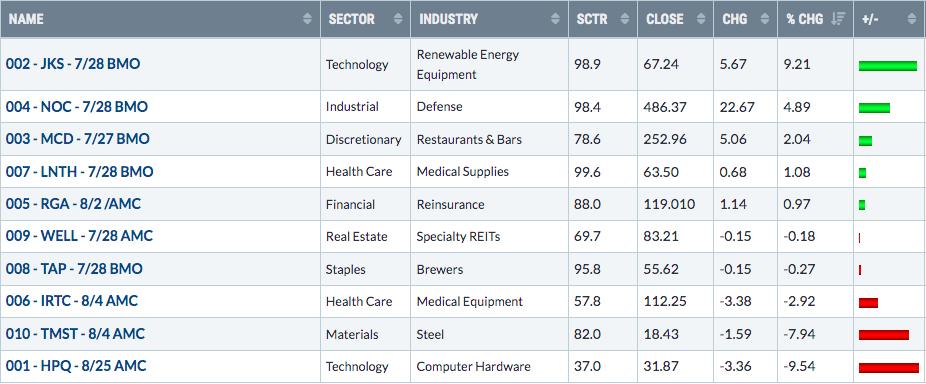
Here are how the Strong AD portfolio component stocks performed last week:
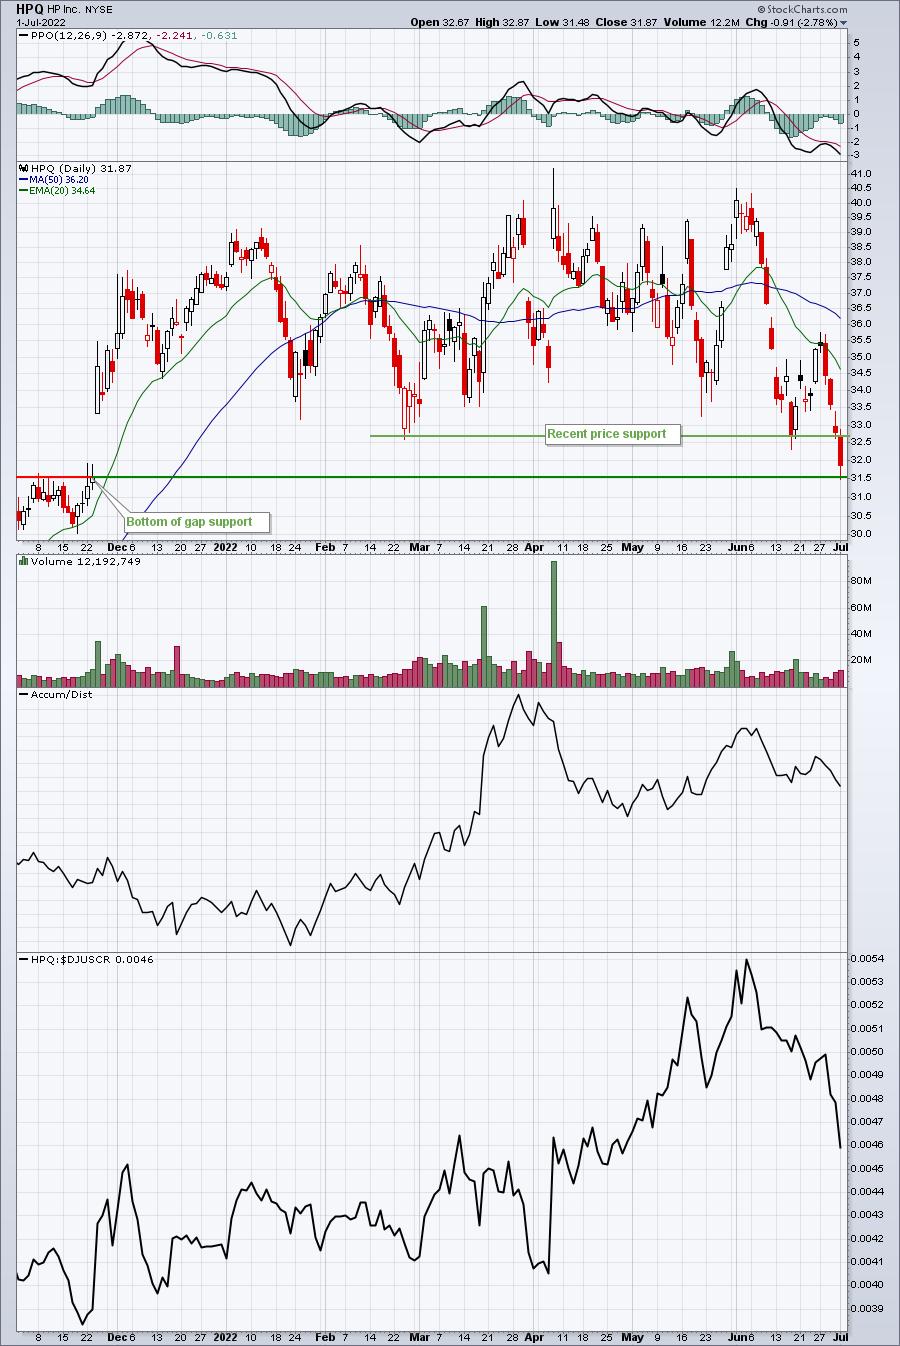
HPQ was last week's worst performer and it appeared to break down beneath key price support at 33. However, this could be its final drop to test the bottom of gap support established in November 2022:
Earnings Reaction Portfolio:
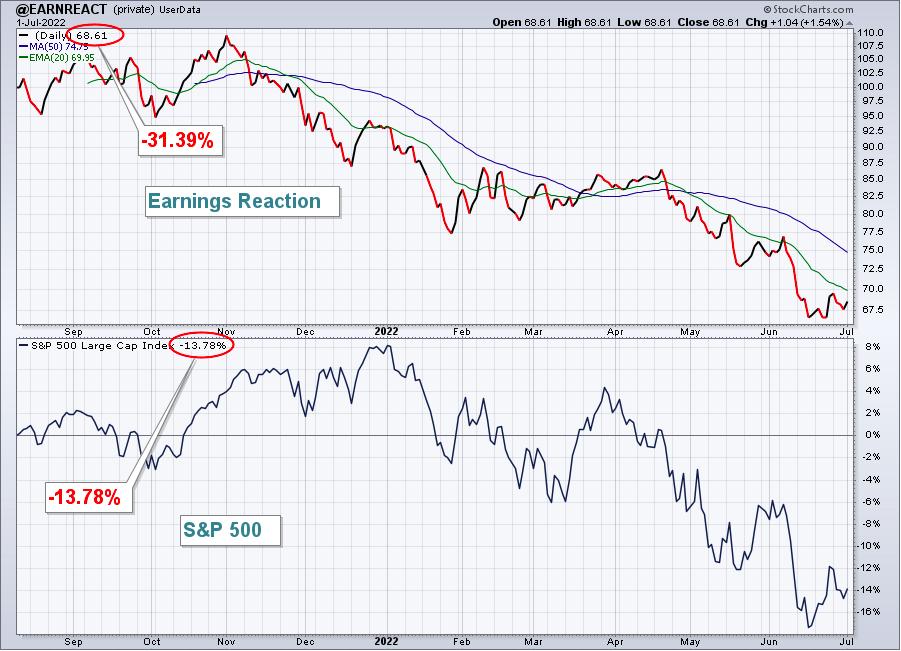
The Earnings Reaction Portfolio dropped 0.82% last week, outperforming the S&P 500. Here's the updated inception-to-date chart of the portfolio:
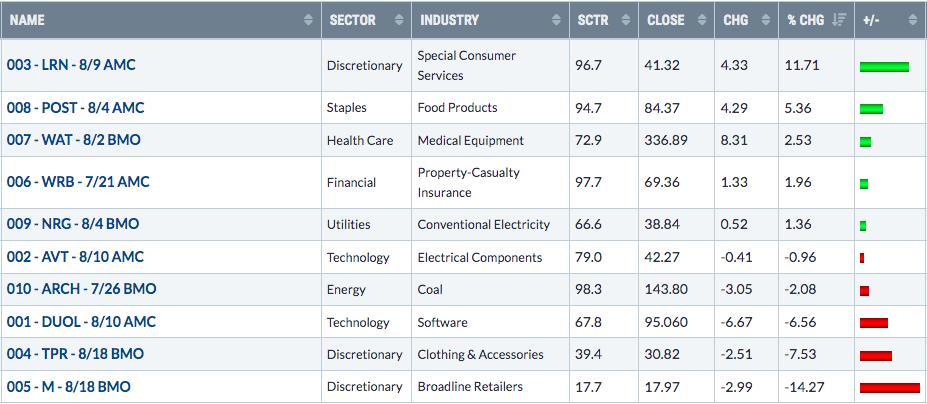
Here are how the Earnings Reaction portfolio component stocks performed last week:
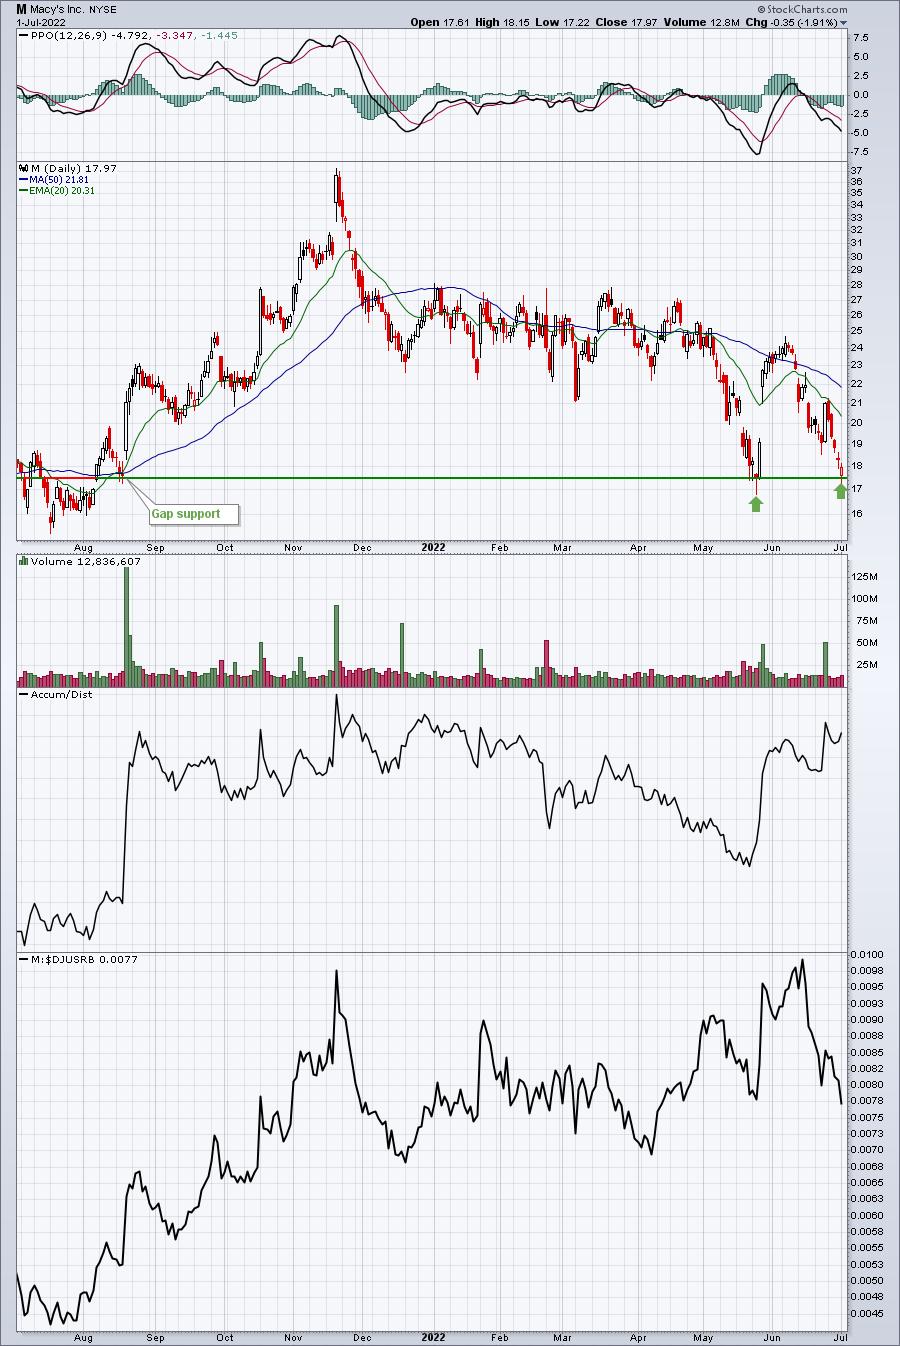
M had an abysmal week, but it's returned to a very critical gap and price support level:
The Week Ahead
I believe the stock market's attention is firmly switching from the inflation story to the recession story. That's very good news for the stock market and I'll give you a little analogy of the difference. If Wall Street is married to the secular bull market story, which I believe it is, inflation could be a deal breaker. A recession might cause an argument, but the marriage will last. Most recessions - and many don't realize this - have occurred during secular bull markets. We've had 11 recessions in the U.S. since 1950 and here they are with either secular bull market or secular bear market in parenthesis:
- July 1953-May 1954 (secular bull market)
- August 1957-April 1958 (secular bull market)
- April 1960-February 1961 (secular bull market)
- December 1969-November 1970 (secular bull market)
- November 1973-March 1975 (secular bear market)
- January 1980-July 1980 (secular bull market)
- July 1981-November 1982 (secular bull market)
- July 1990-March 1991 (secular bull market)
- March 2001-November 2001 (secular bear market)
- December 2007-June 2009 (secular bear market)
- February 2020- April 2020 (secular bull market)
8 of 11 recessions were during secular bull markets. In other words, the S&P 500 went right back to all-time highs shortly after these brief interruptions in economic activity.
Recessions are painful for the economy and lots of jobs can be lost, but the longer-term stock market ramifications can be severely overblown. Most recessions see the S&P 500 bounce back much more quickly than anyone anticipates and I firmly believe that'll be the case with the 2022 recession, which I believe is already underway. It's very difficult to rely solely on the history books, however. We're in the latter stages (hopefully) of the 2020 COVID-related pandemic. There isn't much history about how the stock market will look in the aftermath of a pandemic. We're all literally "flying by the seat of our pants" as we try to determine what lies ahead. So while none of us has a "crystal ball", we can still follow the charts to get a grasp on what Wall Street believes lies ahead. And that is where the charts come in - as opposed to listening to CNBC and other media outlets. Media outlets need clicks and, quite honestly, don't care how everything plays out. But listening to all the bad news over and over and over again helps to program our beliefs about the stock market - sadly.
I try to search for "common sense" answers. I don't want to overcomplicate things. If inflation is our BIG problem, then EVERYONE should be selling bonds and yields should be rising. There is no reason whatsoever to hold onto a 3% 10-year treasury if inflation will persist at 6% or more. You're just throwing money away. So, despite my thinking that this is a cyclical bear market, I did need to at least give consideration to the possibility of future inflationary problems would be difficult to overcome as long as the 10-year treasury yield ($TNX) was climbing rapidly higher. But since my market bottom call, the TNX has fallen from 3.48% to a 2.79% low on Friday. You can probably keep the inflation argument alive if the TNX is simply basing in a range from say 2.70% to 3.50%. If the TNX breaks below 2.70%, though, I believe the inflation argument is DEAD. I already believe it's dead, but that TNX move would be big confirmation, in my view.
I expect we'll see the S&P 500 move higher into earnings season, which will kick off the week after next.
Model ETF Portfolio
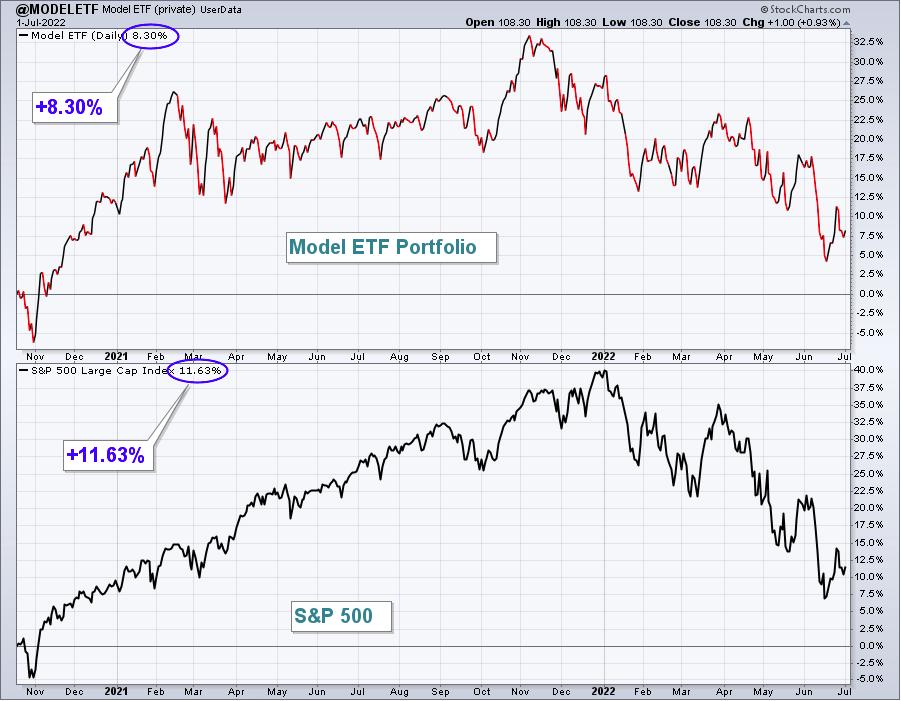
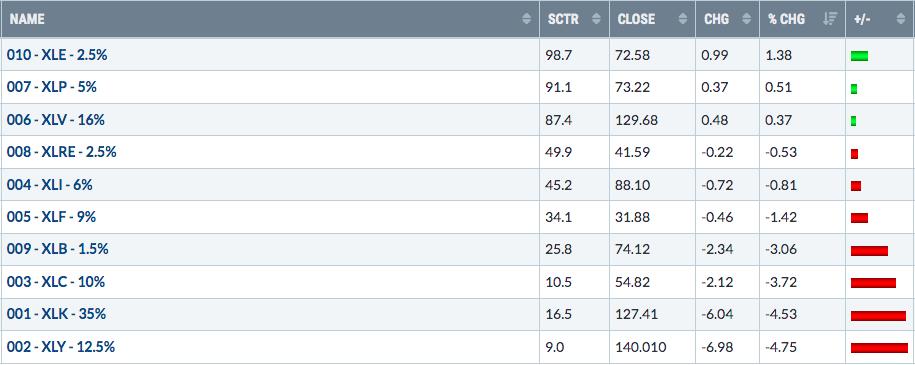
Our Model ETF Portfolio fell 2.68% last week, slightly underperforming the S&P 500.
Here's the updated inception-to-date chart of the Model ETF Portfolio:
Here are how the Model ETF Portfolio component ETFs performed last week:
Happy trading!
Tom Bowley, Chief Market Strategist
EarningsBeats.com
"Better timing. Better trades."