
EB Weekly Portfolio Report - Tuesday, August 23, 2022
New Report Format
We are suspending the Strong AD and Earnings Reaction Portfolios indefinitely, so there is no longer a need to track these two portfolios. I will continue to provide the prior week's recap of Model, Aggressive, and Income portfolios. I did not show the individual stock performance of each portfolio as we now have a new portfolio of 10 equal-weighted stocks in each portfolio as of Friday's close. We will recap weekly performance again with our next EB Weekly Portfolio Report, published this Sunday, August 28th.
Beginning this week, I will provide Model Trades, which is simply outlining possible trades based on key support, resistance, relative strength, and where these trades come from. For instance, my trading strategy for Strong AD ChartList (SADCL) stocks might be completely different than my trading strategy on Strong Earnings ChartList (SECL) stocks. Obviously, it would be different from a Short Squeeze ChartList (SSCL) trading candidate. I'll lay out the annotated chart and my reasoning for the trade. In the following week's EB Weekly Portfolio Report, I'll grade each of the prior week's Model Trades. Feel free to trade these stocks in a similar manner or according to your trading strategy. Or completely ignore them. It's completely up to you as I am not a Registered Investment Advisor (nor is EarningsBeats.com). THESE TRADING CANDIDATES SHOULD NOT BE VIEWED AS INVESTMENT ADVICE.
I view EarningsBeats.com as a market research, market guidance, and market education platform. We do not attempt, in any fashion, to manage anyone's money. We have no idea of the risk tolerance of each of our members, nor do we have any idea of your financial goals and objectives. It would be irresponsible and illegal for us to provide advice to any of our members. Therefore, please consult your own financial advisor before considering any buy/sell decisions. You are completely responsible for the financial decisions that you make.
Upcoming Earnings Reports
According to Zacks.com, the following companies will be reporting earnings this week and each is a component of one of our portfolios:
Monday, August 22: None
Tuesday, August 23: None
Wednesday, August 24: None
Thursday, August 25: None
Friday, August 26: None
PLEASE NOTE: The above companies were provided using Zacks.com. We do hold our portfolio stocks through one earnings report, but every EarningsBeats.com member must make his/her own investing/trading decisions about holding stocks into earnings reports as it's the most volatile (risky) time to own a stock.
Portfolio Rules and Objectives
Here are the common traits and objectives of our portfolios:
- There are 10 leading stocks from up to 10 leading industries in each portfolio (at the time of selection). Generally, there will only be one stock per industry group, but there could be exceptions.
- They are typically held for an entire 90-day period, with no stops in place. We strive for consistency, transparency, and simplicity in our portfolios. EB.com members may hold these stocks for the entire 90 days, trade them, use stops, etc., but for purposes of our calculation, we will make no exceptions to our "buy and hold for three months" strategy.
- Every stock will generally be held through ONE earnings report
- The expectation is that relative winners will carry the portfolio to outperformance
- They were all entered into as of the close on Friday, August 19th
- Primary objective is to outperform the benchmark S&P 500 over time; quarter-to-quarter performance can be extremely volatile, especially if significant rotation takes place intra-quarter
Here are several considerations for EB members:
- The Income Portfolio should have the least amount of volatility as it will typically be comprised of quality large cap stocks with solid dividends
- The Model and Aggressive Portfolios should be viewed similar to aggressive growth funds; they will typically have a lot of volatility and periodic drawdowns can be significant from time to time
- The Income portfolio stocks will all pay dividends, with the expected average dividend yield to be at least 1.0%
- Drawdowns (losses) should be much milder on the Income portfolio, with more volatility expected on the other two; please review inception-to-date charts below to gain an idea of the volatility associated with each
- I believe the larger drawdown on the Income portfolio at the beginning of the pandemic was an anomaly, occurring as many defensive, higher-yielding companies uncharacteristically underperformed during a market decline.
- Large drawdowns in the February through May 2021 and the November 2021 to February 2022 periods were due to the rapid rotation from growth stocks to value stocks; each quarter, our portfolios are based on themes and there is never a guarantee that our analysis and beliefs will be proven correct
- Consider owning or trading these stocks in whatever manner is most comfortable for you; while we will buy all 10 stocks in the manner identified above, feel free to trade certain stocks or wait for pullbacks if the stocks are overbought
- We have no idea what risk each member is willing or able to take. We are not registered investment advisors so be sure you understand the risk you take. Please consult your financial advisor.
- EarningsBeats.com shareholders/employees may own all or some of the portfolio stocks from time to time.
Weekly Snapshot
Here's a weekly recap:
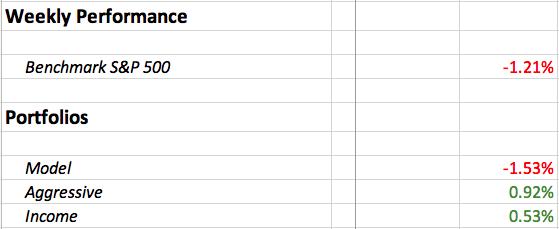
Weekly Summary
Benchmark S&P 500:
Last week's performance, in my opinion, was heavily influenced by max pain and August options expiration. As noted throughout last week, there was a heavy imbalance between in-the-money calls and puts. The BILLIONS of dollars of net in-the-money call premium likely directed prices lower throughout the week, culminating in the Friday selling that escalated yesterday (Monday, August 22nd).
Model Portfolio:
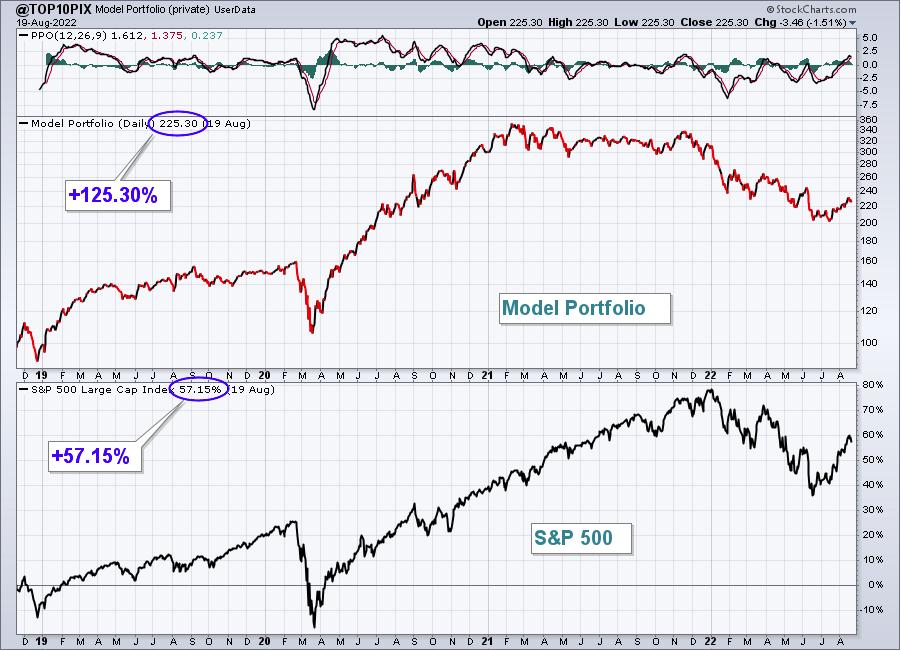
The Model Portfolio fell 1.53% last week, slightly underperforming the S&P 500. Here's the updated inception-to-date chart of the portfolio:
Aggressive Portfolio:
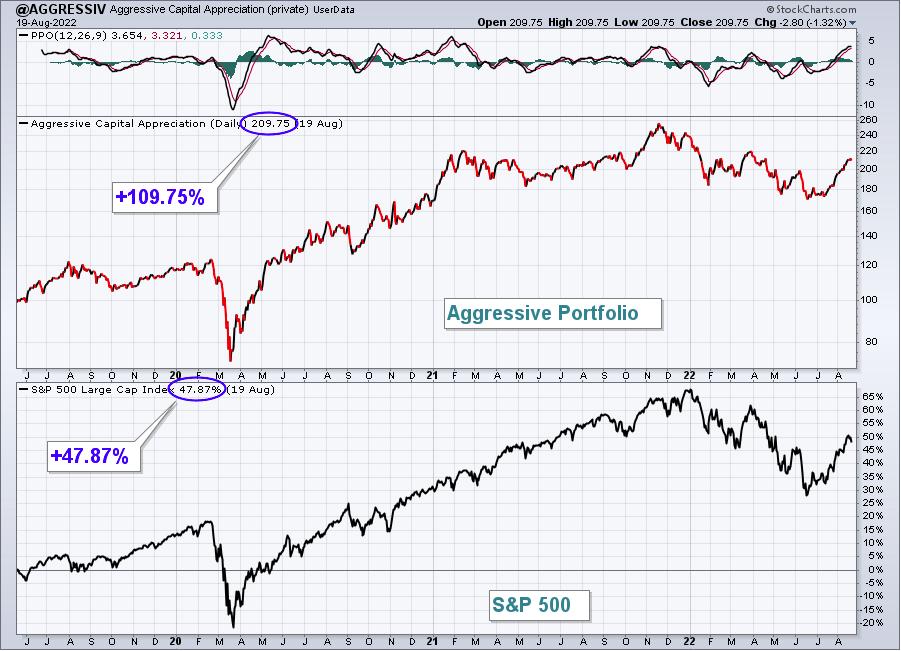
The Aggressive Portfolio rose 0.92% last week, outperforming the S&P 500. Here's the updated inception-to-date chart of the portfolio:
Income Portfolio:
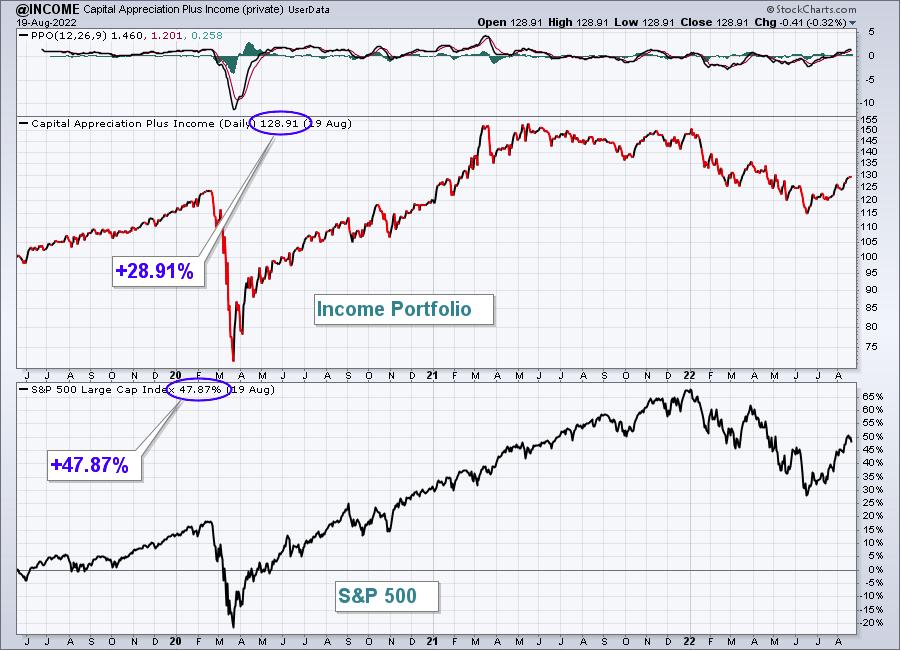
The Income Portfolio climbed 0.53% last week, outperforming the S&P 500.
Here's the updated inception-to-date chart of the portfolio:
Model ETF Portfolio
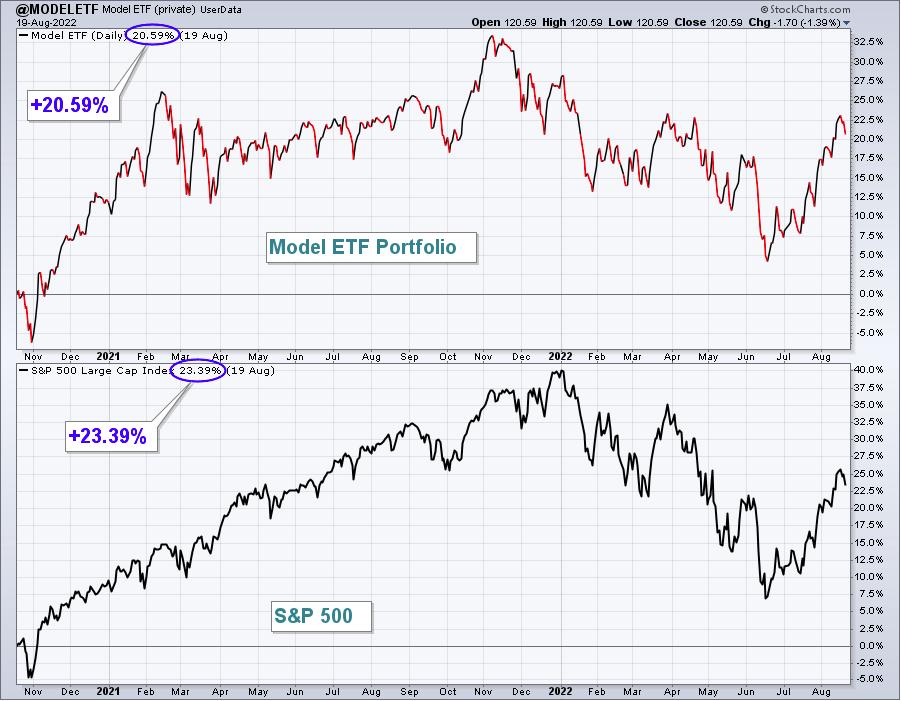
Our Model ETF Portfolio fell 1.18% last week, but slightly outperformed the S&P 500.
Here's the updated inception-to-date chart of the Model ETF Portfolio:
Model Trades
Last week's featured charts
ON (from Model Portfolio):
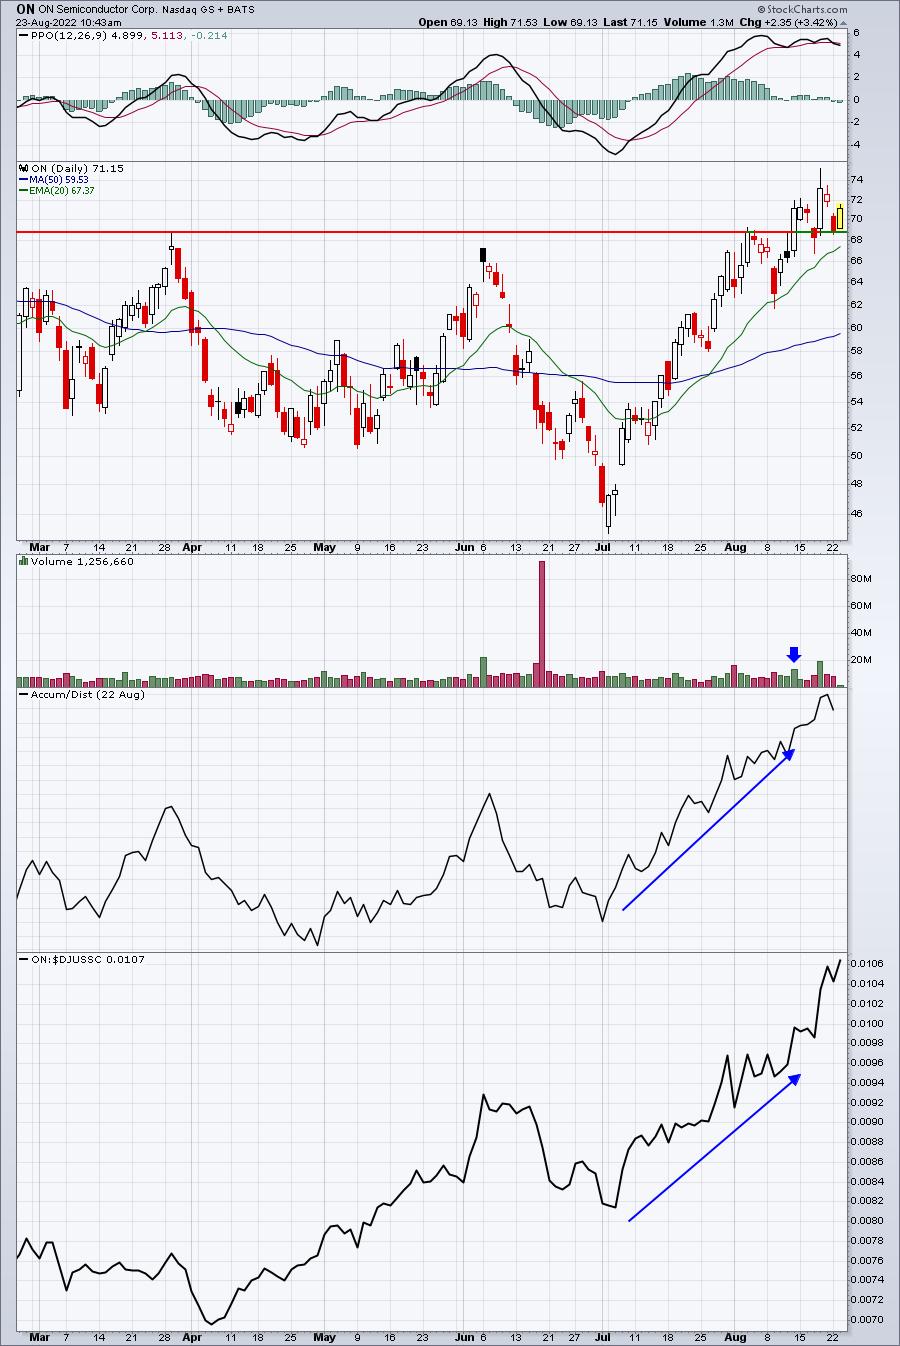
ON has continued to perform very well on both an absolute and especially a relative basis. It continues to be one of the very best semiconductor stocks, which is why ON remained in our Model Portfolio for the upcoming quarter. While we didn't see a huge advance last week, the fact that ON continues to march higher in a weak market environment is very encouraging.
Grade: A
WTRG (from Aggressive Portfolio):
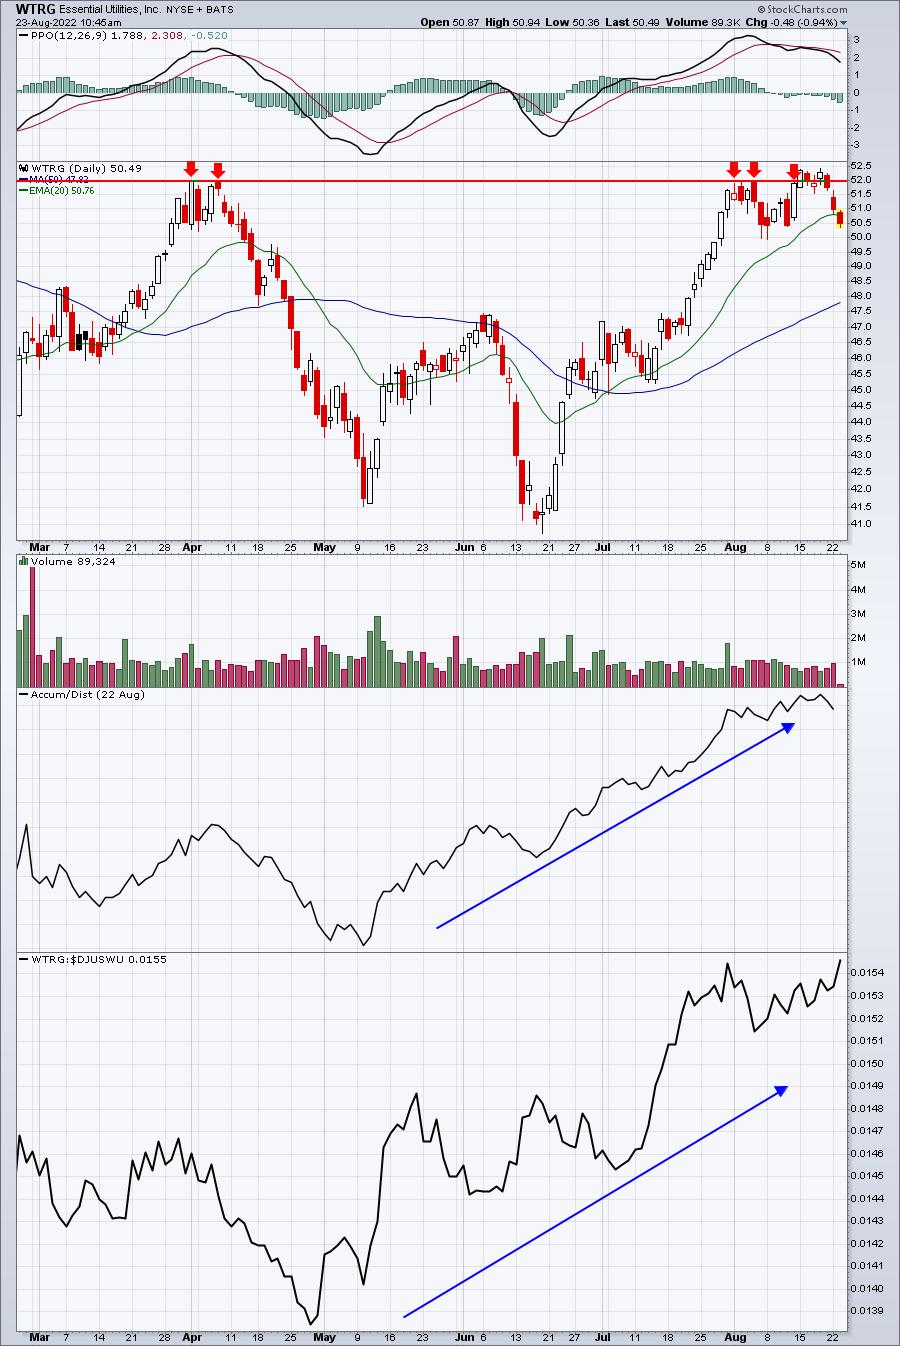
WTRG is no longer in our portfolios, but it's not really a bad-looking stock. It did finally break out above key price resistance on Monday, August 15th, but check out the volume on the breakout - hardly a confirming-type volume day. It's since pulled back this week, but the mostly-sideways consolidation last week wasn't horrible given the weak market environment.
Grade: B
AMGN (from Income Portfolio):
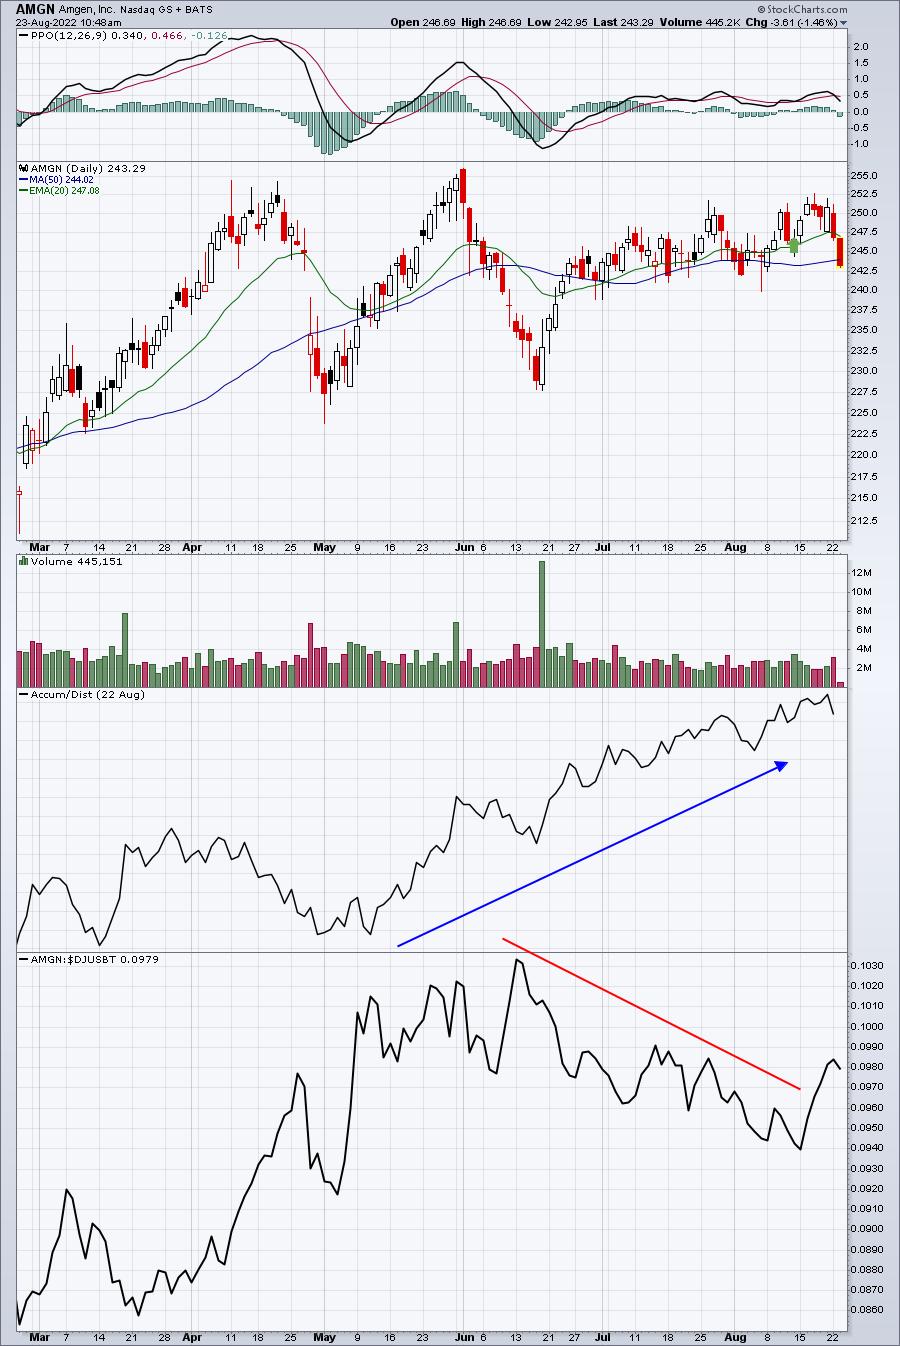
I was looking for AMGN to potentially rise back to 258 or so based on its high volume kick save at the rising 20-day EMA. While AMGN never recovered to that level, it did rise for 3 straight days last week, gaining 4-5 bucks in the process before pulling back late in the week. Its renewed relative strength was nice, making AMGN a decent call.
Grade: B+
MRNA (from SECL, SADCL):
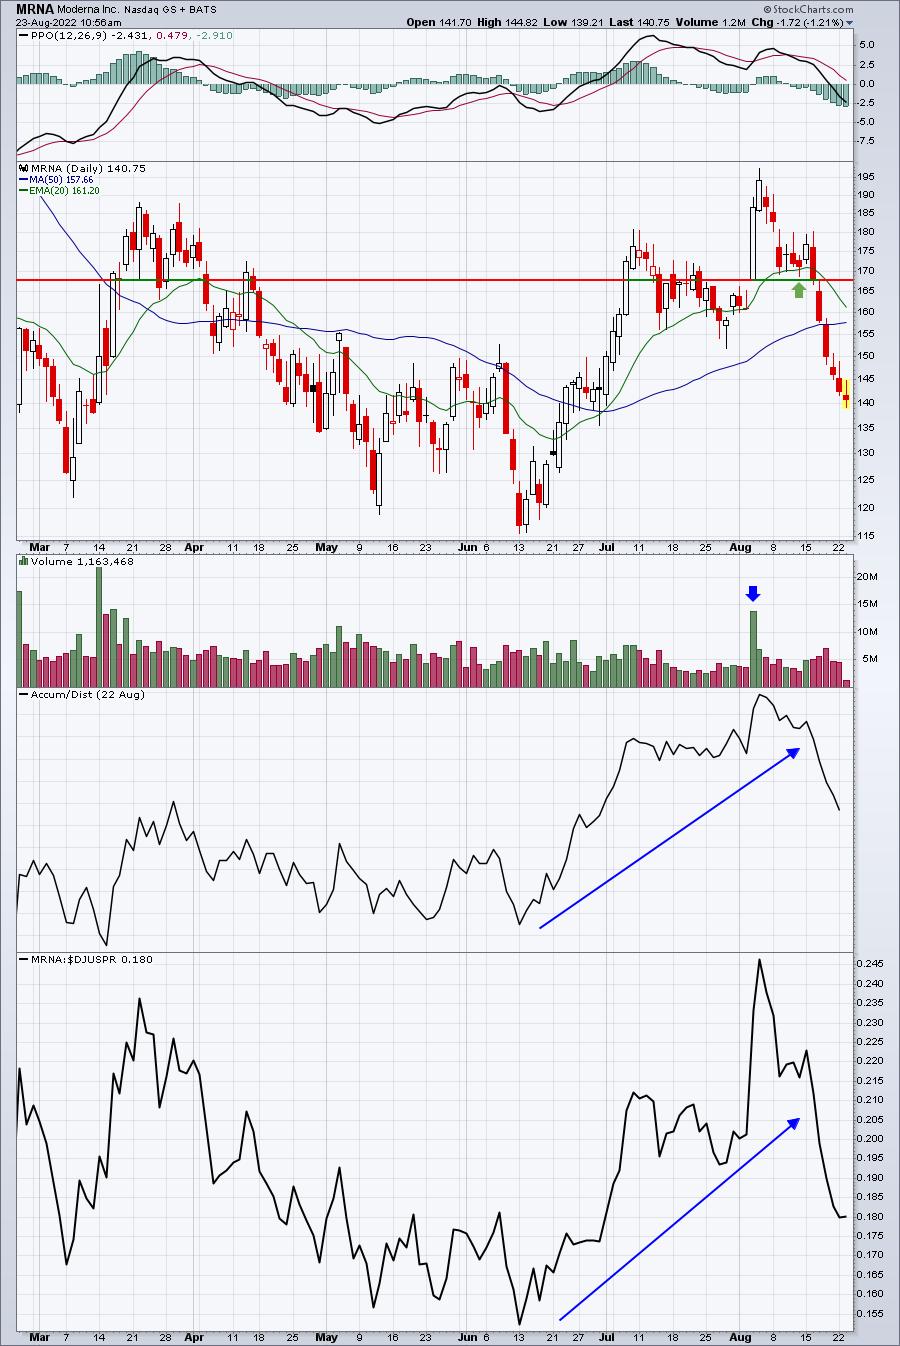
I fully expected MRNA to bounce off of the top of gap support, along with the rising 20-day EMA. While there was a quick $10 pop that potentially could have resulted in a quick profit, MRNA ultimately fell back and failed to hold the top of gap support, its 20-day EMA, the bottom of gap support, and several other price support levels. It was a trade that started off well, only to end extremely weak. And the selling last week has only been accelerating. If there's one positive to take away from this trade, it's the fact that stops should always be considered as an effective way to minimize losses. Last week's trade analysis suggested using 68 as a closing stop. After closing at 167.96 on August 16th, MRNA proceeded to drop the next four days, closing at 142.47 yesterday. It's down again today.
Grade: C-
To clarify this grade, it's not based on where MRNA is at now. Obviously, I'd have given a grade of F based on total performance since MRNA was featured. However, the use of stops can help to limit losses like the one above on MRNA. Clearly, a losing trade is never going to warrant a good grade, but the stop helped to minimize the poor grade here.
This week's featured Model Trades:
CDNS (from Model Portfolio):
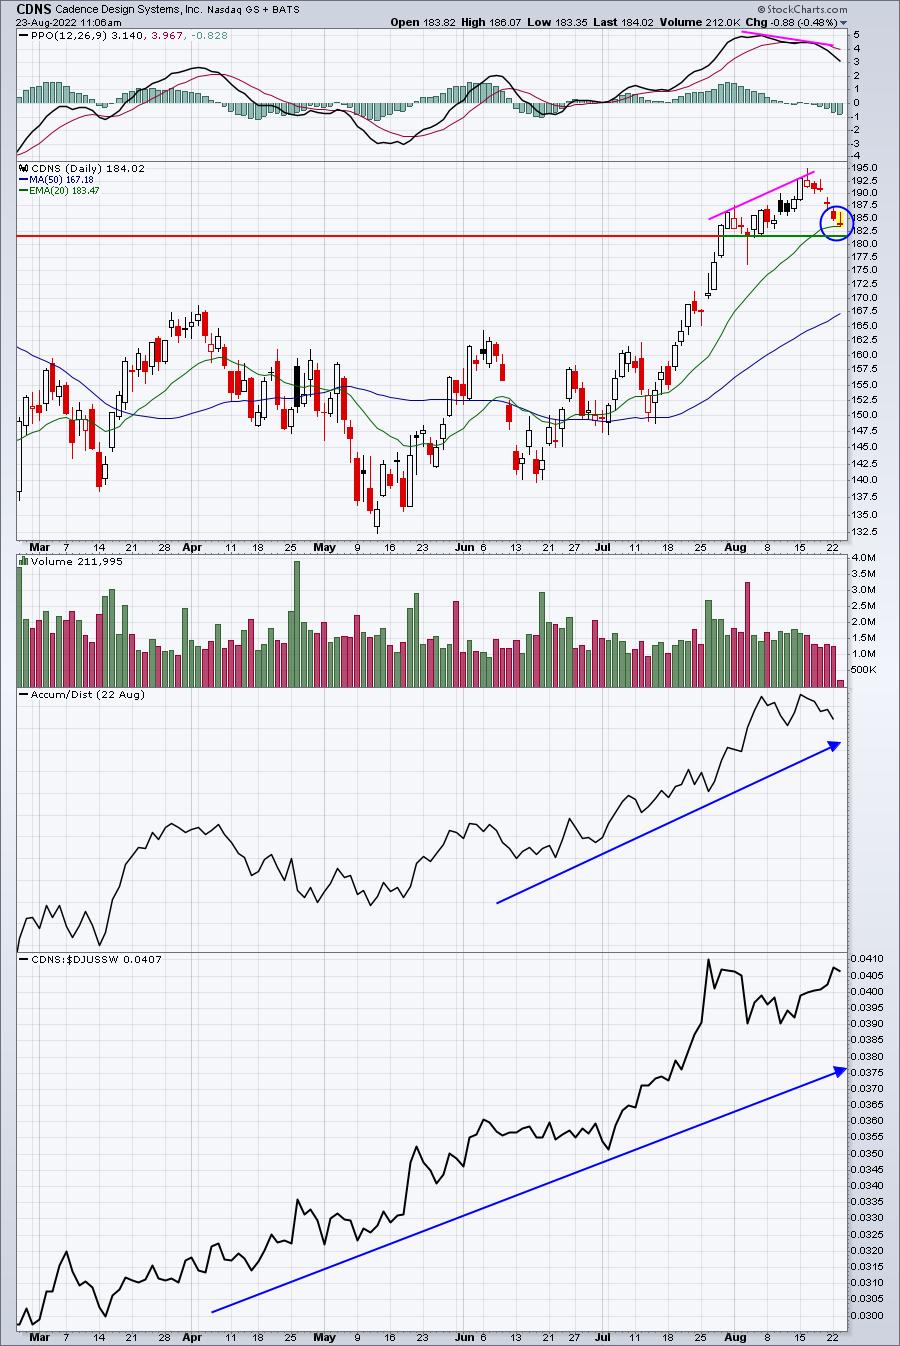
CDNS has been an excellent absolute and relative performer off its bottom back in May. I like the 20-day EMA test here, and you can keep the risk to an absolute minimum. If CDNS closes beneath its 20-day EMA, consider using a closing stop. There is a negative divergence in play here, but CDNS broke out on strong volume when that divergence printed. I tend to ignore these divergences AS LONG AS THE 20-DAY EMA HOLDS AS SUPPORT.
Full Disclosure: I own CDNS shares.
NDAQ (from Model Portfolio):
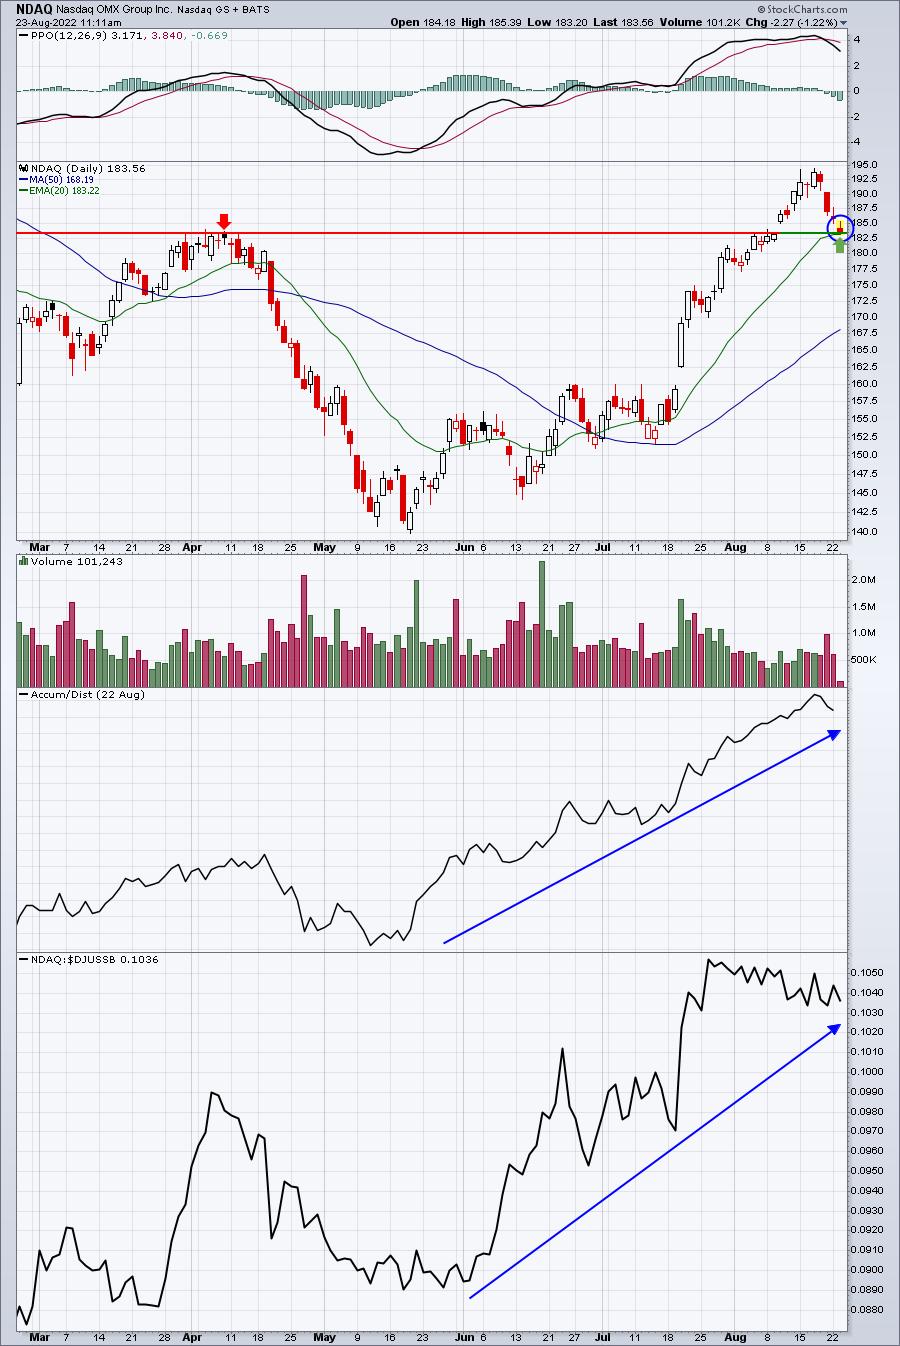
Ditto CDNS, minus the negative divergence. NDAQ has been a huge winner in the investment services area, so trading it off its initial 20-day EMA with minimal risk seems like a no-brainer. A stop could be considered on any close beneath the 20-day EMA.
Full Disclosure: I own NDAQ shares.
NXST (from Income Portfolio):
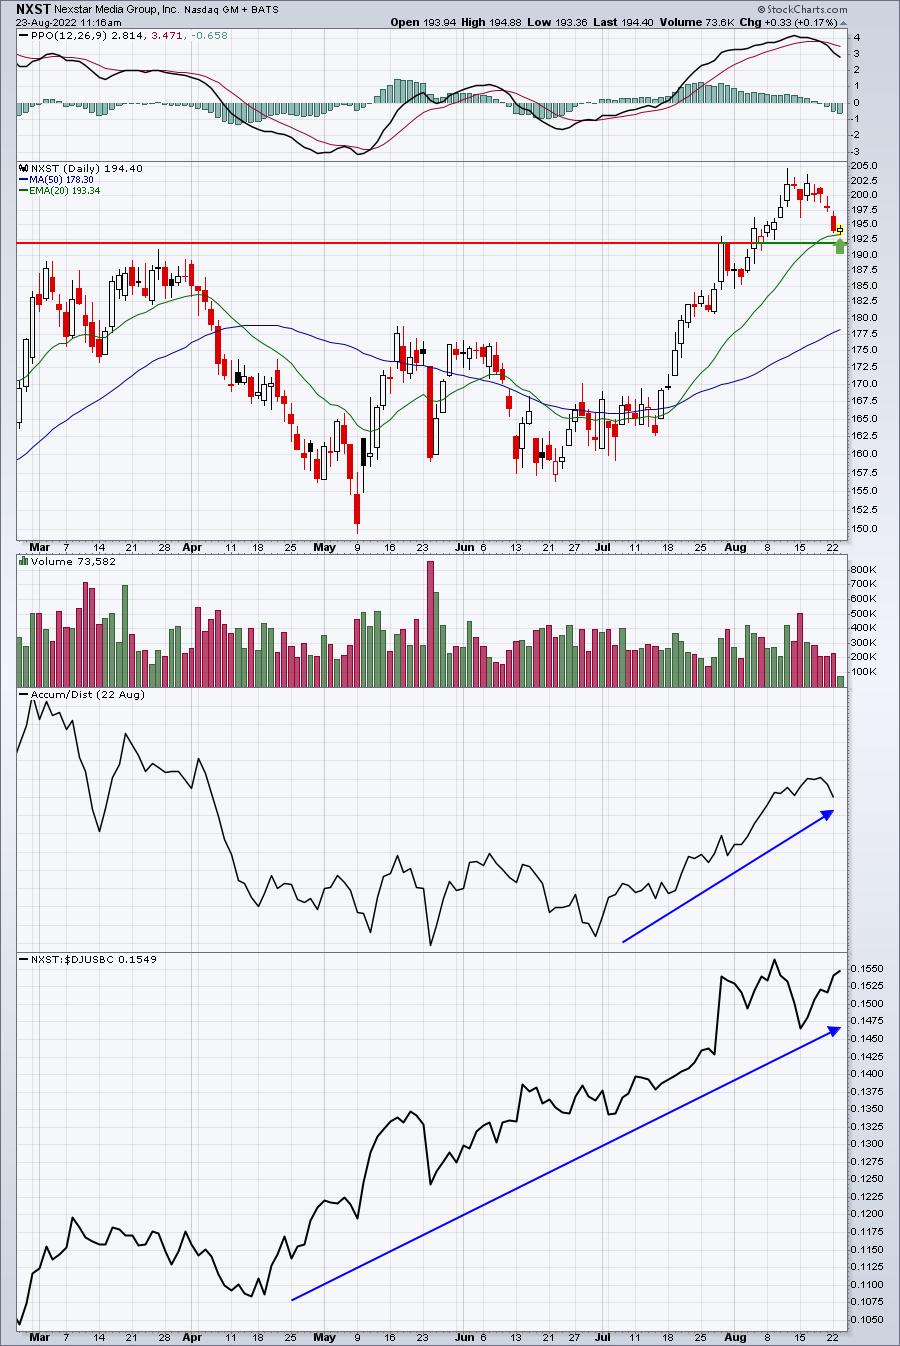
NXST is another 20-day EMA test. These are my absolute favorite trades, especially when it's the very first 20-day EMA test since the strength began. I can keep my stop very tight with any close beneath the rising 20-day EMA. In the case of NXST, you could use price support just beneath the 20-day EMA. That's really just a personal preference and up to each trader.
Full Disclosure: I own NXST shares.
A (ran 20-day EMA scan vs. SECL):
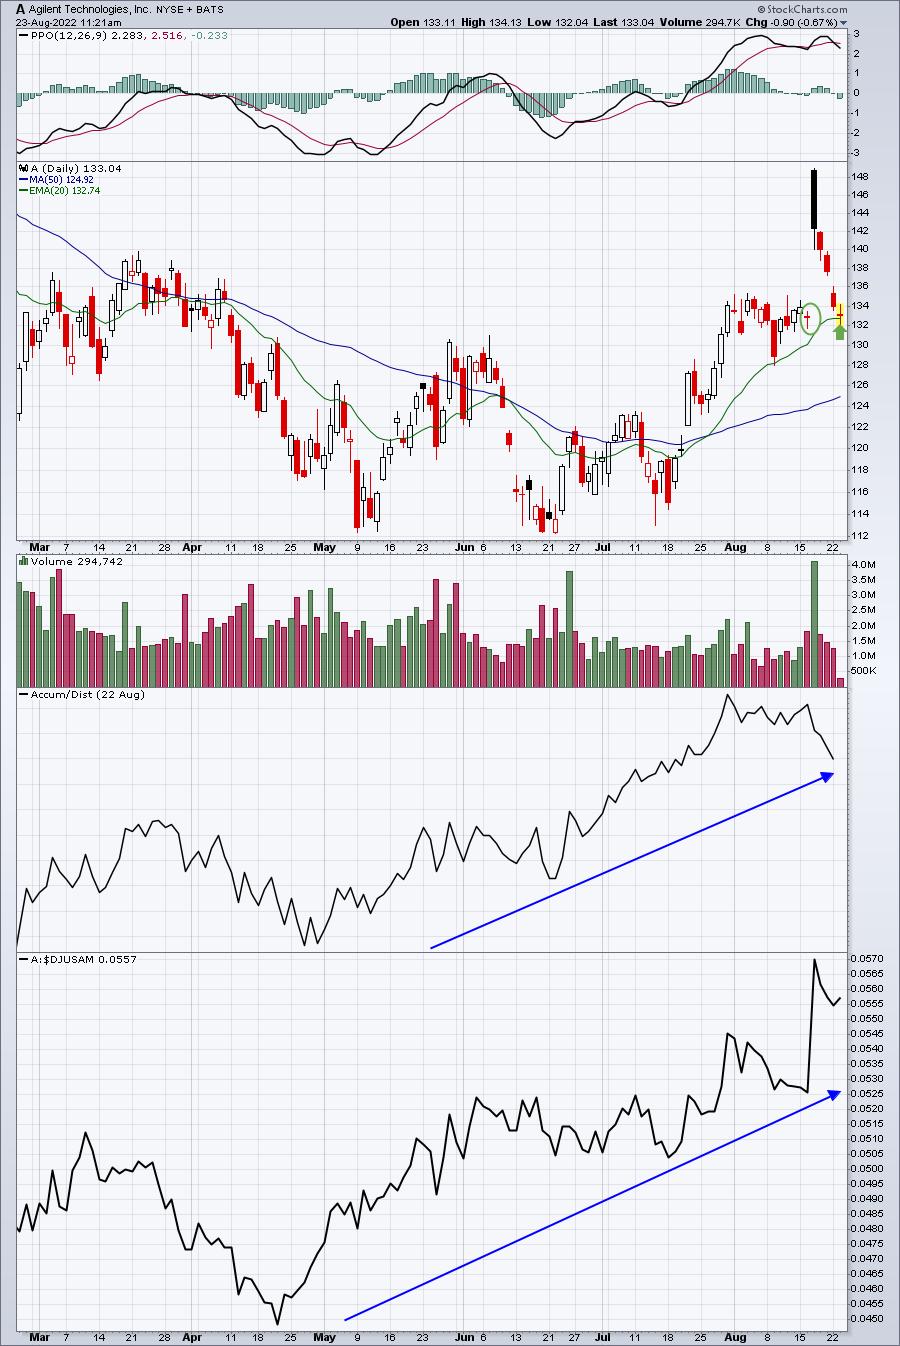
After gapping up several days ago with stronger-than-expected earnings, A has worked its way back down to both gap support and 20-day EMA support. I love the reward to risk on this one. If it closes beneath 132, I'd exit. Otherwise, I'd look for a return trip back to its opening price after earnings, or 148.84.
Full Disclosure: I own A shares.
The Week Ahead
Well, the week already got off to a very rough start on Monday, but that was honestly to be expected. The Monday following options-expiration Friday has historically been the worst trading day of the calendar month. This trend dates back to 1950 on our major indices. And given the huge advance we had heading into options expiration week, it made sense to see the reversal. I was expecting to see weakness continue into the early part of this week, but I'm not of the belief that it will continue.
Watch the daily highs and lows on our major indices this week. We're currently in a streak where lower highs and lower lows are the norm. When that streak ends, I believe we're more likely than not going to see our major indices rebound - possibly very quickly.
Happy trading!
Tom Bowley, Chief Market Strategist
EarningsBeats.com
"Better timing. Better trades."