
EB Weekly Portfolio Report - Monday, September 5, 2022
Upcoming Earnings Reports
According to Zacks.com, the following companies will be reporting earnings this week and each is a component of one of our portfolios:
Monday, September 5: None - Market Closed
Tuesday, September 6: None
Wednesday, September 7: None
Thursday, September 8: None
Friday, September 9: None
PLEASE NOTE: The above companies were provided using Zacks.com. We do hold our portfolio stocks through one earnings report, but every EarningsBeats.com member must make his/her own investing/trading decisions about holding stocks into earnings reports as it's the most volatile (risky) time to own a stock.
Portfolio Rules and Objectives
Here are the common traits and objectives of our portfolios:
- There are 10 leading stocks from up to 10 leading industries in each portfolio (at the time of selection). Generally, there will only be one stock per industry group, but there could be exceptions.
- They are typically held for an entire 90-day period, with no stops in place. We strive for consistency, transparency, and simplicity in our portfolios. EB.com members may hold these stocks for the entire 90 days, trade them, use stops, etc., but for purposes of our calculation, we will make no exceptions to our "buy and hold for three months" strategy.
- Every stock will generally be held through ONE earnings report
- The expectation is that relative winners will carry the portfolio to outperformance
- They were all entered into as of the close on Friday, August 19th
- Primary objective is to outperform the benchmark S&P 500 over time; quarter-to-quarter performance can be extremely volatile, especially if significant rotation takes place intra-quarter
Here are several considerations for EB members:
- The Income Portfolio should have the least amount of volatility as it will typically be comprised of quality large cap stocks with solid dividends
- The Model and Aggressive Portfolios should be viewed similar to aggressive growth funds; they will typically have a lot of volatility and periodic drawdowns can be significant from time to time
- The Income portfolio stocks will all pay dividends, with the expected average dividend yield to be at least 1.0%
- Drawdowns (losses) should be much milder on the Income portfolio, with more volatility expected on the other two; please review inception-to-date charts below to gain an idea of the volatility associated with each
- I believe the larger drawdown on the Income portfolio at the beginning of the pandemic was an anomaly, occurring as many defensive, higher-yielding companies uncharacteristically underperformed during a market decline.
- Large drawdowns in the February through May 2021 and the November 2021 to February 2022 periods were due to the rapid rotation from growth stocks to value stocks; each quarter, our portfolios are based on themes and there is never a guarantee that our analysis and beliefs will be proven correct
- Consider owning or trading these stocks in whatever manner is most comfortable for you; while we will buy all 10 stocks in the manner identified above, feel free to trade certain stocks or wait for pullbacks if the stocks are overbought
- We have no idea what risk each member is willing or able to take. We are not registered investment advisors so be sure you understand the risk you take. Please consult your financial advisor.
- EarningsBeats.com shareholders/employees may own all or some of the portfolio stocks from time to time.
Weekly Snapshot
Here's a weekly recap:
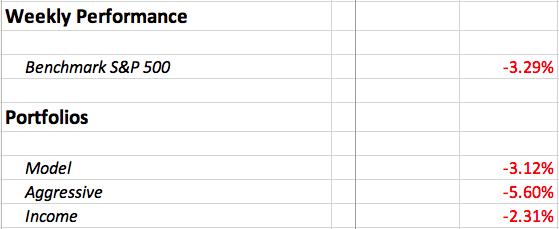
Weekly Summary
Benchmark S&P 500:
It was another rough week for U.S. equities, falling further from the high of 4325.28 established just 3 weeks ago. Max pain and a TON of net in-the-money call premium got the selling started and Fed Chief Jerome Powell exacerbated the selling with his Jackson Hole speech, where he declared there would be "more pain ahead". I'm not a fan of Fed chiefs editorializing when discussing the economy or stock market. Remember Alan Greenspan's "irrational exuberance" claim regarding the stock market on December 5th, 1996? That was such a great prognostication (sarcasm intended). The S&P 500 rallied after the speech from 744.38 (close that day) to 1527.46 on March 24th, 2000. The S&P 500 more than doubled in just over 3 years. Anyone listening to Greenspan's stock market "advice" would have missed out on one of the best stock market rallies in U.S. history. Fed Chief Powell should review history before trying to make his own predictions.
It should be noted, by the way, that Greenspan's comments did have a short-term effect as the S&P 500 dropped 4% over the next 12 calendar days. Since Powell's comments, the S&P 500 has fallen more than 6% in 7 calendar days. I believe Powell's call will end up being no better than Greenspan's.
Technology (XLK) was hardest hit last week, as you can see from the weekly sector leaderboard:
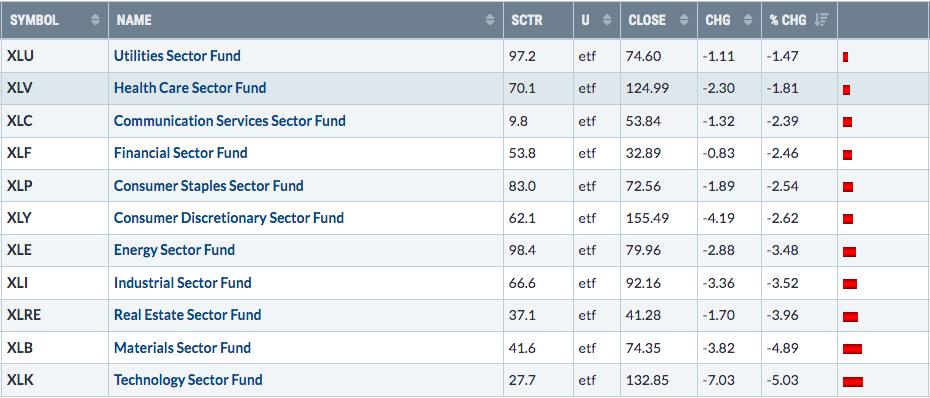
The biggest issue in technology is clearly the semiconductors ($DJUSSC), which lost 8.32% last week and is down roughly 14% since Powell's speech and 17% since options-related selling kicked in. If the group takes out its Thursday low, we'll see yet another 60-minute negative divergence. The last two have resulted in short-term periods of strength, so keep that in mind.
Model Portfolio:
The Model Portfolio lost 3.12% last week, slightly outperforming the S&P 500. Here's the updated inception-to-date chart of the portfolio:
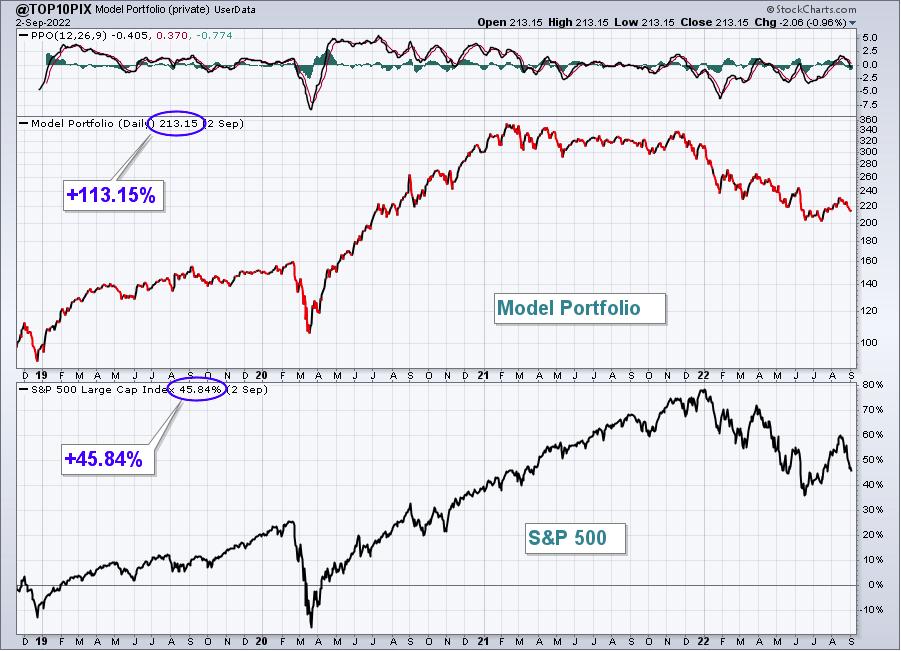
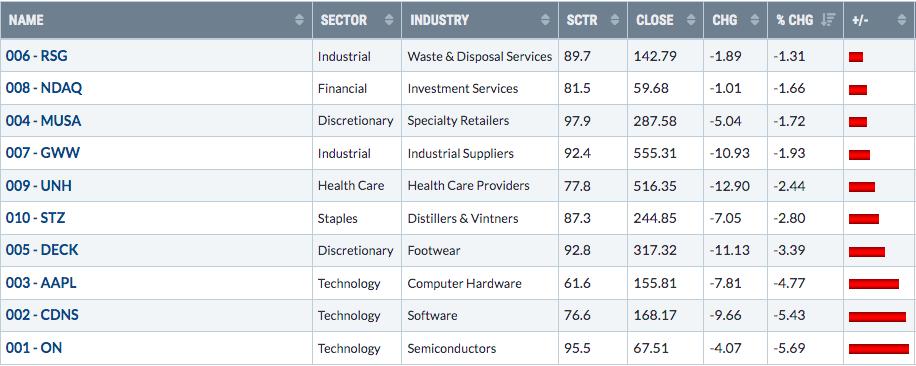
Here are how the Model Portfolio component stocks performed last week:
Aggressive Portfolio:
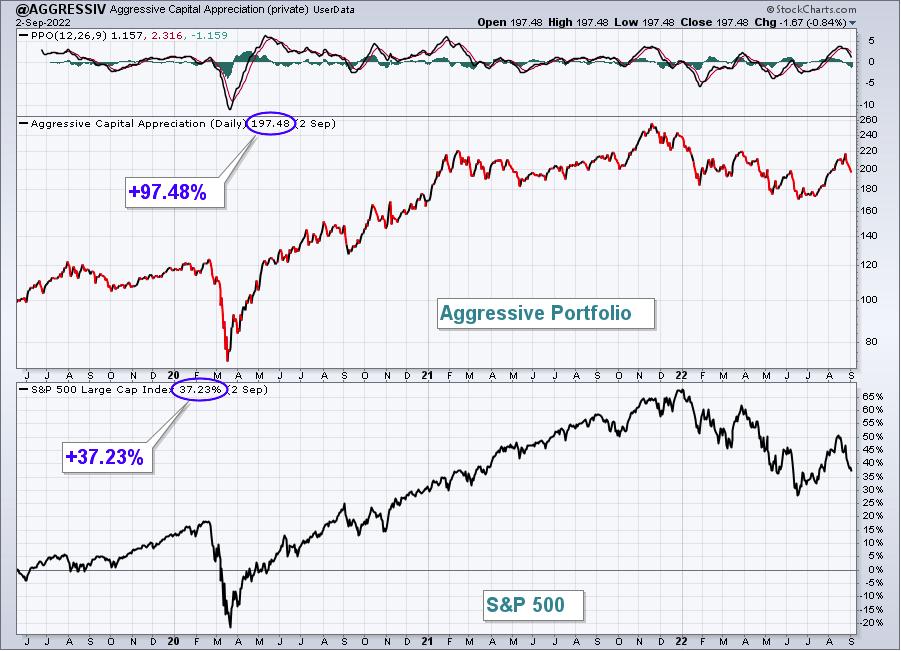
The Aggressive Portfolio dropped 5.60% last week, lagging the S&P 500. Here's the updated inception-to-date chart of the portfolio:
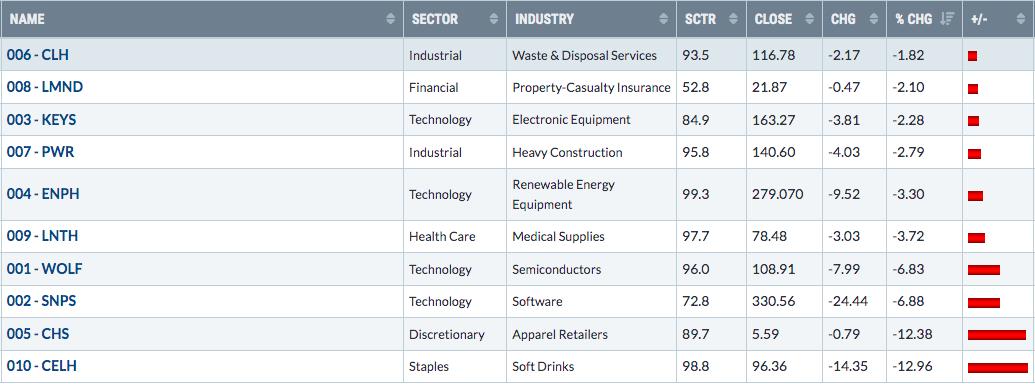
Here are how the Aggressive Portfolio component stocks performed last week:
Income Portfolio:
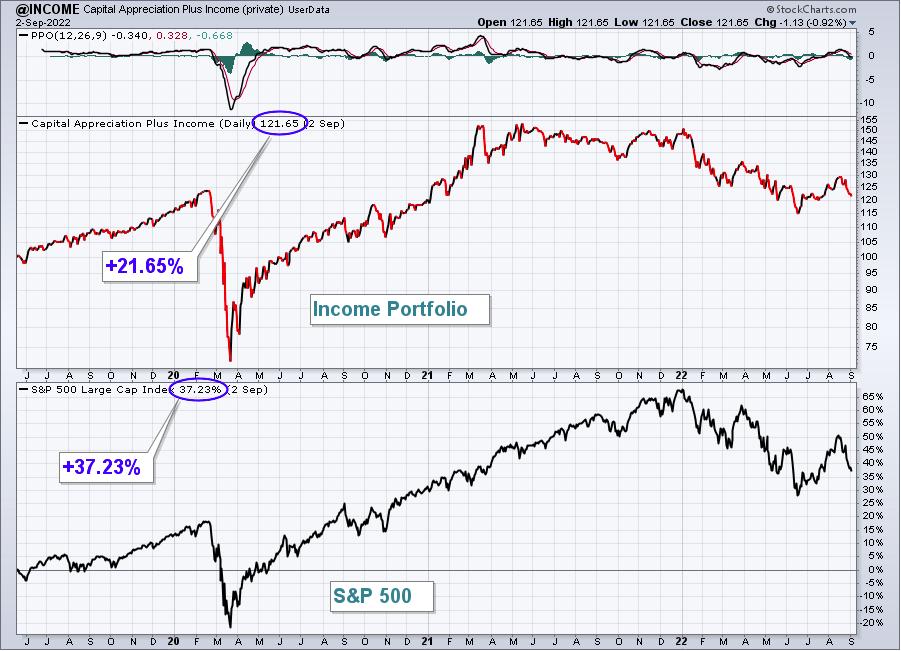
The Income Portfolio fell 2.31% last week, but did outperform the S&P 500.
Here's the updated inception-to-date chart of the portfolio:
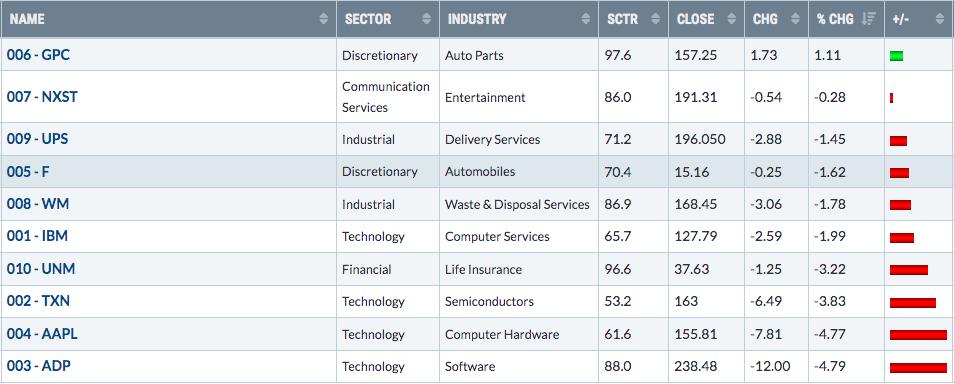
Here are how the Income Portfolio component stocks performed last week:
Model ETF Portfolio
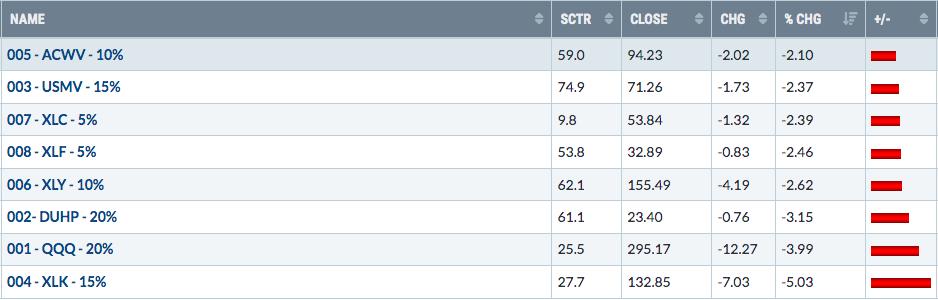
Our Model ETF Portfolio fell 3.26% last week, slightly beating the S&P 500.
Here's the updated inception-to-date chart of the Model ETF Portfolio:
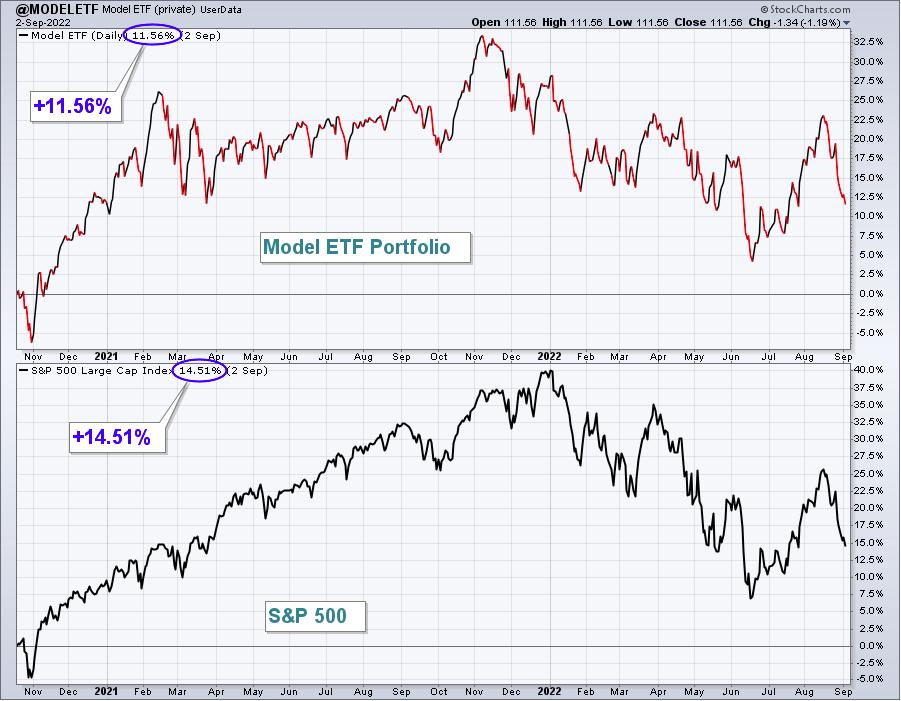
Here are how the Model ETF Portfolio components performed last week:
Model Trades
I will provide Model Trades each week in this Weekly Portfolio Report, which will simply be to outline possible trades based on key support, resistance, relative strength, and where these trades come from. For instance, my trading strategy for Strong AD ChartList (SADCL) stocks might be completely different than my trading strategy on Strong Earnings ChartList (SECL) stocks. Obviously, it would be different from a Short Squeeze ChartList (SSCL) trading candidate. I'll lay out the annotated chart and my reasoning for the (potential) trade. In the following week's EB Weekly Portfolio Report, I'll grade each of the prior week's Model Trades. Grades will generally be based on how these trades performed relative to the S&P 500. Feel free to trade these stocks in a similar manner or according to your own trading strategy. Or completely ignore them. It's completely up to you. I am not a Registered Investment Advisor (nor is EarningsBeats.com). THESE TRADING CANDIDATES SHOULD NOT BE VIEWED AS INVESTMENT ADVICE.
I view EarningsBeats.com as a market research, market guidance, and market education platform. We do not attempt, in any fashion, to manage anyone's money. We have no idea of the risk tolerance of each of our members, nor do we have any idea of your financial goals and objectives. It would be irresponsible for us to provide advice to any of our members. Therefore, please consult your own financial advisor before considering any buy/sell decisions. You are completely responsible for the financial decisions that you make.
Last week's featured Model Trades
I provided last week's Model Trades in the Monday, August 29th Daily Market Report (DMR). After the Fed fiasco on Friday, August 26th and the very poor market action, I wanted to see the Monday action before providing the Model Trades. I provided these 3 stocks late Monday afternoon:
DECK (from Model Portfolio and SECL):
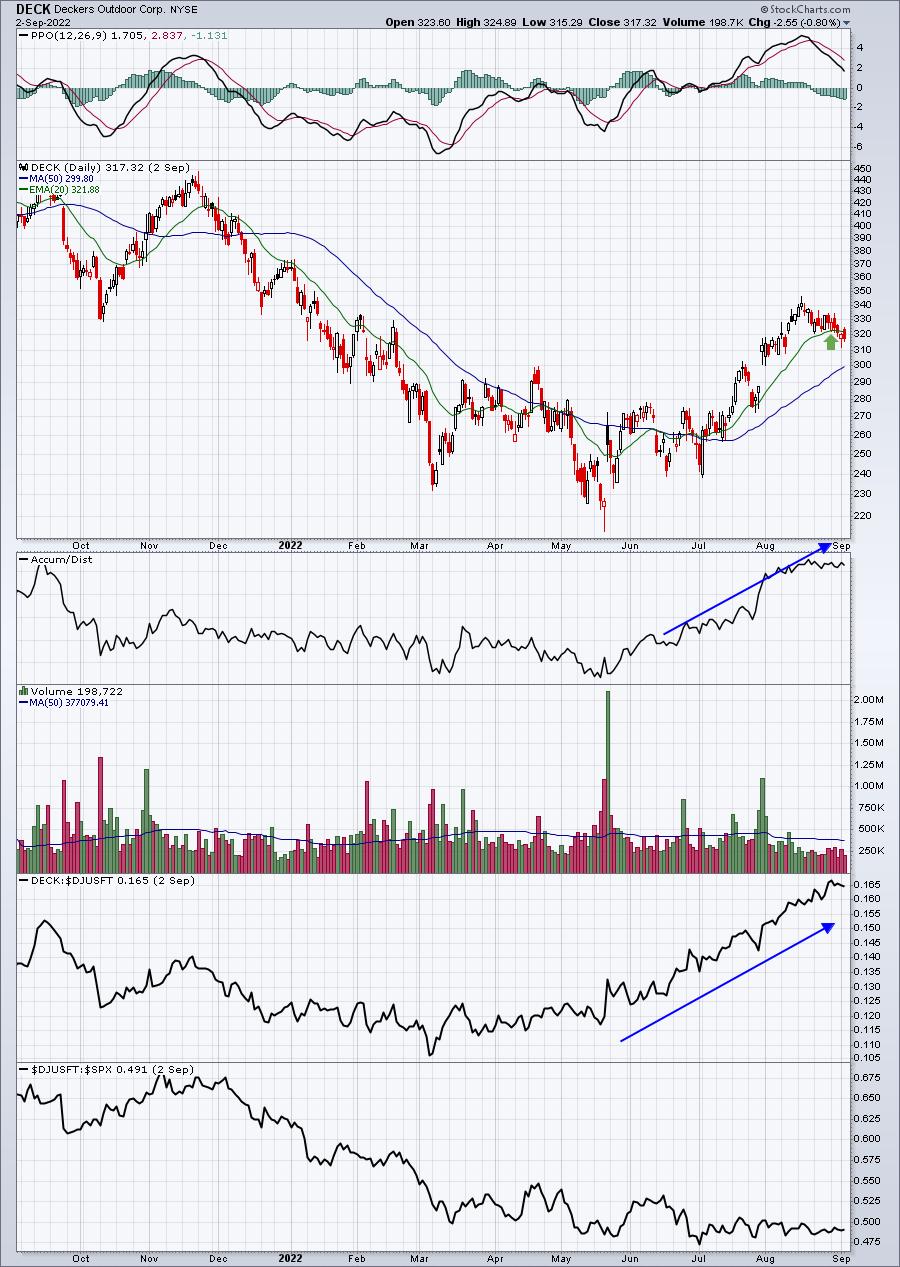
My argument last week: DECK is a part of our Model Portfolio and is a big leader in the footwear space ($DJUSFT). Today's low tested not only the rising 20-day EMA, but also tested the most recent gap support close to 322. A close beneath 322 would spook me, but otherwise I'm looking for new highs ahead for DECK.
Result: DECK closed on Wednesday at 321.57, which would have triggered a sell and a small (less than 2%) loss. It did manage to outperform the S&P 500, which is why I'm a bit generous with the grade here. I still like DECK moving forward, but, like just about every other stock, its performance is going to be subject to the overall market environment, which has not been good the past 2-3 weeks.
Grade: B
RUN (from SECL):
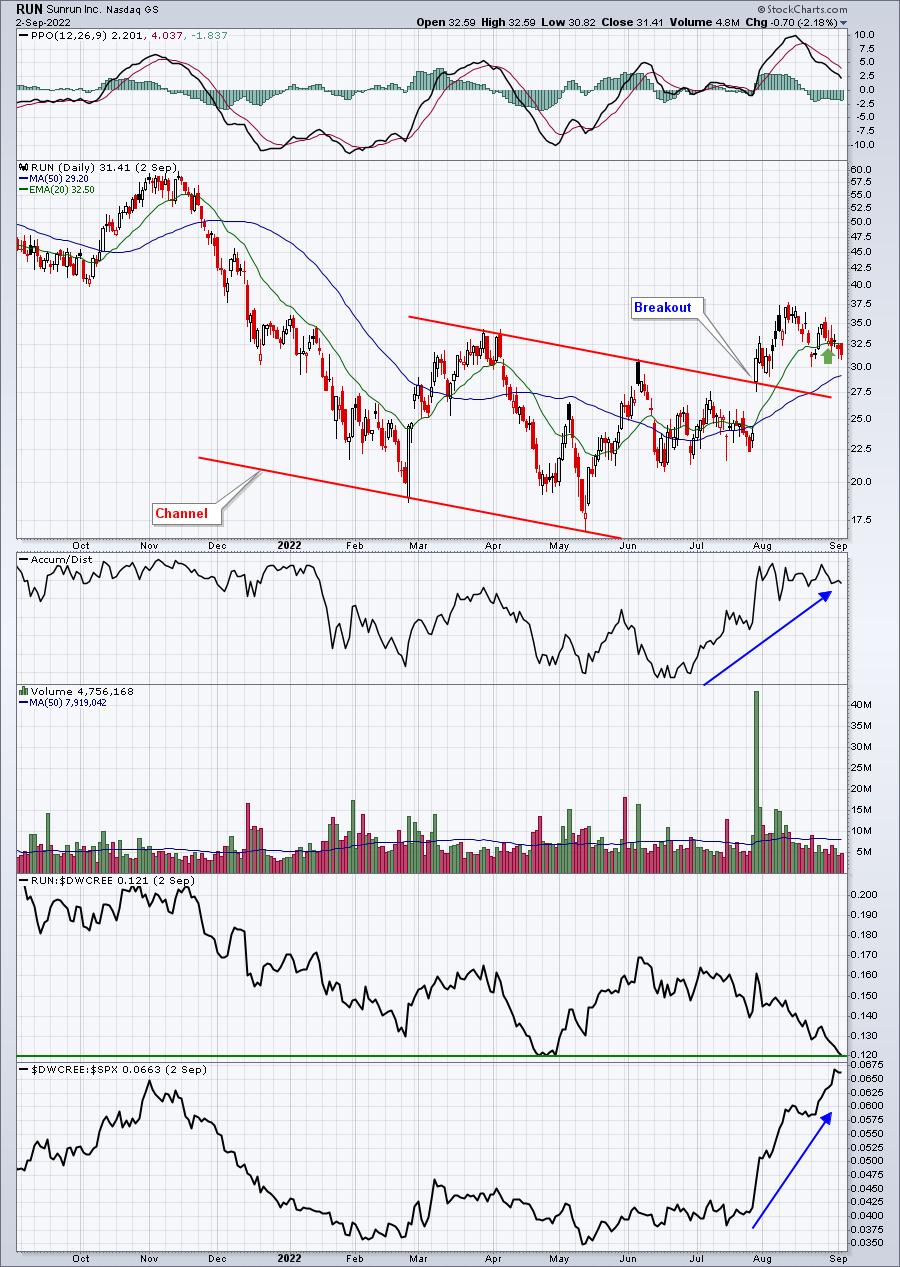
My argument last week: RUN is part of a very strong renewable energy group ($DWCREE). While it's not the best performer within the group, I do love the MASSIVE volume that accompanied its recent channel breakout. Pulling back to the 20-day EMA presents an opportunity. RUN is quite aggressive, so buying at the 20-day EMA and again on any weakness down to 30.00 would be a possible strategy. Any close beneath the 50-day SMA and I'd exit.
Result: RUN finished lower on the week, but never triggered its second entry at 30.00. The 50-day SMA, currently at 29.20 was our closing stop, which never triggered. I'm fine letting RUN run into next week as a continuation of this Model Trade.
Grade: Incomplete
LSI (from SECL):
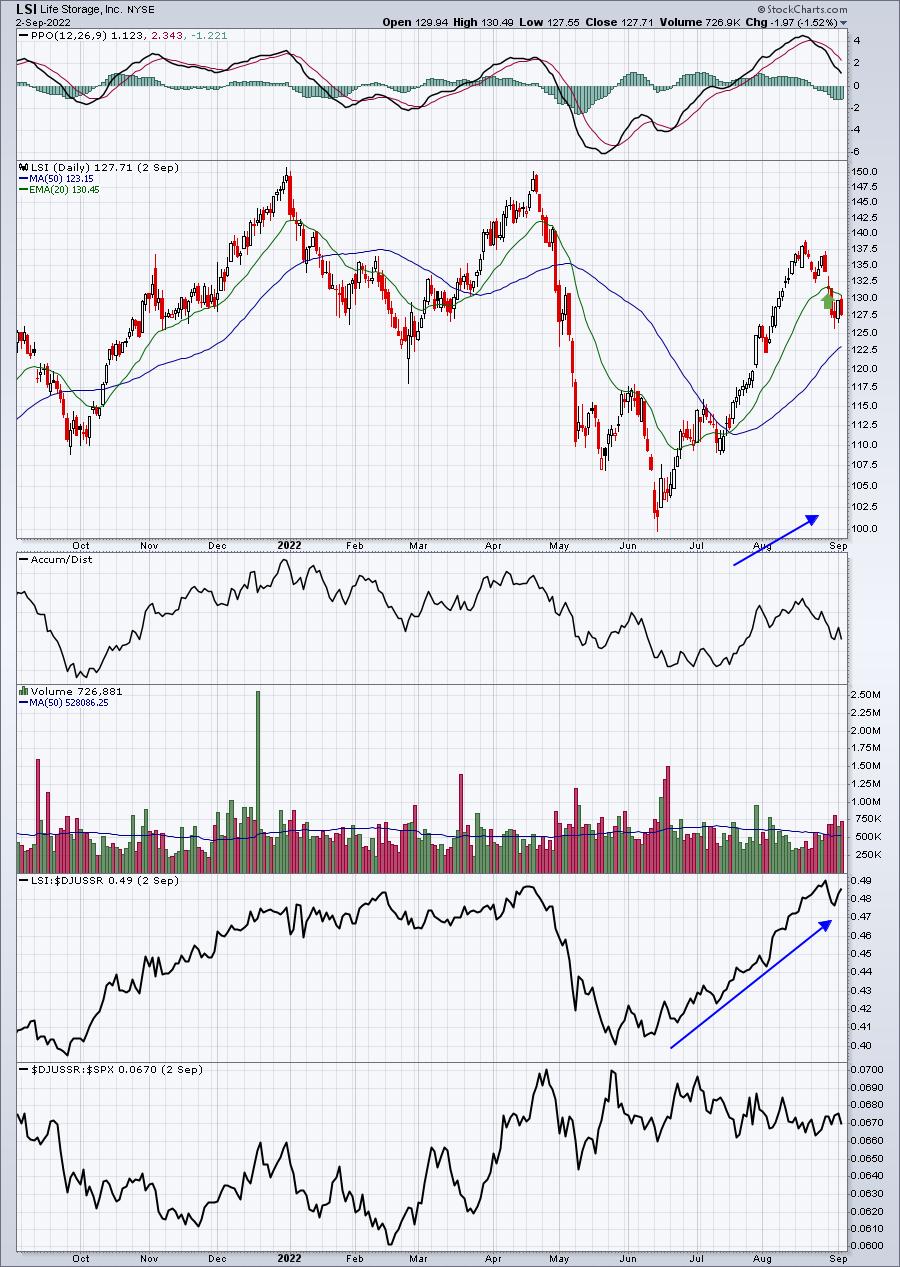
My argument last week: This one is in the real estate space, so it's a bit more of a defensive trade. Still, I'd keep a tight closing stop beneath the 20-day EMA.
Result: Real estate (XLRE) was among the worst-performing sectors last week, which resulted in an early exit for LSI. Tuesday's close of 127.68 finished well below the 20-day EMA, resulting in a SELL with a loss of approximately 3%
Grade: C-
This week's featured Model Trades:
First, we are going to continue our RUN trade from last week. We initially entered at 33.00, with a 2nd entry at 30.00, if it gets there. Our closing stop is at the 50-day SMA. I receive many questions regarding how a "closing" stop works, whether it means to exit as the market is closing or wait until the open the next morning. Our closing stop will be at 3:59pm ET, literally seconds before the market closes. If a stock breaks down beneath the closing support we mention, I would not want to hold and wait to see where it opens the next morning. I view that strategy as extremely risky. If you're not available to exit just before the closing bell, keep that in mind in determining the risk you're willing to take.
I LOVE to trade stocks at gap support levels. They're probably my favorite trades. I am focusing on 3 stocks that have now reached key gap support from recent earnings reports. Here they are, in no particular order:
NET (from RGCL and EADCL):
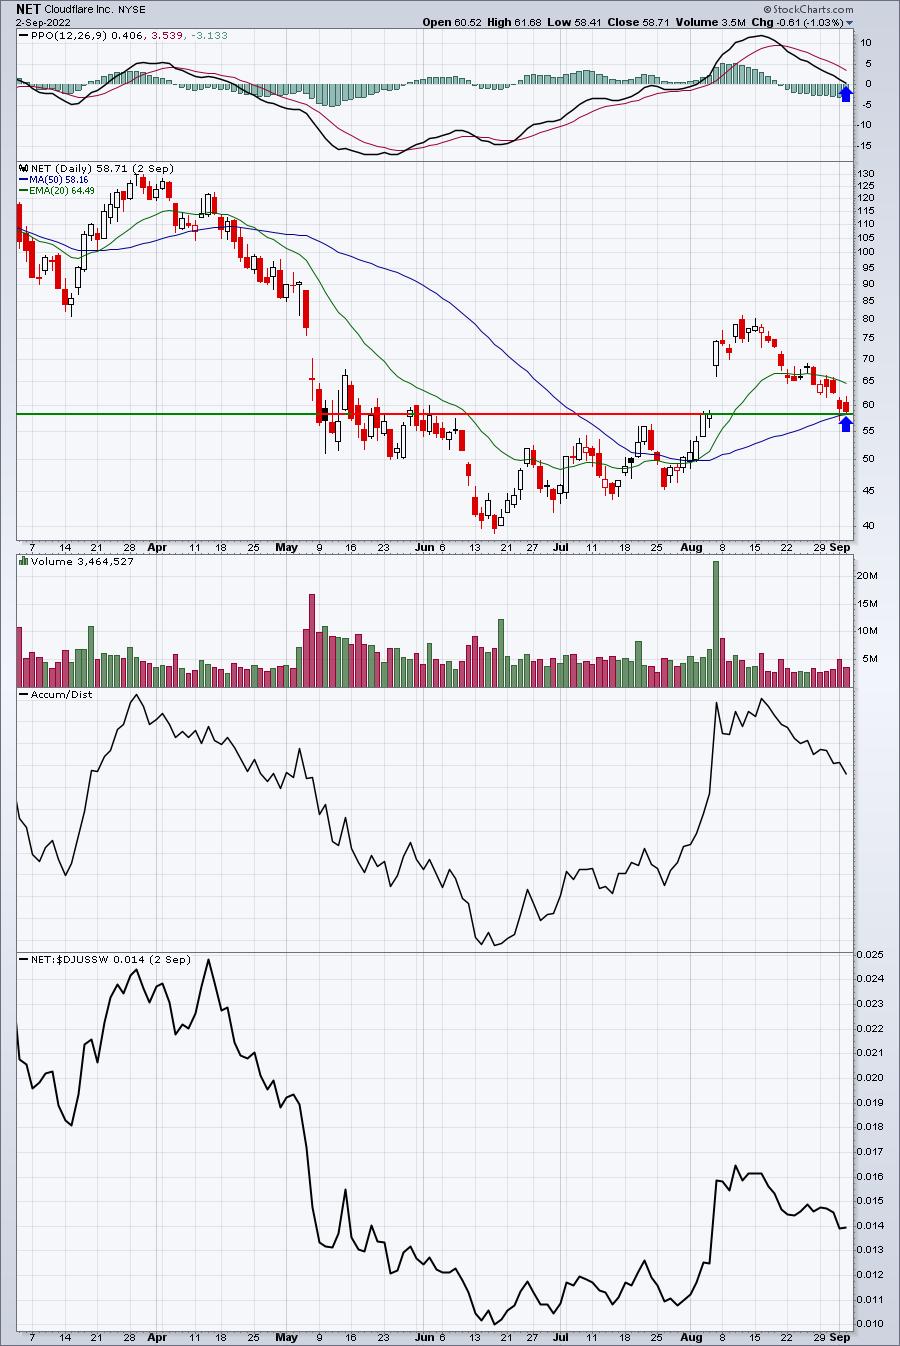
When NET reported its quarterly results in early August, it gapped much, much higher on the biggest volume of the year. On Thursday and Friday of last week, NET hit intraday lows just beneath gap support at 58.43. NET traded above 80 after its earnings, now we have the chance to buy at gap support. I love the reward to risk here, but clearly we'll need a better market environment to increase our chance of success with any trade. The 50-day SMA is 58.16. Any CLOSE beneath both gap support at 58.43 AND the 50-day SMA would trigger a sell. Initial resistance could be felt at the 20-day EMA, currently at 64.49.
GSHD (from EADCL):
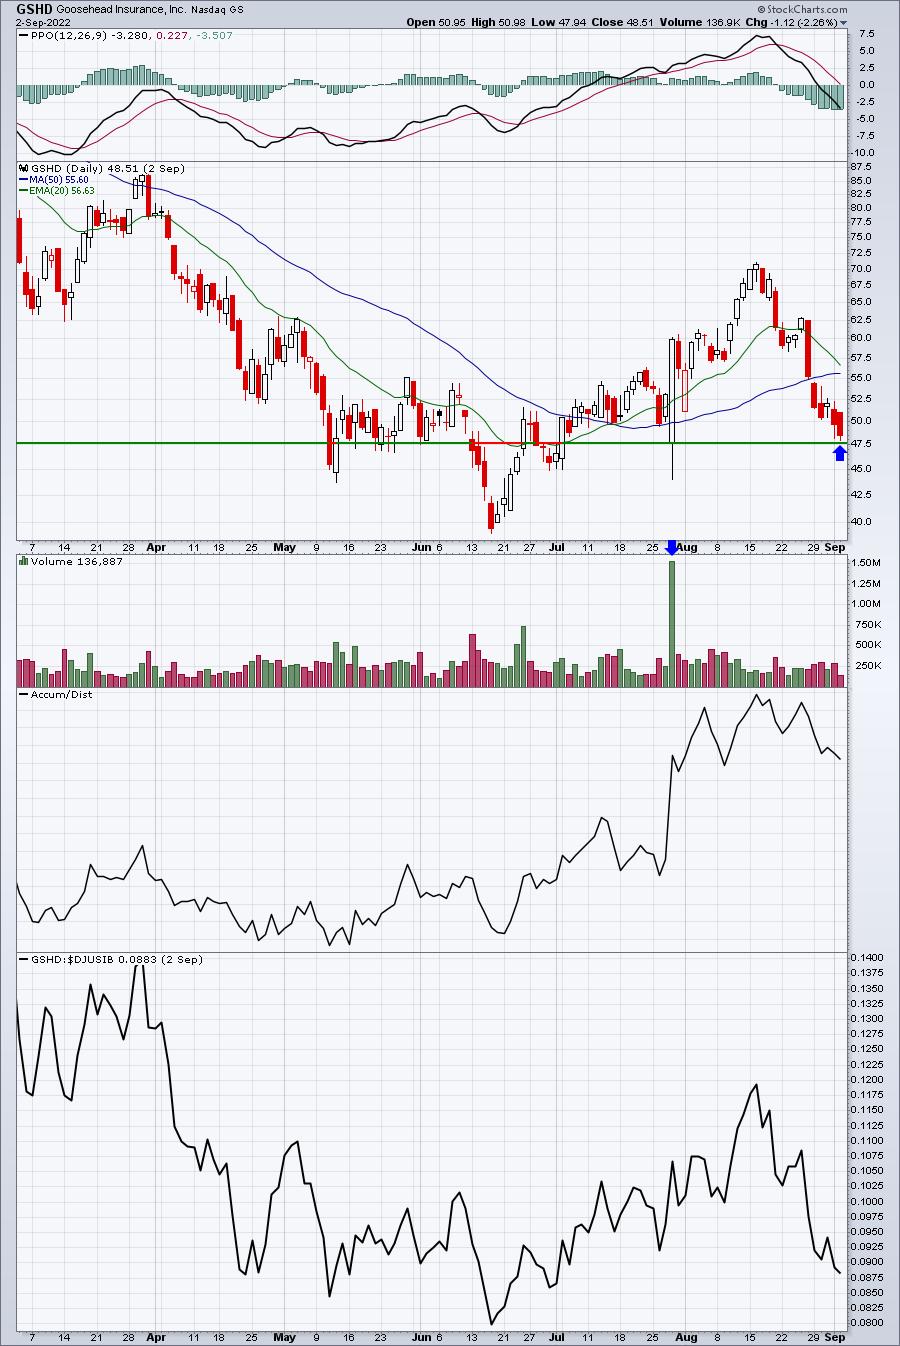
47.70 is key support on GSHD. After reporting quarterly results, the stock gapped lower, but the ensuing rally back to 70+ was powerful. Insurance brokers ($DJUSIB), in general, were rallying back then, so if 47.70 is lost on a closing basis, it'll trigger a SELL. Otherwise, a trip back to test the key 20-day EMA and/or 50-day SMA is what I'd look for.
TTMI (from SECL, SADCL, RGCL, BTCL):
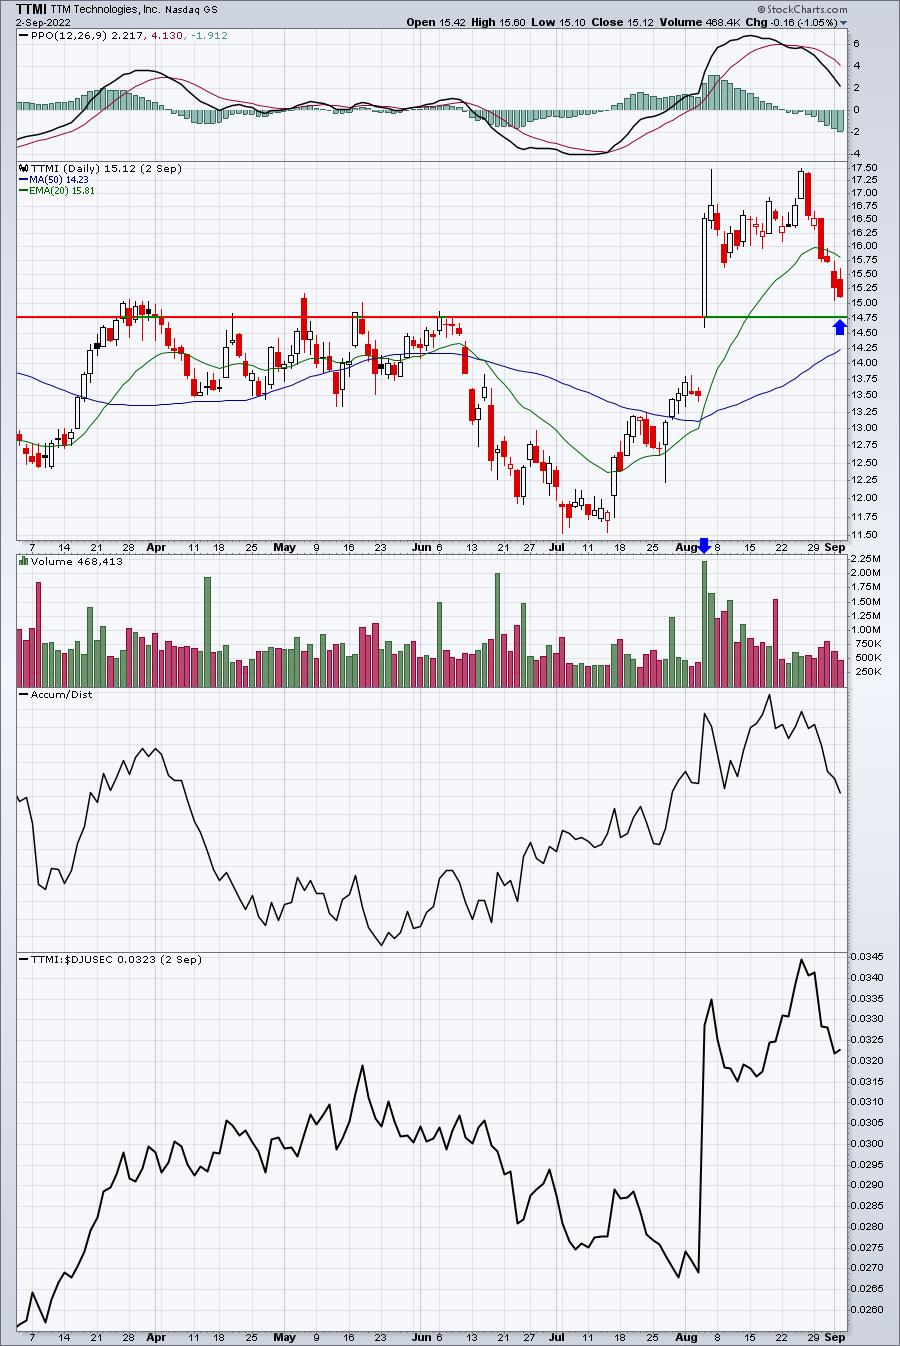
14.76 is key gap support. If TTMI hits that level, we'd be a buyer. A close beneath 14.76 and we'd exit. A recovery back to 15.55-15.73 would be an opportunity for a quick profit. A close above that range would be very bullish.
WOLF (from Aggressive Portfolio, SECL, SADCL, RGCL, BTCL):
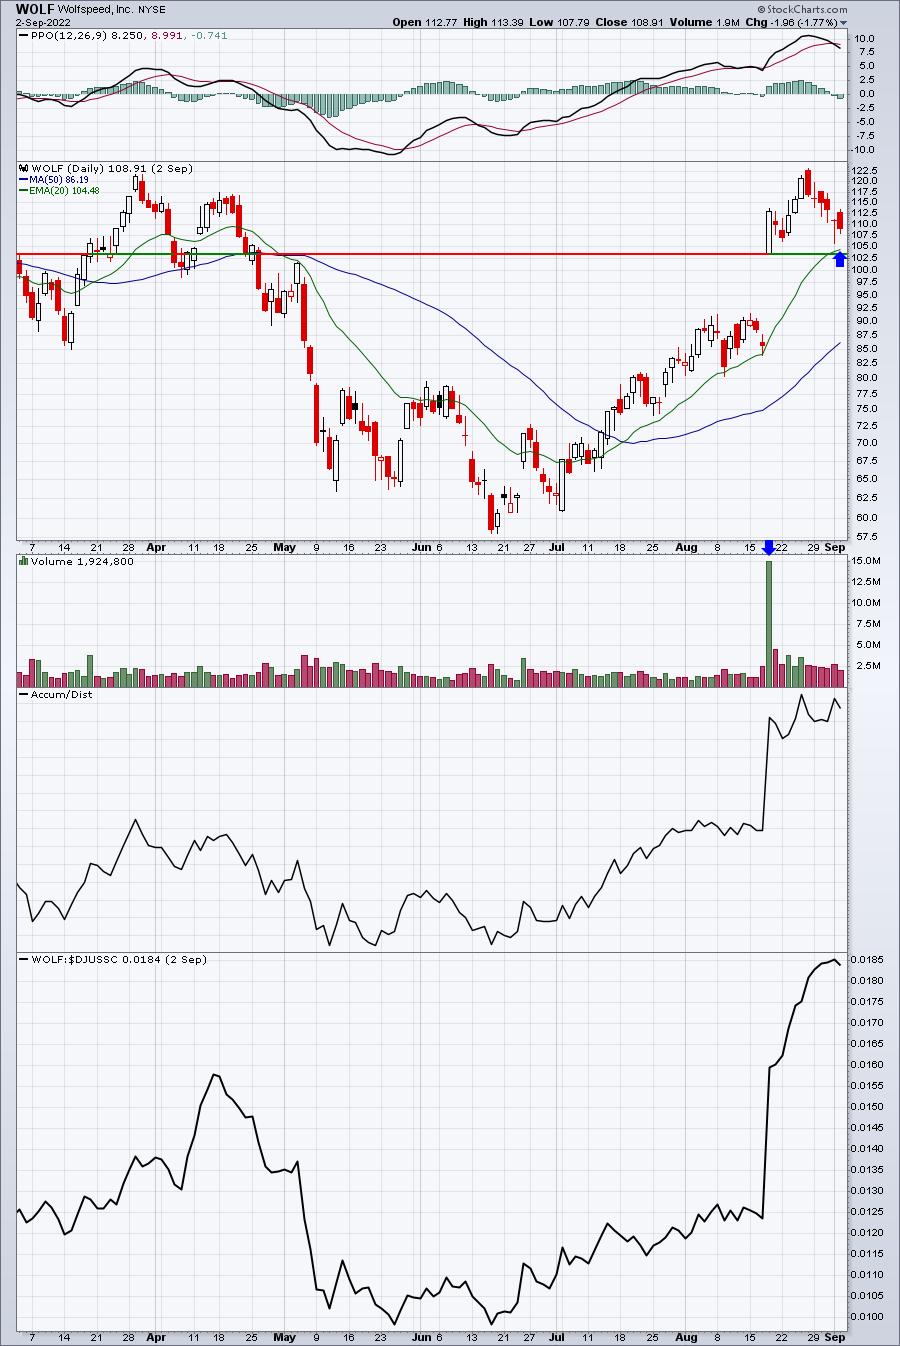
WOLF is definitely aggressive, but it's one of the best-performing semiconductor stocks right now. I like two entries - first at the current price and the second on a 20-day EMA test. I'd use a closing stop of 103.58 (top of gap support). A move back to 120-122 is what I'd look for here.
The Week Ahead
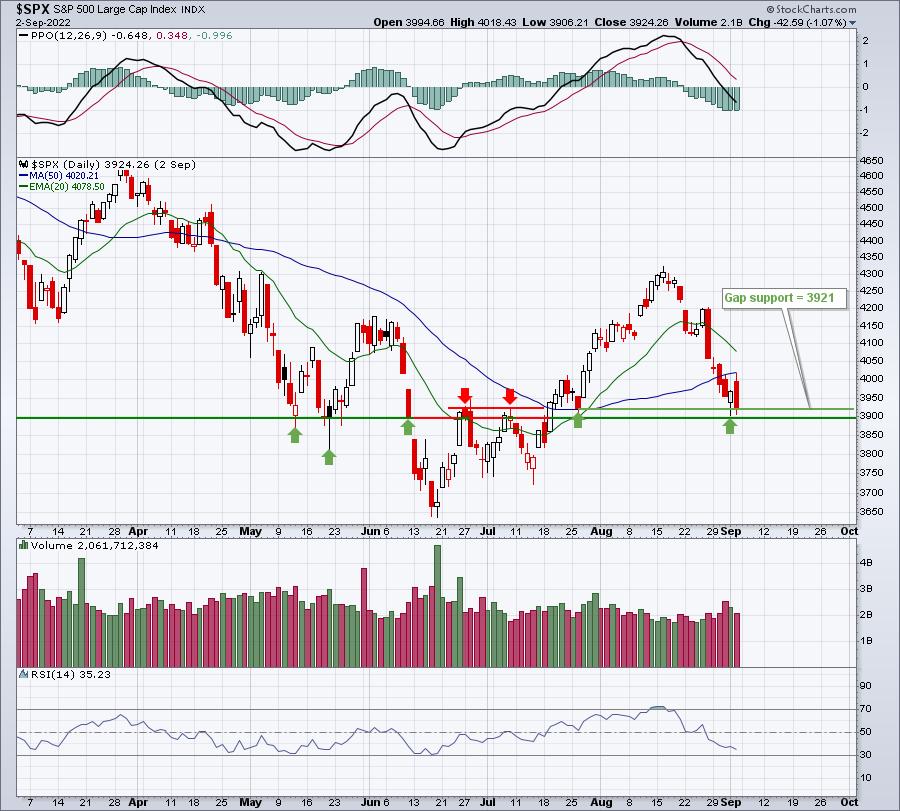
The key short-term support on the S&P 500 is clearly defined, in my view, from the 3900-3921 level. We've seen 3900 hold as both key price support and price resistance, so losing that level would be a blow in the short-term and would certainly increase the odds of a double bottom at the mid-June low of 3636:
In addition to this being a critical short-term price support zone, sentiment has also reached an extreme level. The 5-day moving average of the equity only put call ratio ($CPCE) is now at .79, nearly as high as it was when the mid-June low formed:
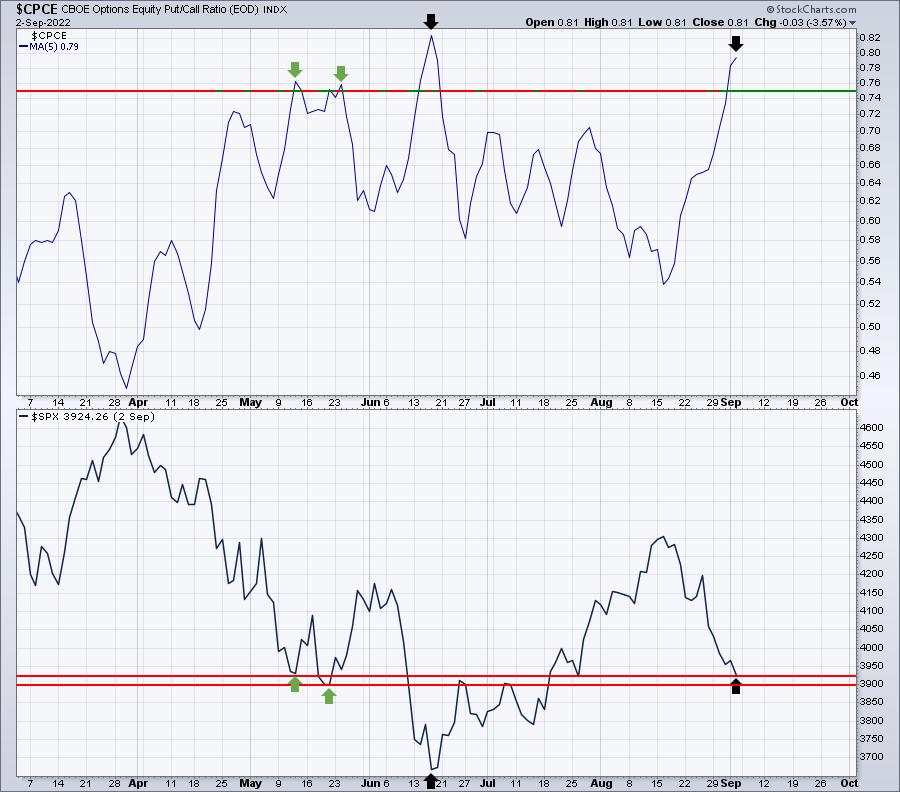
Historically, 5-day readings above .75 have marked key market bottoms since 2000. During the secular bear market, the 5-day CPCE moved higher into the .90s and even reached 1.0 in November 2008. But remember, the "base line" for the CPCE back then was much higher. I don't believe we're going to go from .37 to .90 or 1.00 as it would represent the most significant swings in sentiment ever - or at least over the last two decades.
Let's see if the 3900-3921 support holds. If it does, we could be primed for another fairly significant rally. I believe the initial resistance will be found from 4050-4100.
Happy trading!
Tom Bowley, Chief Market Strategist
EarningsBeats.com
"Better timing. Better trades."