
EB Weekly Portfolio Report - Saturday, September 10, 2022
Upcoming Earnings Reports
According to Zacks.com, the following companies will be reporting earnings this week and each is a component of one of our portfolios:
Monday, September 12: None
Tuesday, September 13: None
Wednesday, September 14: None
Thursday, September 15: None
Friday, September 16: None
PLEASE NOTE: The above companies were provided using Zacks.com. We do hold our portfolio stocks through one earnings report, but every EarningsBeats.com member must make his/her own investing/trading decisions about holding stocks into earnings reports as it's the most volatile (risky) time to own a stock.
Portfolio Rules and Objectives
Here are the common traits and objectives of our portfolios:
- There are 10 leading stocks from up to 10 leading industries in each portfolio (at the time of selection). Generally, there will only be one stock per industry group, but there could be exceptions.
- They are typically held for an entire 90-day period, with no stops in place. We strive for consistency, transparency, and simplicity in our portfolios. EB.com members may hold these stocks for the entire 90 days, trade them, use stops, etc., but for purposes of our calculation, we will make no exceptions to our "buy and hold for three months" strategy.
- Every stock will generally be held through ONE earnings report
- The expectation is that relative winners will carry the portfolio to outperformance
- They were all entered into as of the close on Friday, August 19th
- Primary objective is to outperform the benchmark S&P 500 over time; quarter-to-quarter performance can be extremely volatile, especially if significant rotation takes place intra-quarter
Here are several considerations for EB members:
- The Income Portfolio should have the least amount of volatility as it will typically be comprised of quality large cap stocks with solid dividends
- The Model and Aggressive Portfolios should be viewed similar to aggressive growth funds; they will typically have a lot of volatility and periodic drawdowns can be significant from time to time
- The Income portfolio stocks will all pay dividends, with the expected average dividend yield to be at least 1.0%
- Drawdowns (losses) should be much milder on the Income portfolio, with more volatility expected on the other two; please review inception-to-date charts below to gain an idea of the volatility associated with each
- I believe the larger drawdown on the Income portfolio at the beginning of the pandemic was an anomaly, occurring as many defensive, higher-yielding companies uncharacteristically underperformed during a market decline.
- Large drawdowns in the February through May 2021 and the November 2021 to February 2022 periods were due to the rapid rotation from growth stocks to value stocks; each quarter, our portfolios are based on themes and there is never a guarantee that our analysis and beliefs will be proven correct
- Consider owning or trading these stocks in whatever manner is most comfortable for you; while we will buy all 10 stocks in the manner identified above, feel free to trade certain stocks or wait for pullbacks if the stocks are overbought
- We have no idea what risk each member is willing or able to take. We are not registered investment advisors so be sure you understand the risk you take. Please consult your financial advisor.
- EarningsBeats.com shareholders/employees may own all or some of the portfolio stocks from time to time.
Weekly Snapshot
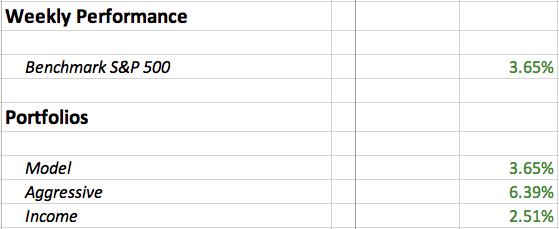
Here's a weekly recap:
Weekly Summary
Benchmark S&P 500:
I thought last week would be a defining week for the stock market. There is a LOT of support on the S&P 500 in the 3900-3921 area. Failure to hold that range would almost inevitably lead to a retest of the mid-June low. Clearly, that's still a possibility, but moving further and further away from this support range provides the stock market a bit of "room" to the downside, just in case the market's reaction is negative to the August CPI and PPI. These two key inflation reports will be released on Tuesday and Wednesday, respectively, of this week. The Fed has been telegraphing a 75 basis point rate hike when they meet in less than two weeks, but I believe these two reports could impact their policy statement. They've downplayed the tame July CPI and PPI reports, saying they need more than one month's data to change policy. Well, if the August reports are below expectations, do they alter their policy statement, potentially discussing the possibility of halting rate hikes at some point? Obviously, this would be very bullish for U.S. equities. But the other possibility is that inflation at the consumer and/or producer levels spikes again. What would Wall Street's reaction be to that? My guess is that it wouldn't be good. But maybe 3900 continues to provide support until we can work our way into Q4, historically the most bullish quarter of the year. Here's how the S&P 500 looks, including a peek at the 5-day moving average of the equity-only put-call ratio ($CPCE):
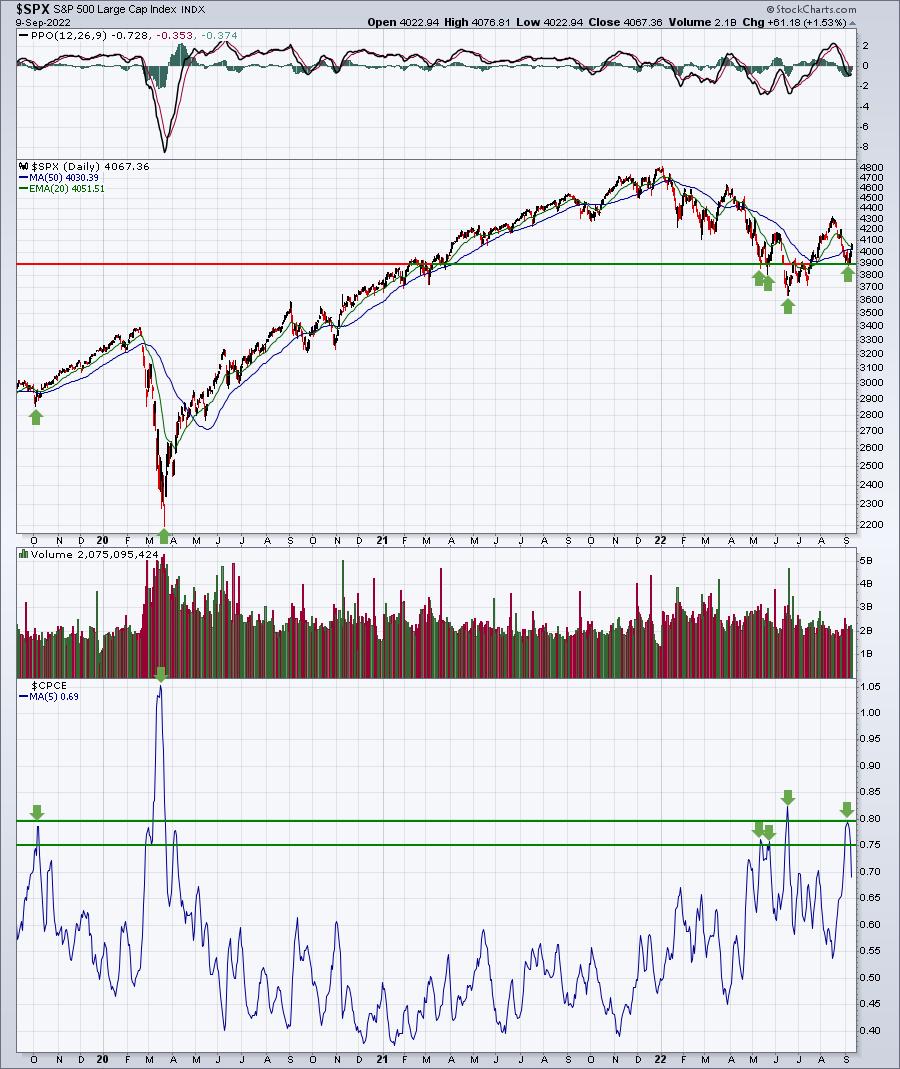
Any time the market is nervous - and I think it's fair to say the stock market has been nervous in 2022 - this sentiment indicator is an incredibly valuable tool to help us spot market bottoms to trade. We needed to "reset" sentiment from where we were to open 2022. We were simply too bullish. No one believed the stock market could go lower. What a difference 8 months make! Now no one believes we can go higher. That is the PERFECT environment from which to launch. My only question at this point is whether the historically-difficult month of September (especially the second half of the month) takes us lower one more time.
Buckle up, because if we do go down one more time, it's likely going to be with these upcoming inflation reports and the Fed meeting on September 20/21.
Model Portfolio:
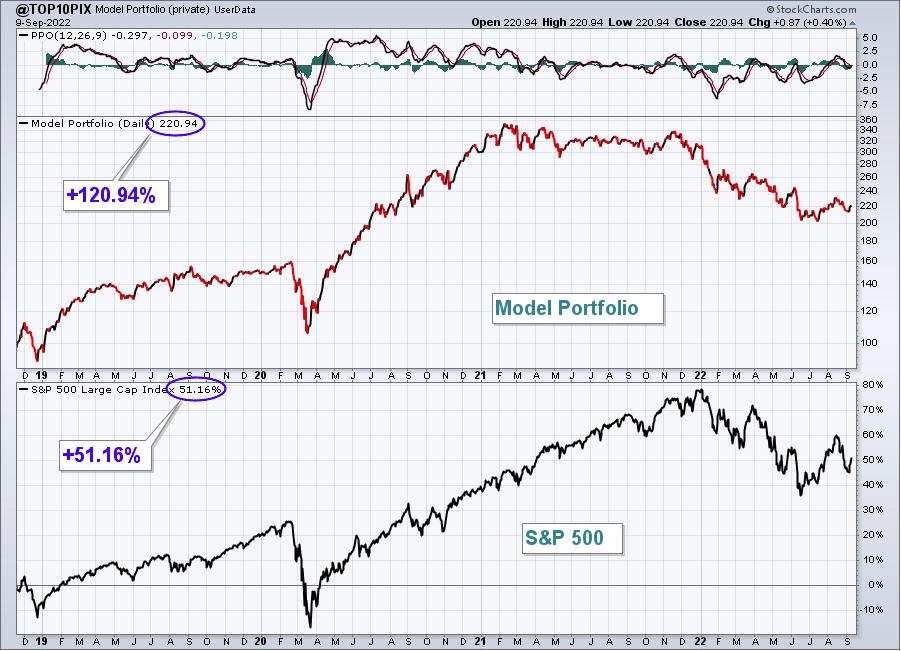
The Model Portfolio gained 3.65% last week, exactly mirroring the S&P 500. Here's the updated inception-to-date chart of the portfolio:
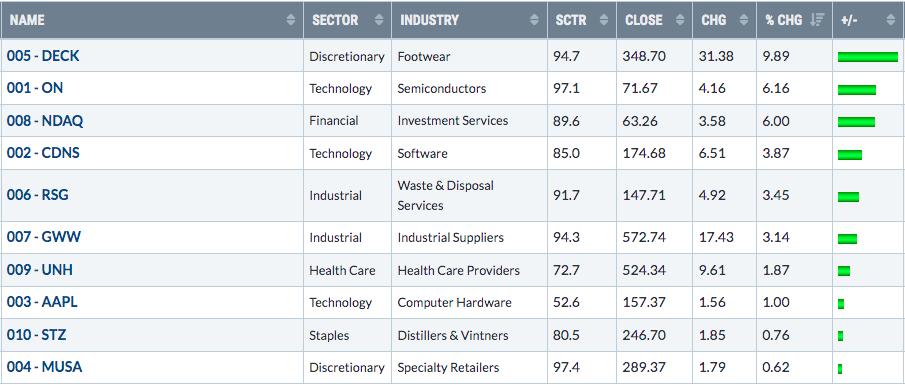
Here are how the Model Portfolio component stocks performed last week:
Aggressive Portfolio:
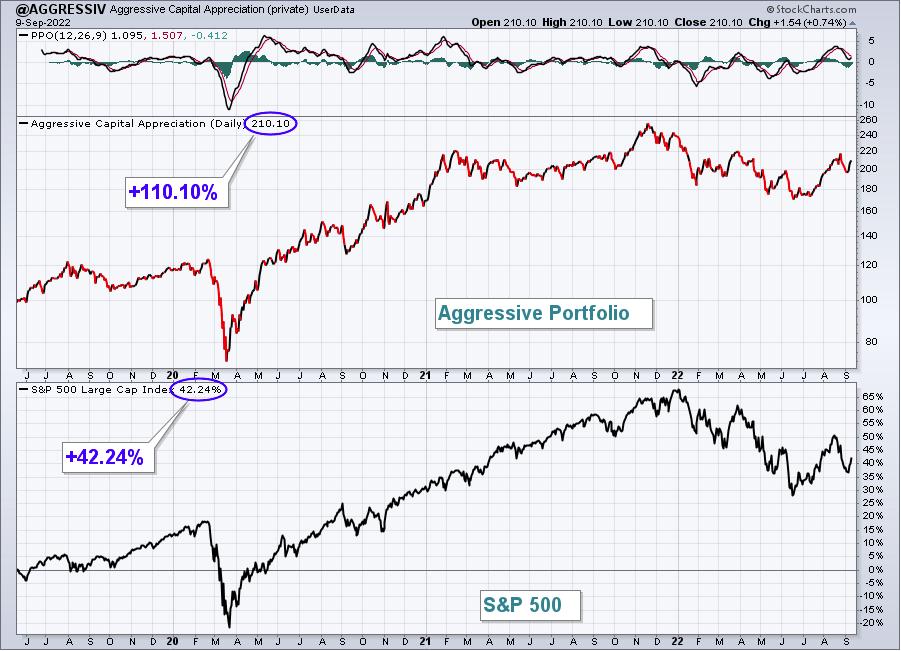
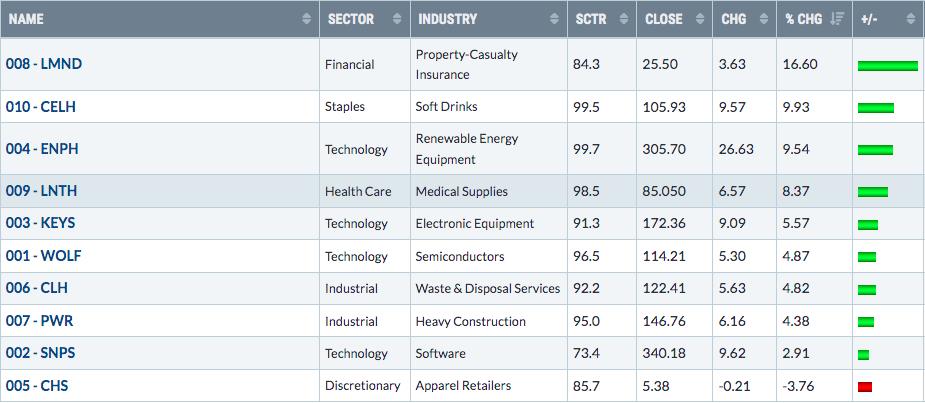
The Aggressive Portfolio surged 6.39% last week, easily outperforming the S&P 500. Here's the updated inception-to-date chart of the portfolio:
Here are how the Aggressive Portfolio component stocks performed last week:
Income Portfolio:
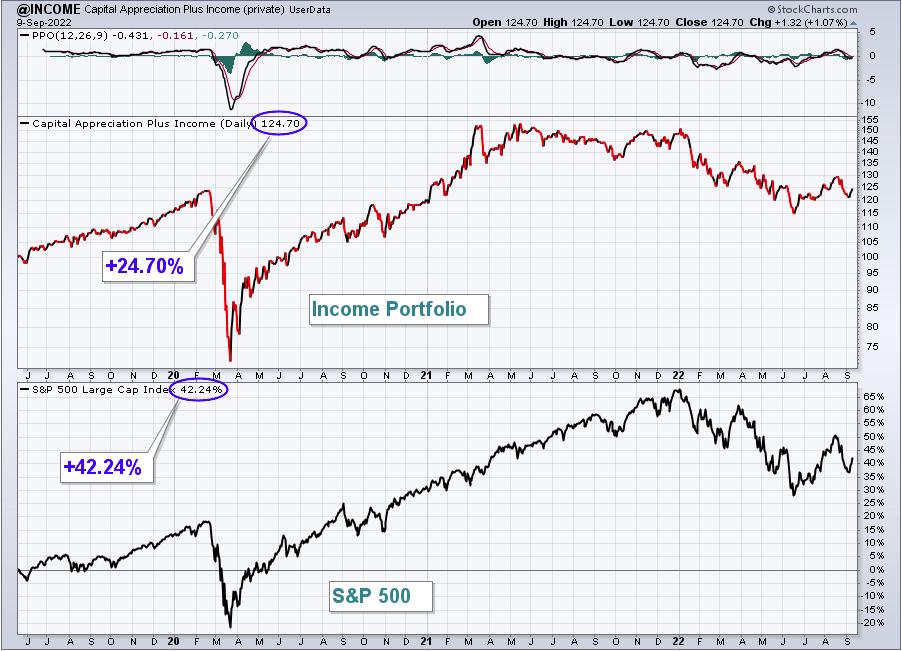
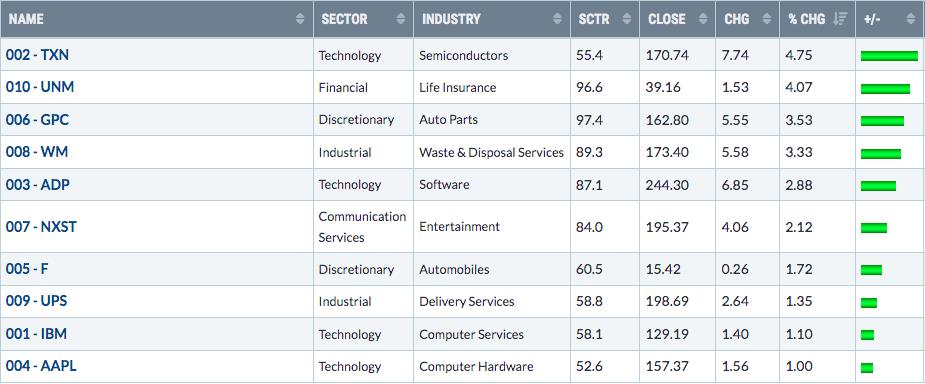
The Income Portfolio rebounded 2.51% last week, but did underperform the S&P 500.
Here's the updated inception-to-date chart of the portfolio:
Here are how the Income Portfolio component stocks performed last week:
Model ETF Portfolio
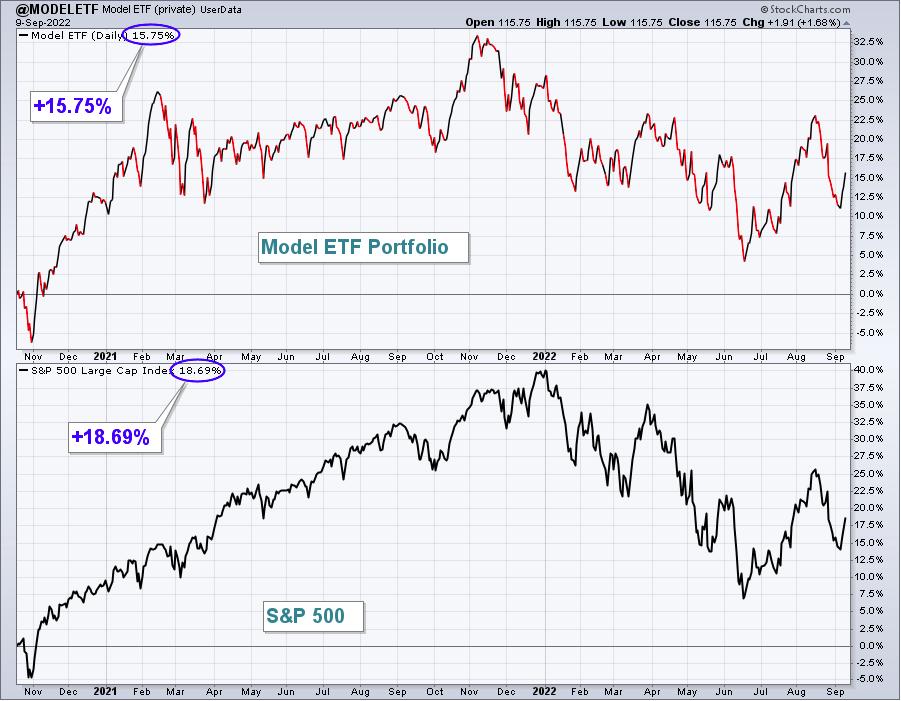
Our Model ETF Portfolio fell 3.26% last week, slightly beating the S&P 500.
Here's the updated inception-to-date chart of the Model ETF Portfolio:
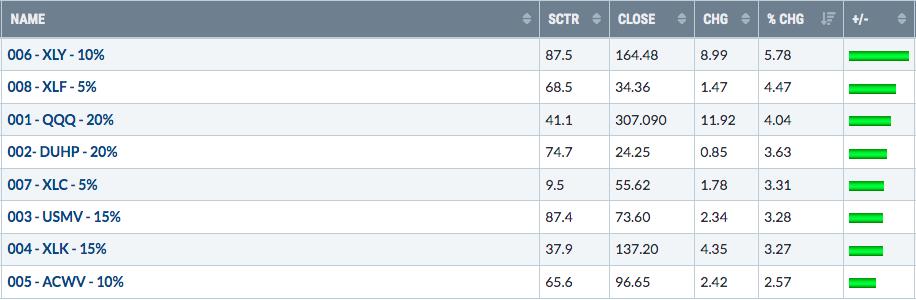
Here are how the Model ETF Portfolio components performed last week:
Model Trades
I will provide Model Trades each week in this Weekly Portfolio Report, which will simply be to outline possible trades based on key support, resistance, relative strength, and where these trades come from. For instance, my trading strategy for Strong AD ChartList (SADCL) stocks might be completely different than my trading strategy on Strong Earnings ChartList (SECL) stocks. Obviously, it would be different from a Short Squeeze ChartList (SSCL) trading candidate. I'll lay out the annotated chart and my reasoning for the (potential) trade. In the following week's EB Weekly Portfolio Report, I'll grade each of the prior week's Model Trades. Grades will generally be based on how these trades performed relative to the S&P 500. Feel free to trade these stocks in a similar manner or according to your own trading strategy. Or ignore them. It's completely up to you. I am not a Registered Investment Advisor (nor is EarningsBeats.com). THESE TRADING CANDIDATES SHOULD NOT BE VIEWED AS INVESTMENT ADVICE.
I view EarningsBeats.com as a market research, market guidance, and market education platform. We do not attempt, in any fashion, to manage anyone's money. We have no idea the risk tolerance of each of our members, nor do we have any idea of your financial goals and objectives. It would be irresponsible for us to provide advice to any of our members. Therefore, please consult your own financial advisor before considering any buy/sell decisions. You are completely responsible for the financial decisions that you make.
Last week's featured Model Trades
These were the trade setups from last week:
RUN (from SECL):
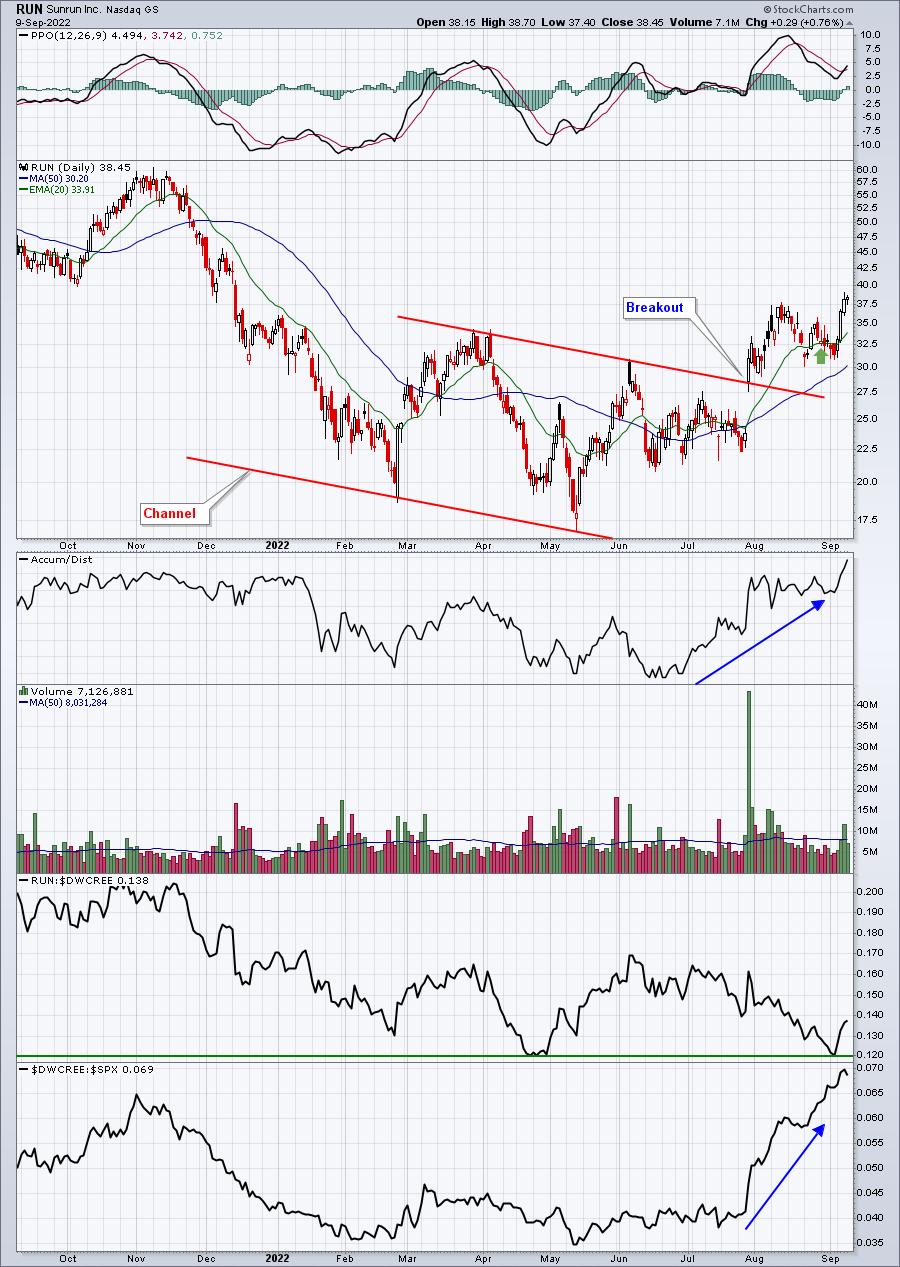
My argument last week: We actually had RUN as a Model Trade for two weeks. Here's what I said two weeks ago - "RUN is part of a very strong renewable energy group ($DWCREE). While it's not the best performer within the group, I do love the MASSIVE volume that accompanied its recent channel breakout. Pulling back to the 20-day EMA presents an opportunity. RUN is quite aggressive, so buying at the 20-day EMA and again on any weakness down to 30.00 would be a possible strategy. Any close beneath the 50-day SMA and I'd exit."
Result: RUN finally RAN after we showed a little patience. We took very nice 10+% profits, but the closing breakout above 37.38 resistance could be plenty of reason to hold the stock for many traders. It's simply too hard to turn down big profits in a short period of time. So we took profits.
Grade: A
NET (from RGCL and EADCL):
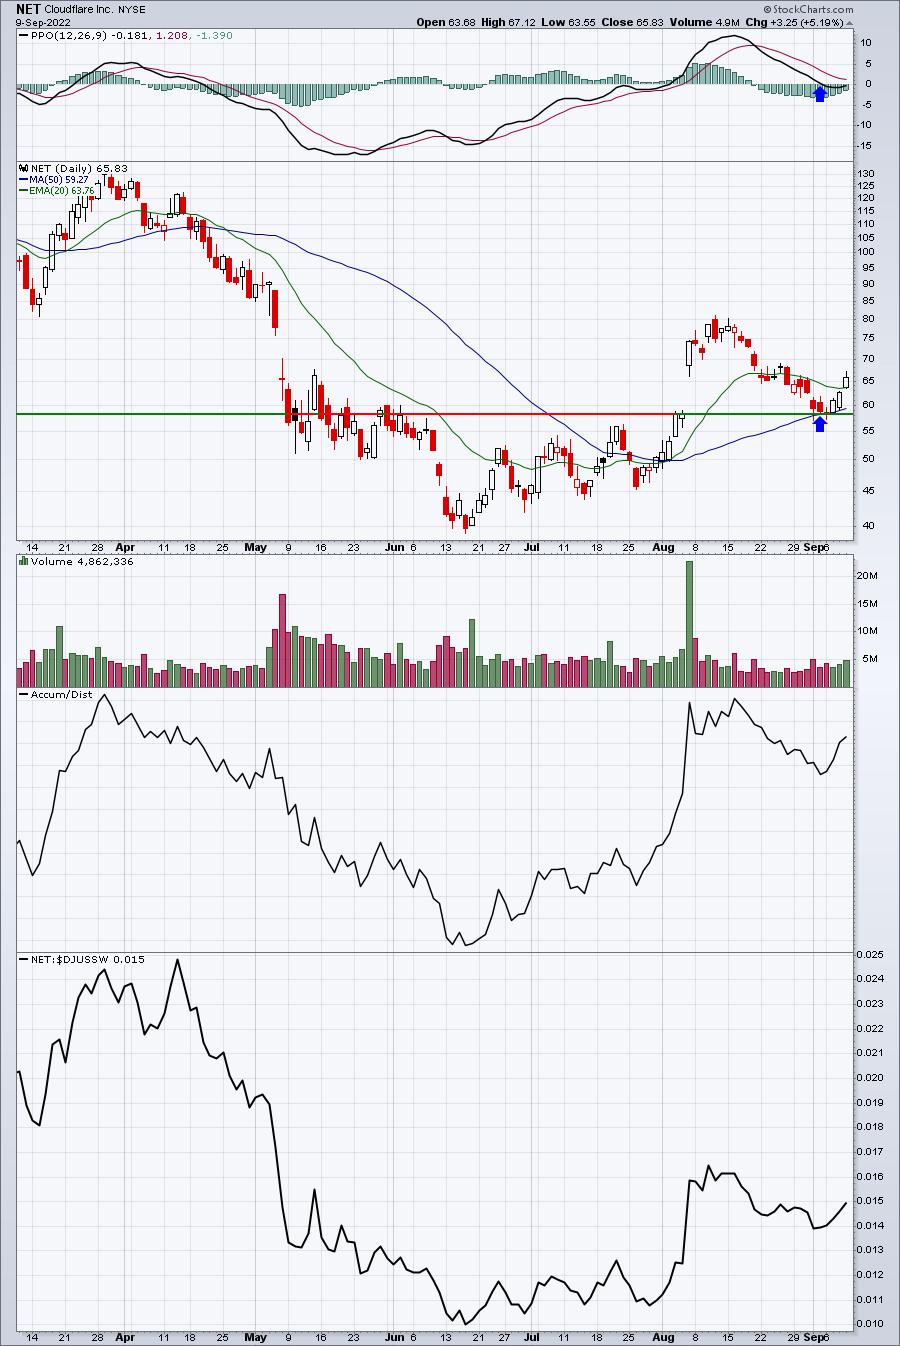
My argument last week: "When NET reported its quarterly results in early August, it gapped much, much higher on the biggest volume of the year. On Thursday and Friday of last week, NET hit intraday lows just beneath gap support at 58.43. NET traded above 80 after its earnings, now we have the chance to buy at gap support. I love the reward to risk here, but clearly we'll need a better market environment to increase our chance of success with any trade. The 50-day SMA is 58.16. Any CLOSE beneath both gap support at 58.43 AND the 50-day SMA would trigger a sell. Initial resistance could be felt at the 20-day EMA, currently at 64.49."
Result: At EarningsBeats.com, our tag line is "Better Timing. Better Trades." NET perfectly exemplified our tag line. I've mentioned that I LOVE trading earnings gaps. That's where new information is released to the stock market and we typically see big gaps, either up or down, based on this new information. Many times, a return to either the top or bottom of gap support can provide excellent reward-to-risk entry points. NET bounced beautifully off gap support. In our Friday DMR, we indicated that we were taking profits at 66.88, representing a 14.68% gain.
Grade: A+
GSHD (from EADCL):
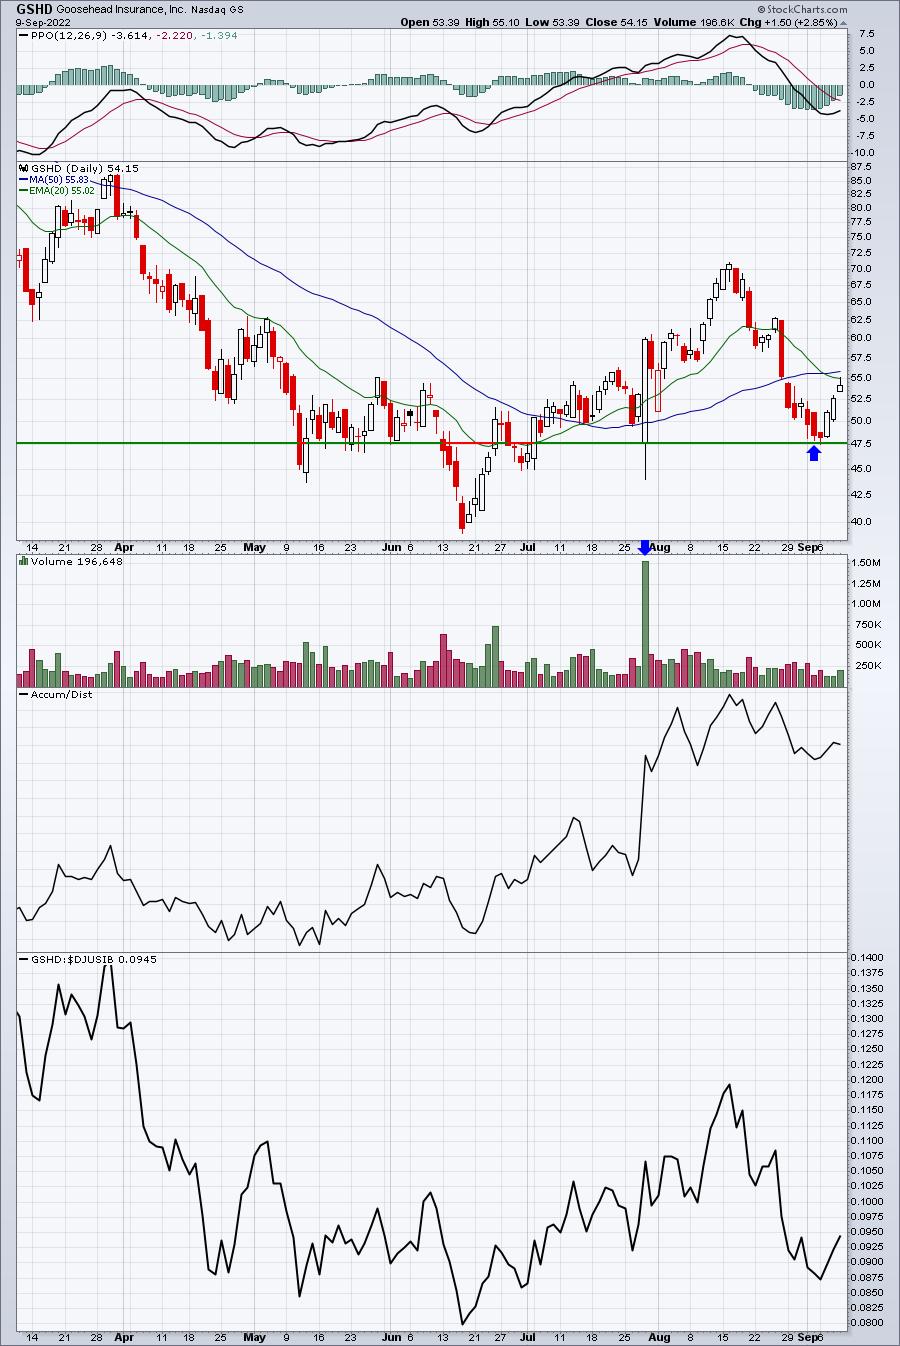
My argument last week: "47.70 is key support on GSHD. After reporting quarterly results, the stock gapped lower, but the ensuing rally back to 70+ was powerful. Insurance brokers ($DJUSIB), in general, were rallying back then, so if 47.70 is lost on a closing basis, it'll trigger a SELL. Otherwise, a trip back to test the key 20-day EMA and/or 50-day SMA is what I'd look for."
Result: GSHD was another trade off of key gap support that was triggered by earnings. It bounced exactly where we expected at 47.70. We took profits at the 20-day EMA, which was 55.01. That trade resulted in a 13.29% profit.
Grade: A+
TTMI (from SECL, SADCL, RGCL, BTCL)
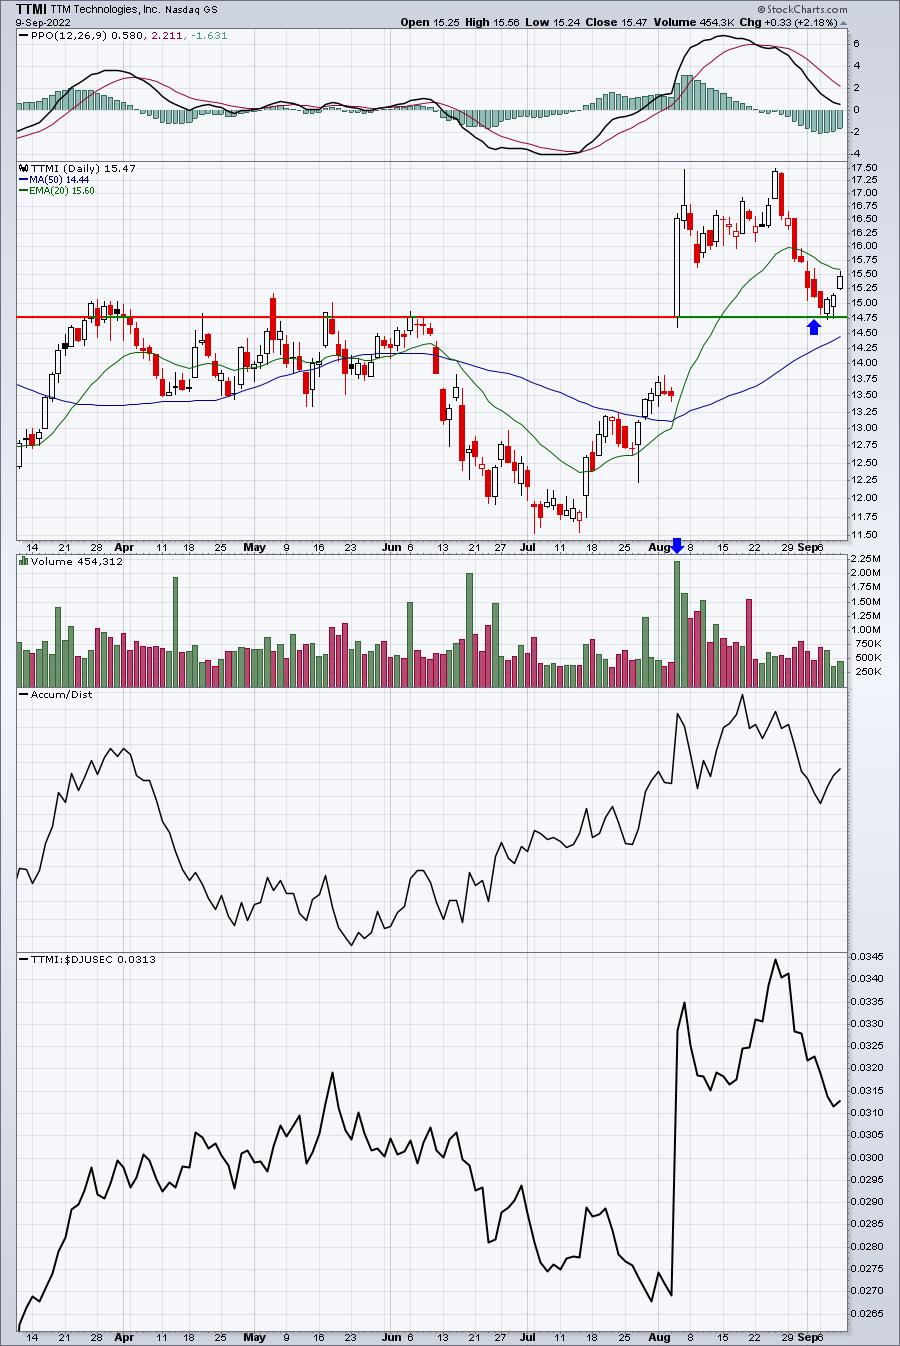
My argument last week: "14.76 is key gap support. If TTMI hits that level, we'd be a buyer. A close beneath 14.76 and we'd exit. A recovery back to 15.55-15.73 would be an opportunity for a quick profit. A close above that range would be very bullish."
Result: TTMI was a 3rd trade from last week, where gap support provided an excellent entry at 14.76. When TTMI moved close (15.53) to our initial target range of 15.55-15.73, we decided to exit and take the profits and run. That resulted in a 5.22% profit.
Grade: A-
WOLF (from Aggressive Portfolio, SECL, SADCL, RGCL, BTCL)
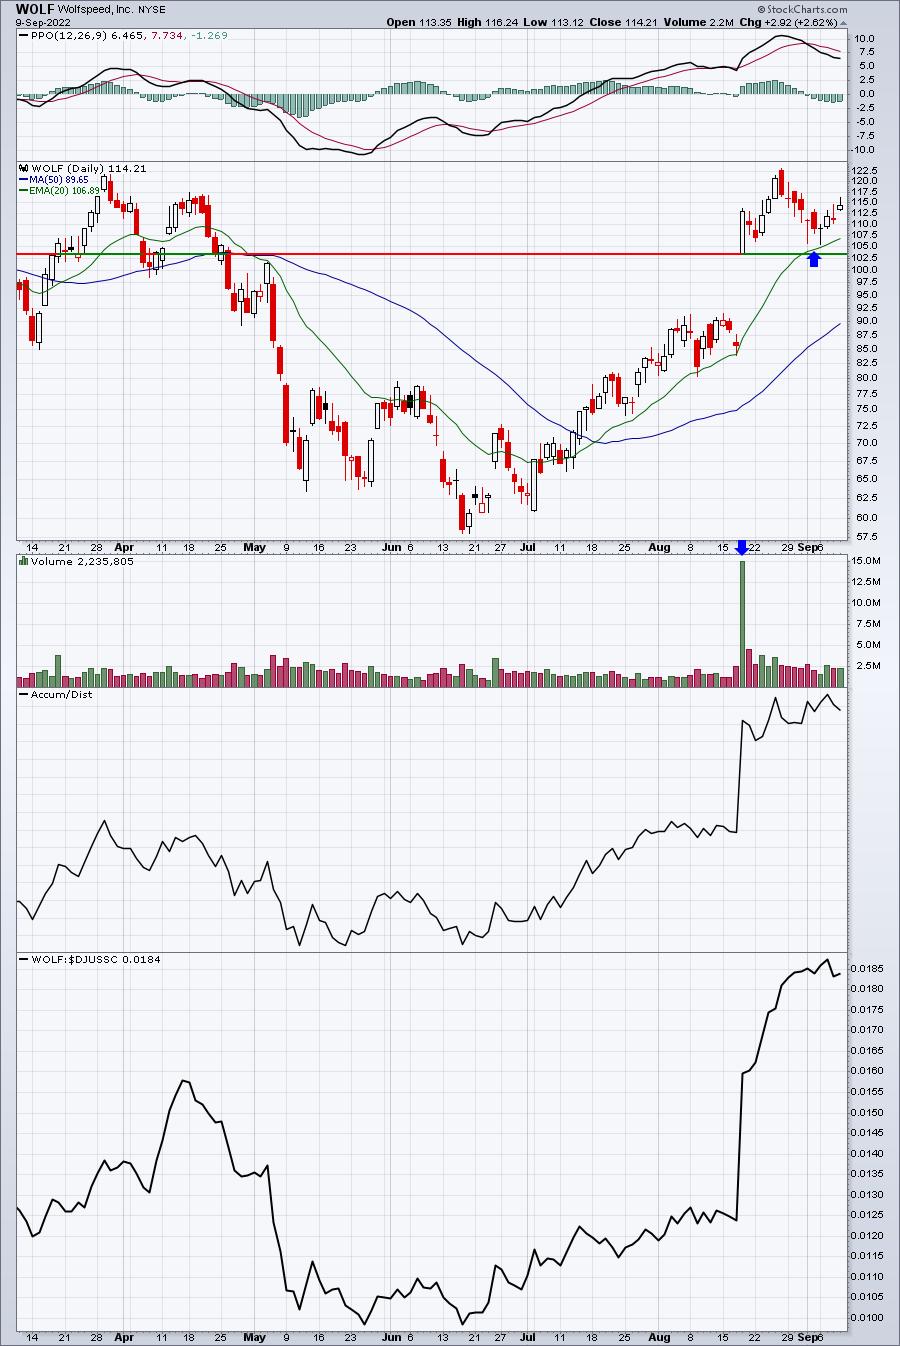
My argument last week: "WOLF is definitely aggressive, but it's one of the best-performing semiconductor stocks right now. I like two entries - first at the current price and the second on a 20-day EMA test. I'd use a closing stop of 103.58 (top of gap support). A move back to 120-122 is what I'd look for here."
Result: In addition to loving to trade gaps, I also LOVE to trade our portfolio stocks. They're portfolio stocks for a reason. I believe they're among the best stocks in the market, based on relative strength. So any time I can buy them at or near a key support level or area, I'll typically do it. WOLF did not hit our target, but it did bounce very nicely to 116.24 at its intraday high on Friday. When our DMR went out, WOLF was trading at 114.36, which was 6.68% higher than our average entry price of 107.20.
Grade: B+ (WOLF was an aggressive trade, so walking away with a tidy 6.68% is nice, but because of the additional risk in trading a semiconductor stock, I'd like to have earned at least 10% to get an A on our report card)
This week's featured Model Trades:
It's very important to understand that trading ANYTHING in the week ahead will carry more risk now that the stock market has already bounced off key 3900 support. Also, the biggest short-term gains may have already been achieved from the extreme sentiment reading (5-day moving average of $CPCE) that indicated a potential short-term bottom last week. Throw in the CPI and PPI reports this week and we could be prime for big gaps in either (or both) directions. I mentioned last week that I closed my leveraged QLD position for these same reasons. Switching back to the QQQ makes sense if you want to be long. Leveraging simply increases the risk in a week where we are already trading with higher risk. Trade with leverage at your own risk.
Be prepared for potential whipsaw action. We might see trades get stopped out and then move right back up. It'll be difficult to guard against that. For those familiar with options strategies, covered calls might make sense. If you want to hold your stock, but you're nervous about the upcoming week, selling calls against your position is one way to benefit from further upside, but help to offset downside risk.
Trading stocks in defensive sectors might help to reduce risk as well. Growth stocks that had big jumps last week are likely to be solid performers in the weeks and months to come (in my opinion), but this upcoming week? Well, that could be a different story. I wouldn't be shocked to see stocks like NET continue moving higher, but if the market turns more defensive next week, stocks like NET could give back their entire gain from last week.
Given this uncertainty, I am taking a more cautious approach to our Model Trades for this week. Here are our trade candidates:
STZ (from Model Portfolio, SECL and SADCL):
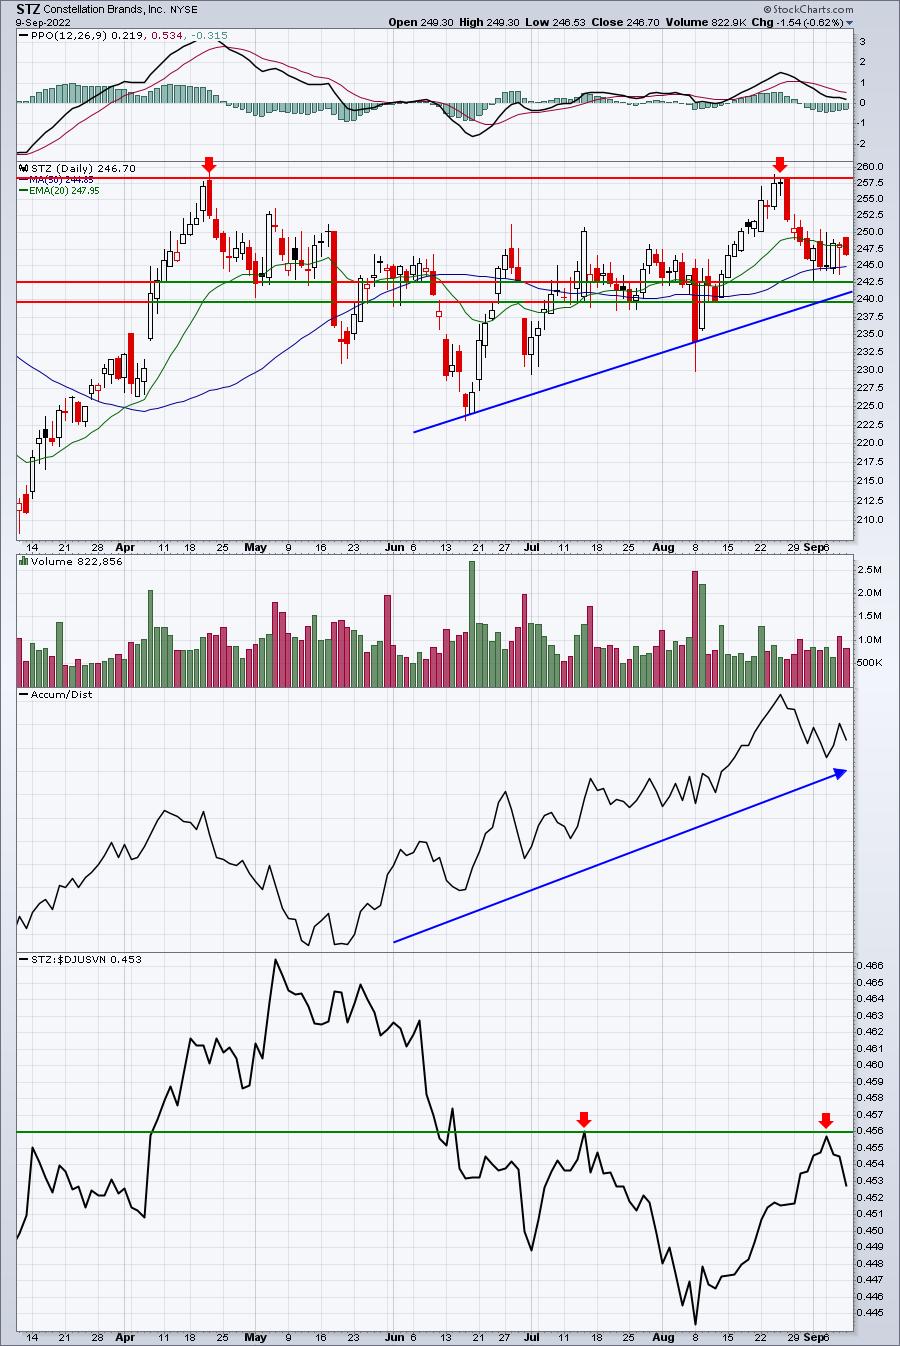
Entry prices help to dictate the risk you're willing to take. For example, to lessen risk, you can wait to enter STZ in the key support zone from 240.00-242.50. But what happens if it doesn't get there? Well, that's a risk too. This will be our strategy: Entry 1 - opening price on Monday morning. Entry 2 - 240.30. Closing stop: 239.84. Target: 258.00. A quick look at max pain would support buying at our two entry points as max pain is near 250.
SJM (from SECL and RGCL):
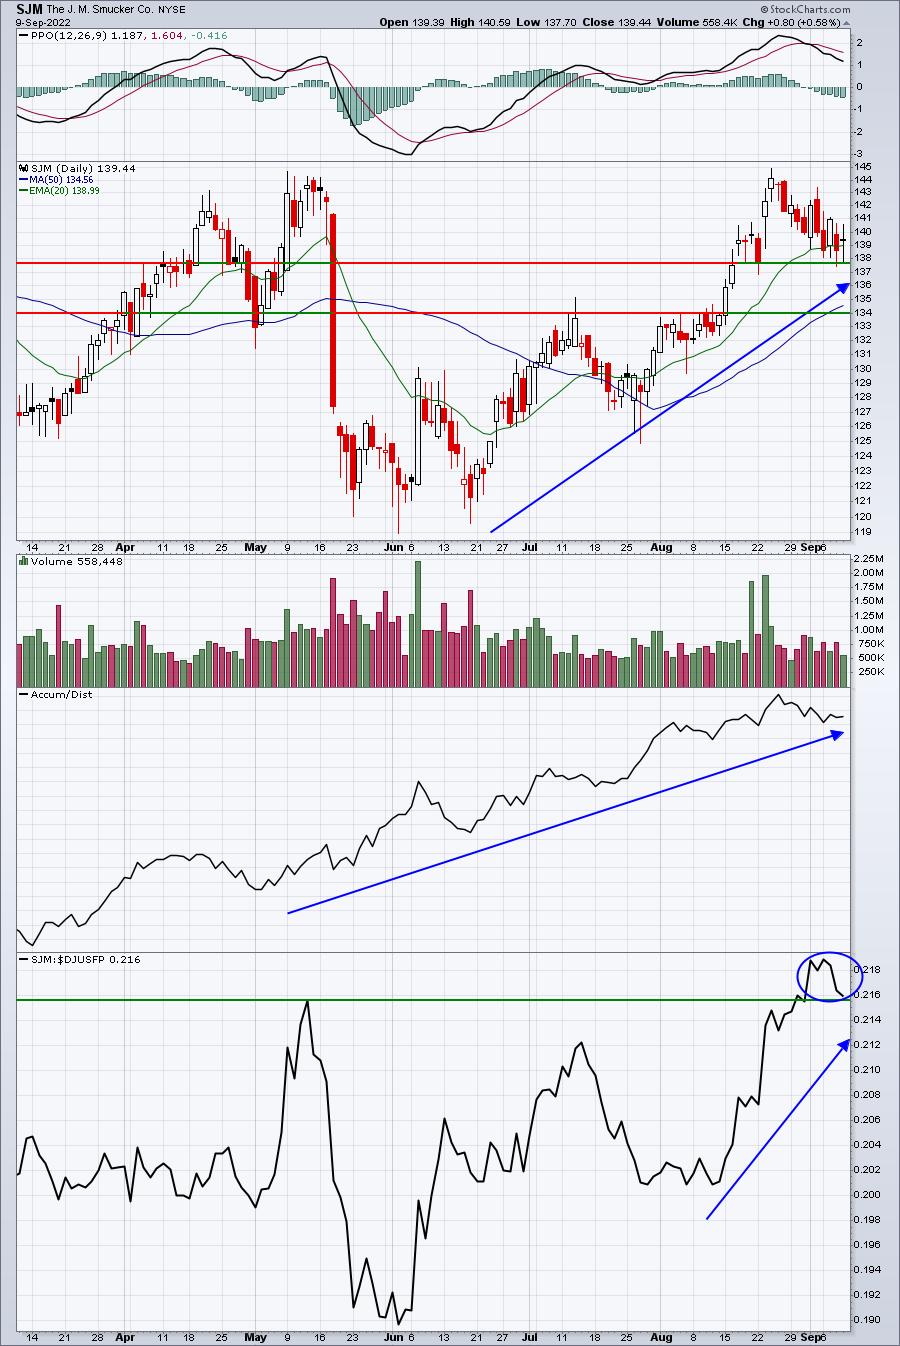
SJM is a leader in the food products space ($DJUSFP) and this industry didn't participate much last week. If things turn more defensive next week, SJM could be a beneficiary. I like two support levels. The first is gap support at 137.75. The second was the mid-August breakout above the prior price resistance at 133.91. Our strategy will be to take our full position at the opening bell on Monday, but using a second entry just below 134 makes sense too to provide a little cushion and average down. Keep in mind that SJM is on our Strong AD ChartList (SADCL). That suggests that morning weakness is buyable. Therefore, a quick selloff on Monday morning might make sense as well, but we will enter at the opening bell. Our target will be 144 and our closing stop will be tight at 137.75 gap support (from earnings).
NVDA (from SADCL):
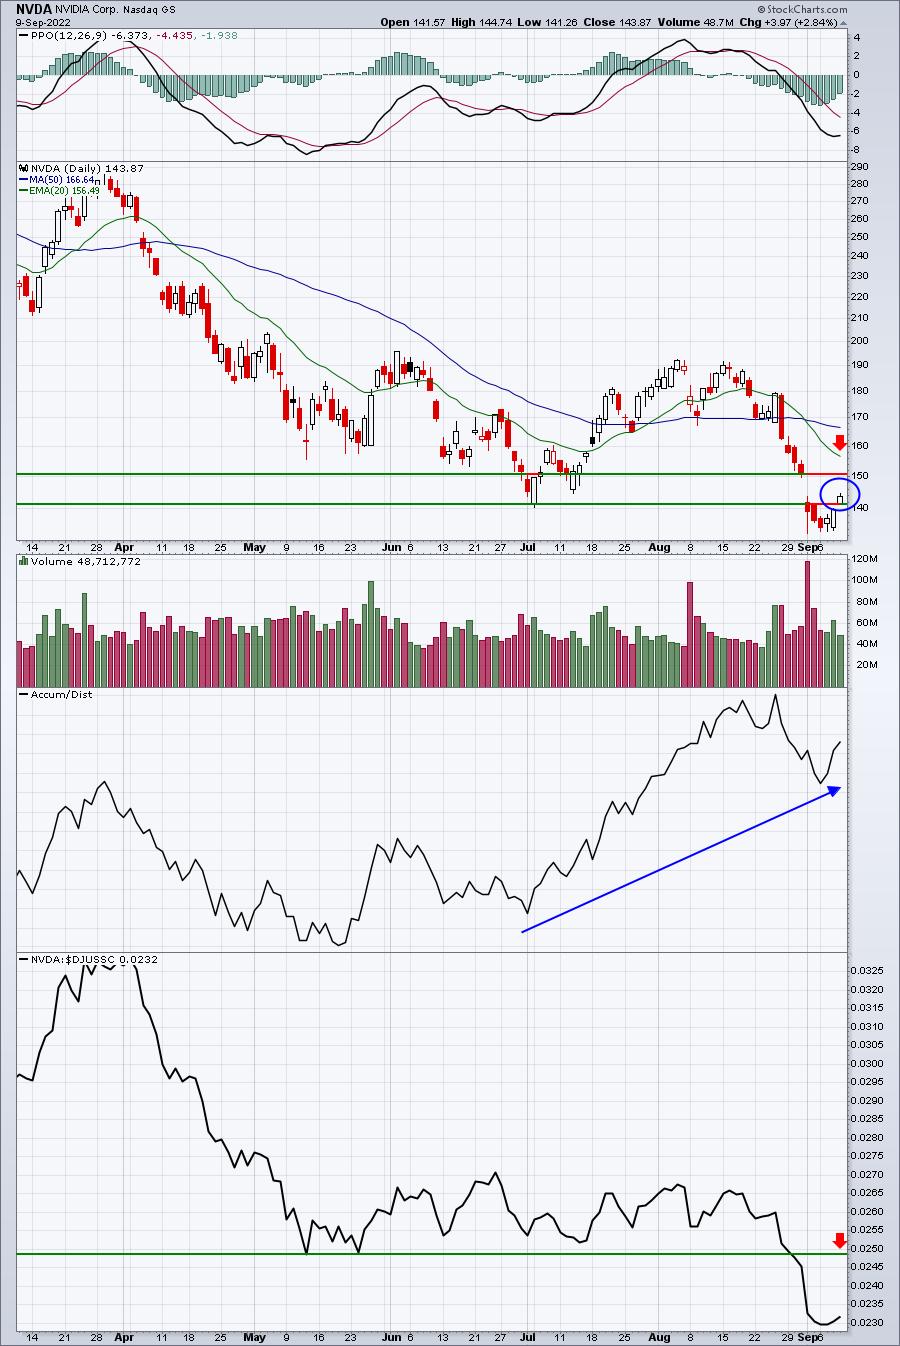
Ok, this one is aggressive. Semiconductors ($DJUSSC) have not performed well and they could fall apart next week. However, it is options-expiration week and many of these semiconductors, including NVDA, have a TON of net in-the-money put premium, suggesting a quick move higher shouldn't be ruled out - before further selling later.
Here's what I like. NVDA managed to clear both price resistance and gap resistance at Friday's close. If growth stocks survive the two inflation reports, NVDA could be in position to make a big run. Its max pain price is 156.44, which is almost EXACTLY the 20-day EMA. There is nearly $180 million of net in-the-money put premium, so there's clearly financial incentive for market makers to drive NVDA's price higher in the near-term. Will it happen? Well, it's no guarantee, that's for sure. But I wouldn't bet against the market makers if money is on the table. Our strategy would be to buy NVDA at Monday's open, then again if we see selling to take NVDA down to Thursday's (close) gap support at 139.91. We'll keep a closing stop at 134 and our target would be a test of the 20-day EMA.
The Week Ahead
All eyes will turn to the August CPI and PPI reports on Tuesday and Wednesday. Now that we've seen a nice rally the past few sessions, I'd consider the S&P 500's current trading range to be 3900 to the downside and 4200 to the upside. Options expire this Friday, September 16th, and there's a mixed picture for our key indices. The SPY, which tracks the S&P 500, shows max pain about 0.5% below current price. Meanwhile, the QQQ, which tracks the NASDAQ 100, shows max pain roughly 2% above current price. I suspect that whichever way the market moves into the beginning of the week, we'll likely see an opposite move into the end of the week or Monday/Tuesday of the following week.
One positive piece of rotation recently has been the solid advance of the XLY:XLP ratio. That's suggesting we're going higher. It may not be this week, or this month, but it's sending a rather bullish signal for year end.
Happy trading!
Tom Bowley, Chief Market Strategist
EarningsBeats.com
"Better timing. Better trades."