
EB Weekly Portfolio Report - Saturday, September 17, 2022
Upcoming Earnings Reports
According to Zacks.com, the following companies will be reporting earnings this week and each is a component of one of our portfolios:
Monday, September 19: None
Tuesday, September 20: None
Wednesday, September 21: None
Thursday, September 22: None
Friday, September 23: None
PLEASE NOTE: The above companies were provided using Zacks.com. We do hold our portfolio stocks through one earnings report, but every EarningsBeats.com member must make his/her own investing/trading decisions about holding stocks into earnings reports as it's the most volatile (risky) time to own a stock.
Portfolio Rules and Objectives
Here are the common traits and objectives of our portfolios:
- There are 10 leading stocks from up to 10 leading industries in each portfolio (at the time of selection). Generally, there will only be one stock per industry group, but there could be exceptions.
- They are typically held for an entire 90-day period, with no stops in place. We strive for consistency, transparency, and simplicity in our portfolios. EB.com members may hold these stocks for the entire 90 days, trade them, use stops, etc., but for purposes of our calculation, we will make no exceptions to our "buy and hold for three months" strategy.
- Every stock will generally be held through ONE earnings report
- The expectation is that relative winners will carry the portfolio to outperformance
- They were all entered into as of the close on Friday, August 19th
- Primary objective is to outperform the benchmark S&P 500 over time; quarter-to-quarter performance can be extremely volatile, especially if significant rotation takes place intra-quarter
Here are several considerations for EB members:
- The Income Portfolio should have the least amount of volatility as it will typically be comprised of quality large cap stocks with solid dividends
- The Model and Aggressive Portfolios should be viewed similar to aggressive growth funds; they will typically have a lot of volatility and periodic drawdowns can be significant from time to time
- The Income portfolio stocks will all pay dividends, with the expected average dividend yield to be at least 1.0%
- Drawdowns (losses) should be much milder on the Income portfolio, with more volatility expected on the other two; please review inception-to-date charts below to gain an idea of the volatility associated with each
- I believe the larger drawdown on the Income portfolio at the beginning of the pandemic was an anomaly, occurring as many defensive, higher-yielding companies uncharacteristically underperformed during a market decline.
- Large drawdowns in the February through May 2021 and the November 2021 to February 2022 periods were due to the rapid rotation from growth stocks to value stocks; each quarter, our portfolios are based on themes and there is never a guarantee that our analysis and beliefs will be proven correct
- Consider owning or trading these stocks in whatever manner is most comfortable for you; while we will buy all 10 stocks in the manner identified above, feel free to trade certain stocks or wait for pullbacks if the stocks are overbought
- We have no idea what risk each member is willing or able to take. We are not registered investment advisors so be sure you understand the risk you take. Please consult your financial advisor.
- EarningsBeats.com shareholders/employees may own all or some of the portfolio stocks from time to time.
Weekly Snapshot
Here's a weekly recap:
Weekly Summary
Benchmark S&P 500:
Last week, I discussed the significance of the short-term rally that took the S&P 500 well above 3900. That provided us a cushion in the event that the CPI and PPI data showed a spike in inflation. Well, we saw that big spike in Core CPI in pre-market on Tuesday and that triggered a HUGE selloff. Fortunately, we did manage to hold key 3900 support on the S&P 500.....until Friday. FedEx (FDX) issued a big warning after the closing bell on Thursday and the S&P 500 gapped down to 3880.95 and then proceeded to drop to 3837 intraday, before rallying in the afternoon to finish at 3873. The close beneath 3900 was a technical breakdown. However, it was nice to see the S&P 500 rally in the afternoon. That's been a theme over the past few months and I believe it to be very bullish down the road. The big question as we start a new week is "can we reclaim that 3900 level?" Also, what impact will the Fed meeting on Tuesday/Wednesday have? The market has already braced for a 75 basis point hike. There's chatter of a full percentage point hike. If the Fed does that, I believe we'll see a BIG selloff, possibly down to test the mid-June low. If the Fed does what the market is expecting, however, I wouldn't be surprised to see a bit of a relief rally. We'll have the inflation reports and the Fed behind us and should be able to begin focusing on earnings. While they're not likely to be great, there's a stock market history of pre-earnings run ups.
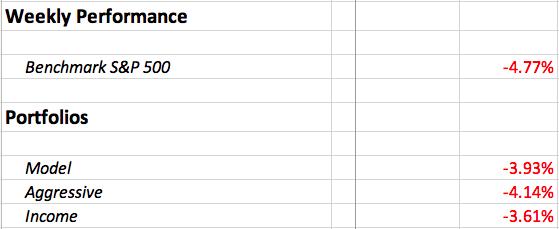
For the week, the S&P 500 lost 4.77% and 5 sectors lost more than 6%, including both communication services (XLC, -6.26%) and technology (XLK, -6.19%). The bears were clearly in control.
Model Portfolio:
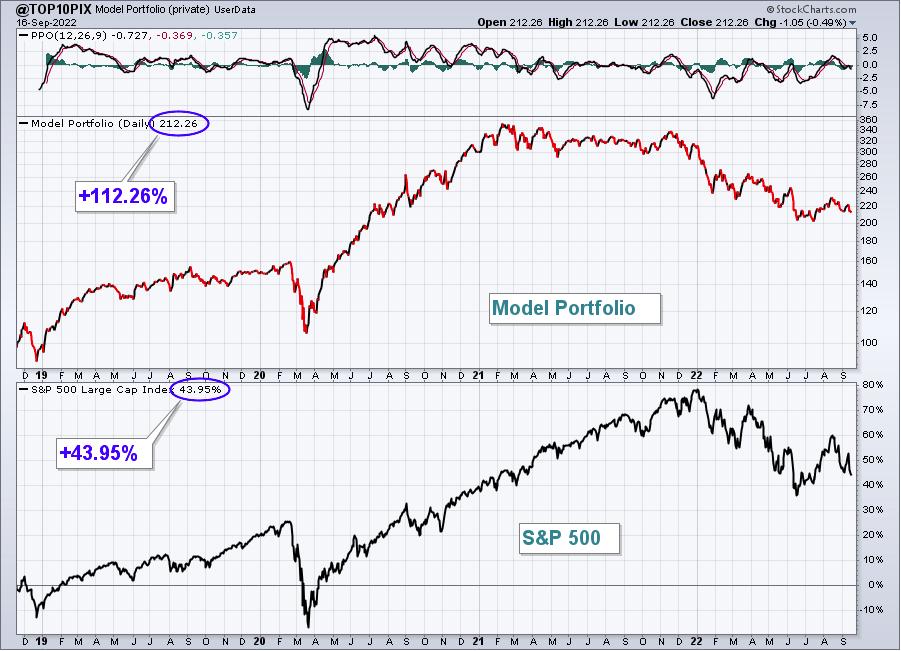
The Model Portfolio fell 3.93% last week, outperforming the S&P 500. Here's the updated inception-to-date chart of the portfolio:
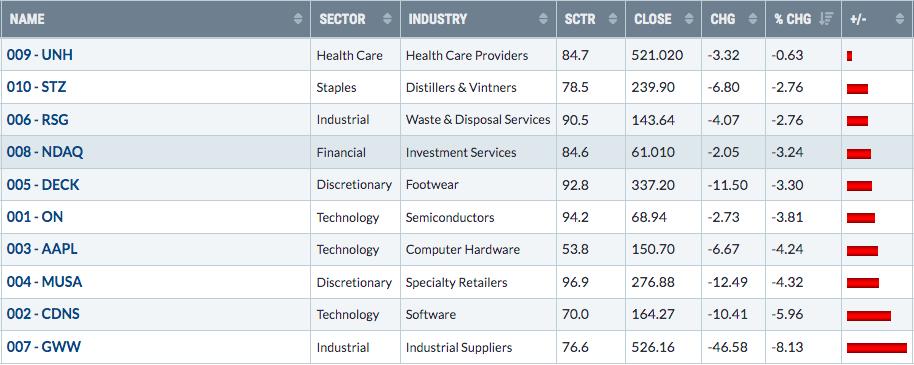
Here are how the Model Portfolio component stocks performed last week:
Aggressive Portfolio:
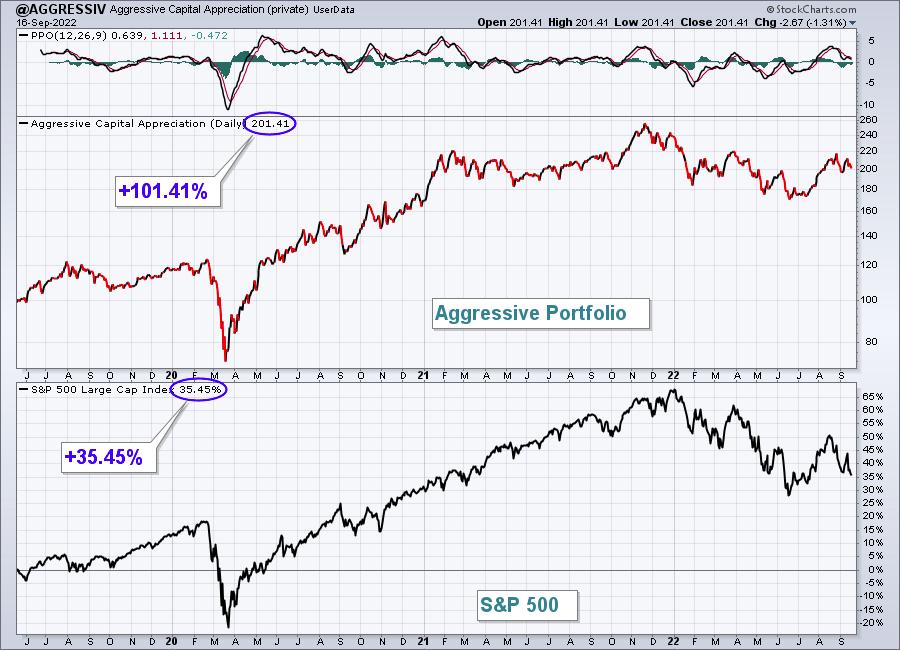
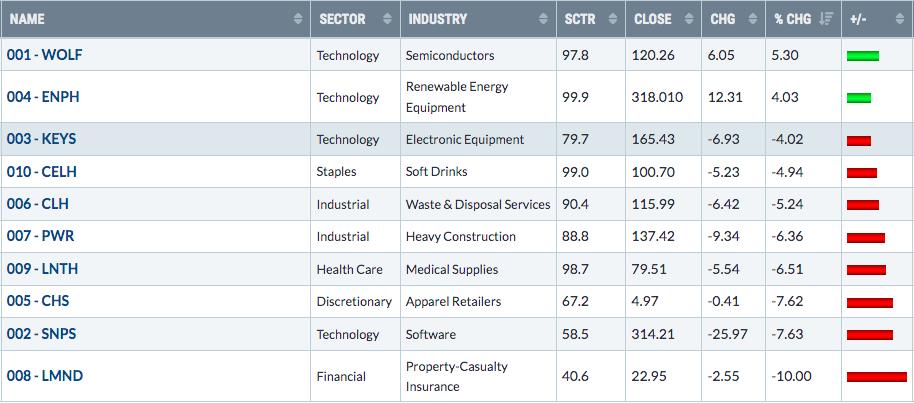
The Aggressive Portfolio dropped 4.14% last week, outperforming the S&P 500. Here's the updated inception-to-date chart of the portfolio:
Here are how the Aggressive Portfolio component stocks performed last week:
Income Portfolio:
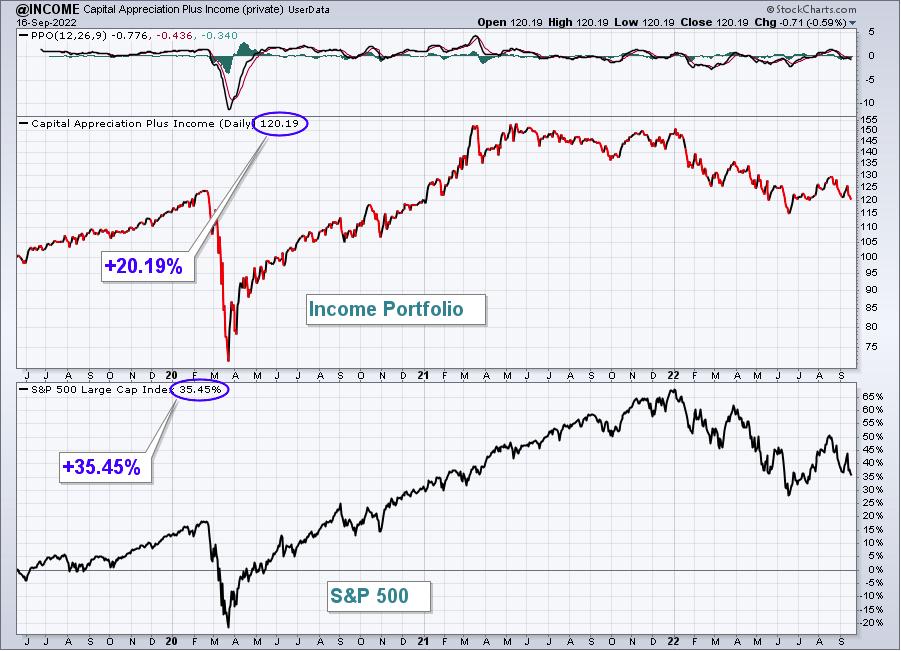
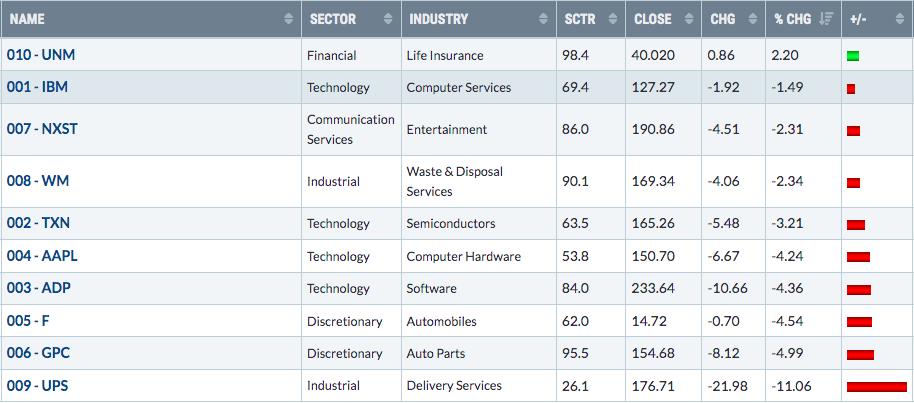
The Income Portfolio lost 3.61% last week, outperforming the S&P 500.
Here's the updated inception-to-date chart of the portfolio:
Here are how the Income Portfolio component stocks performed last week:
Model ETF Portfolio
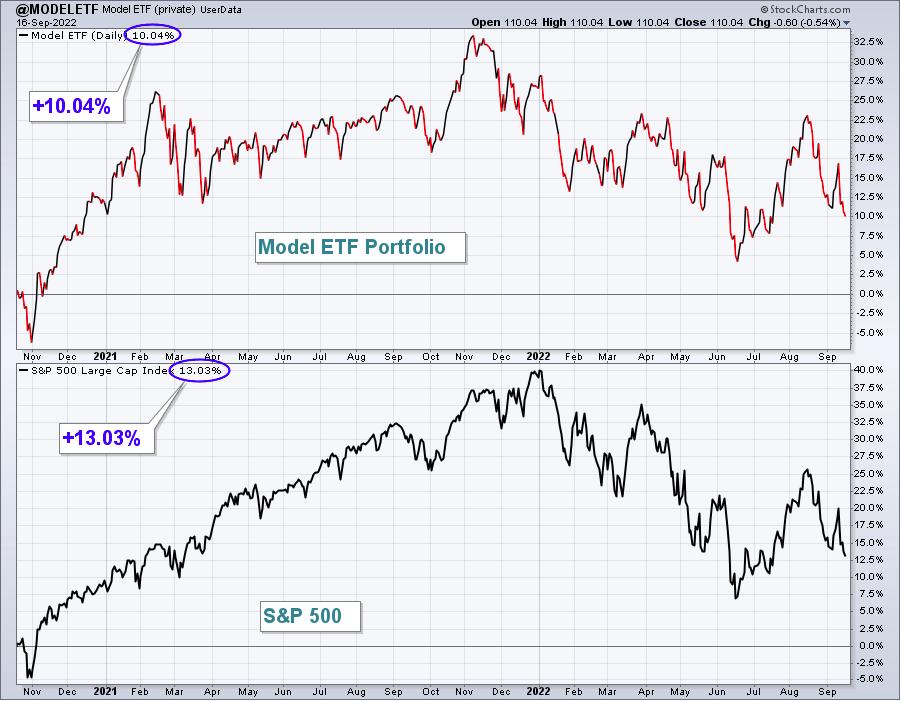
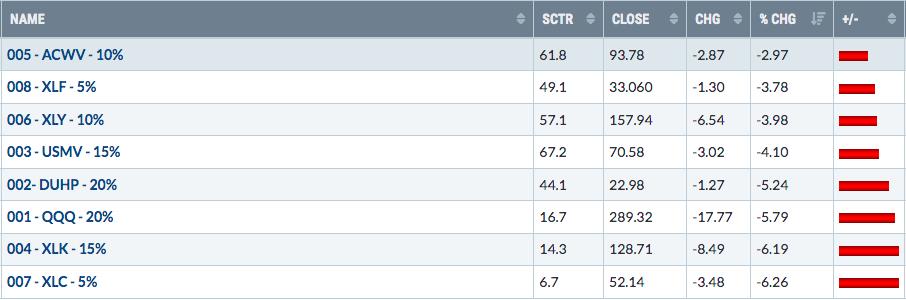
Our Model ETF Portfolio tumbled 4.93% last week, slightly underperforming the S&P 500.
Here's the updated inception-to-date chart of the Model ETF Portfolio:
Here are how the Model ETF Portfolio components performed last week:
Model Trades
I will provide Model Trades each week in this Weekly Portfolio Report, which will simply be to outline possible trades based on key support, resistance, relative strength, and where these trades come from. For instance, my trading strategy for Strong AD ChartList (SADCL) stocks might be completely different than my trading strategy on Strong Earnings ChartList (SECL) stocks. Obviously, it would be different from a Short Squeeze ChartList (SSCL) trading candidate. I'll lay out the annotated chart and my reasoning for the (potential) trade. In the following week's EB Weekly Portfolio Report, I'll grade each of the prior week's Model Trades. Grades will generally be based on how these trades performed relative to the S&P 500. Feel free to trade these stocks in a similar manner or according to your own trading strategy. Or ignore them. It's completely up to you. I am not a Registered Investment Advisor (nor is EarningsBeats.com). THESE TRADING CANDIDATES SHOULD NOT BE VIEWED AS INVESTMENT ADVICE.
I view EarningsBeats.com as a market research, market guidance, and market education platform. We do not attempt, in any fashion, to manage anyone's money. We have no idea the risk tolerance of each of our members, nor do we have any idea of your financial goals and objectives. It would be irresponsible for us to provide advice to any of our members. Therefore, please consult your own financial advisor before considering any buy/sell decisions. You are completely responsible for the financial decisions that you make.
Last week's featured Model Trades
These were the trade setups from last week:
STZ (from Model Portfolio, SECL and SADCL):
STZ will continue as a Model Trade for a second week. For its chart and brief summary, check out our upcoming Model Trades described in more detail below.
Result: STZ performed quite well on a relative basis, holding onto support discussed last week.
Grade: Incomplete
SJM (from SECL and RGCL):
Like STZ, SJM will also continue as a Model Trade for a second week. Check out the chart and discussion below for more trade strategies.
Result: SJM traded quite well, given the overall S&P 500 selloff. We'll know more next week.
Grade: Incomplete
NVDA (from SADCL):
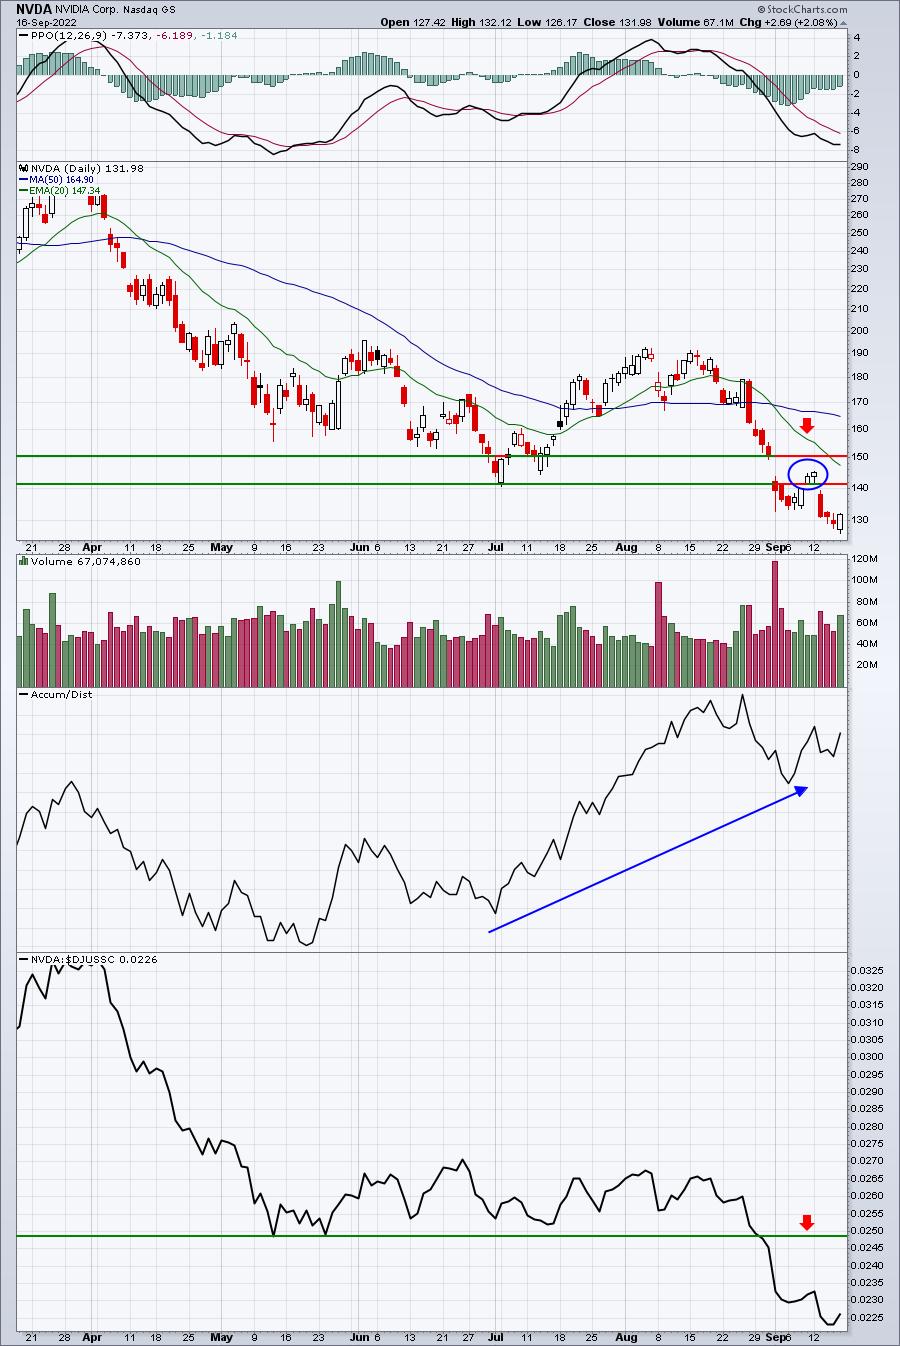
My argument last week: "Ok, this one is aggressive. Semiconductors ($DJUSSC) have not performed well and they could fall apart next week. However, it is options-expiration week and many of these semiconductors, including NVDA, have a TON of net in-the-money put premium, suggesting a quick move higher shouldn't be ruled out - before further selling later.
Here's what I like. NVDA managed to clear both price resistance and gap resistance at Friday's close. If growth stocks survive the two inflation reports, NVDA could be in a position to make a big run. Its max pain price is 156.44, which is almost exactly the 20-day EMA. There is nearly $180 million of net in-the-money put premium, so there's clearly financial incentive for market makers to drive NVDA's price higher in the near-term. Will it happen? Well, it's no guarantee, that's for sure. But I wouldn't bet against the market makers if money is on the table. Our strategy would be to buy NVDA at Monday's open, then again if we see selling to take NVDA down to Thursday's (close) gap support at 139.91. We'll keep a closing stop at 134 and our target would be a test of the 20-day EMA.
Result: We had two entries on NVDA - our first was at Monday's open (143.69) and our second was on a move down to 139.91. We actually saw a gap down on Tuesday morning, however, with an open at 138.02. So our average entry was 140.85. Our closing stop of 134.00 was triggered after a higher-than-expected August CPI crushed growth stocks on Tuesday. Our exit was Tuesday's close of 131.31, resulting in a 9.54 loss, or 6.77%, which was worse than the S&P 500's decline.
Grade: D
This week's featured Model Trades:
There are three short-term reasons to be concerned this week.
First, the second half of September historically is a rough period. It's not like we see it go down every year, but we've had some rough late-September swoons. Since the S&P 500 cleared its 2000 and 2007 peaks back in April 2013, we've had 9 Septembers. During the second half of September in these 9 years, the S&P 500 has risen 5 times and fallen 4 times. However, the biggest rally has been 1.5%, while we've seen two drops of more than 5%. I'm hopeful we'll see the former in 2022, but history does tell us to be cautious.
Second, Mondays are the worst day of the week, the 19th is the worst calendar day of the month, and the day after options expire is historically the worst day period. Monday, September 19th is the day after options expire. Gulp! Now before you go running for the exits, do keep in mind that history usually sees prices moving higher into options expiration week, which is why the Monday after options is typically bearish. Think "Opposite George" week. I haven't done any studies on how this day performs IF we've had weakness into options expiration Friday. But my hunch is that these days are not nearly as bearish if there was preceding weakness.
Third and finally, the Fed meets Tuesday and Wednesday. I'm really tired of hearing the constant moans and groans from the Fed. I think Wall Street is too. We could see a short-term relief rally if the Fed raises the fed funds rate by the widely-anticipated 75 basis points. Unless, of course, Fed Chief Powell decides he wants to be a stock market prognosticator.
It is very difficult to predict how Wall Street will perform in the week or two ahead. I'm excited by the prospects of the upcoming 4th quarter, but we have a bridge to cross first. I'm hopeful the bridge is stable. Because I remain bullish and believe the bottom is in, I'm using last week's weakness to get a bit more aggressive with our Model Trades. Two of last week's Model Trades held above price support, so we'll continue holding those into this week with any strategy changes noted below. Last week, I was deliberately cautious and defensive, which turned out to be the correct strategy, but let's open it up a little bit this week and two aggressive trades:
NET (from RGCL and EADCL):
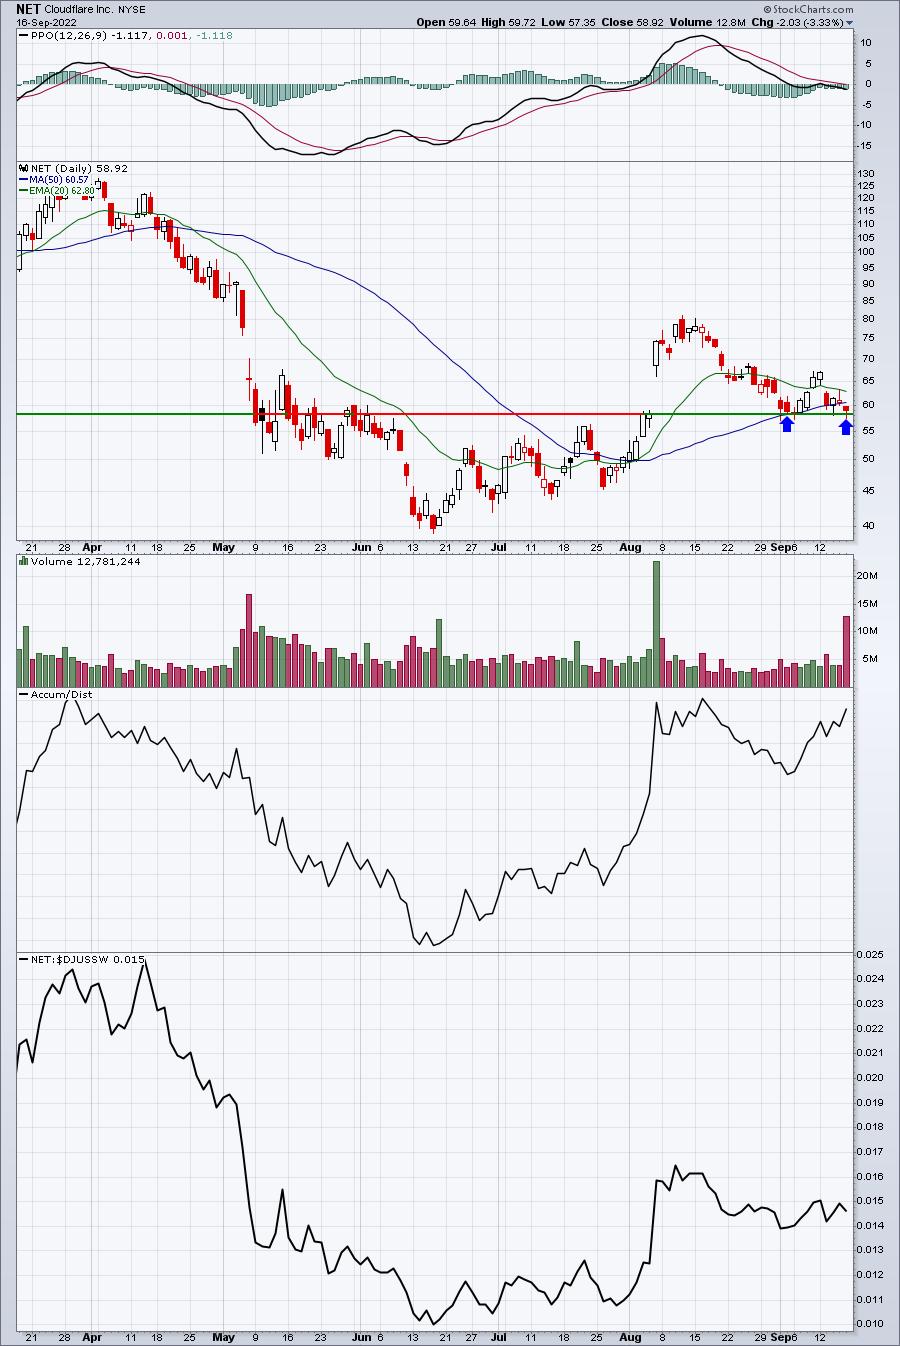
Last week, after enjoying nice profits on NET from the week prior, I indicated that if we saw a bad week, a stock like Cloudflare (NET) could easily give ALL of its gains back. Well, it did just that and underscores the potential short-term benefits of trading vs. buy-and-hold. NET has returned to key gap support, so we'll enter again at Monday's open and sell on any close beneath 58.00. Our target will be 66. If the S&P 500 continues to sell off, we want to make sure we limit our losses on a growth stock like NET. It's high risk, but also high potential reward.
STZ (from Model Portfolio, SECL, and SADCL)
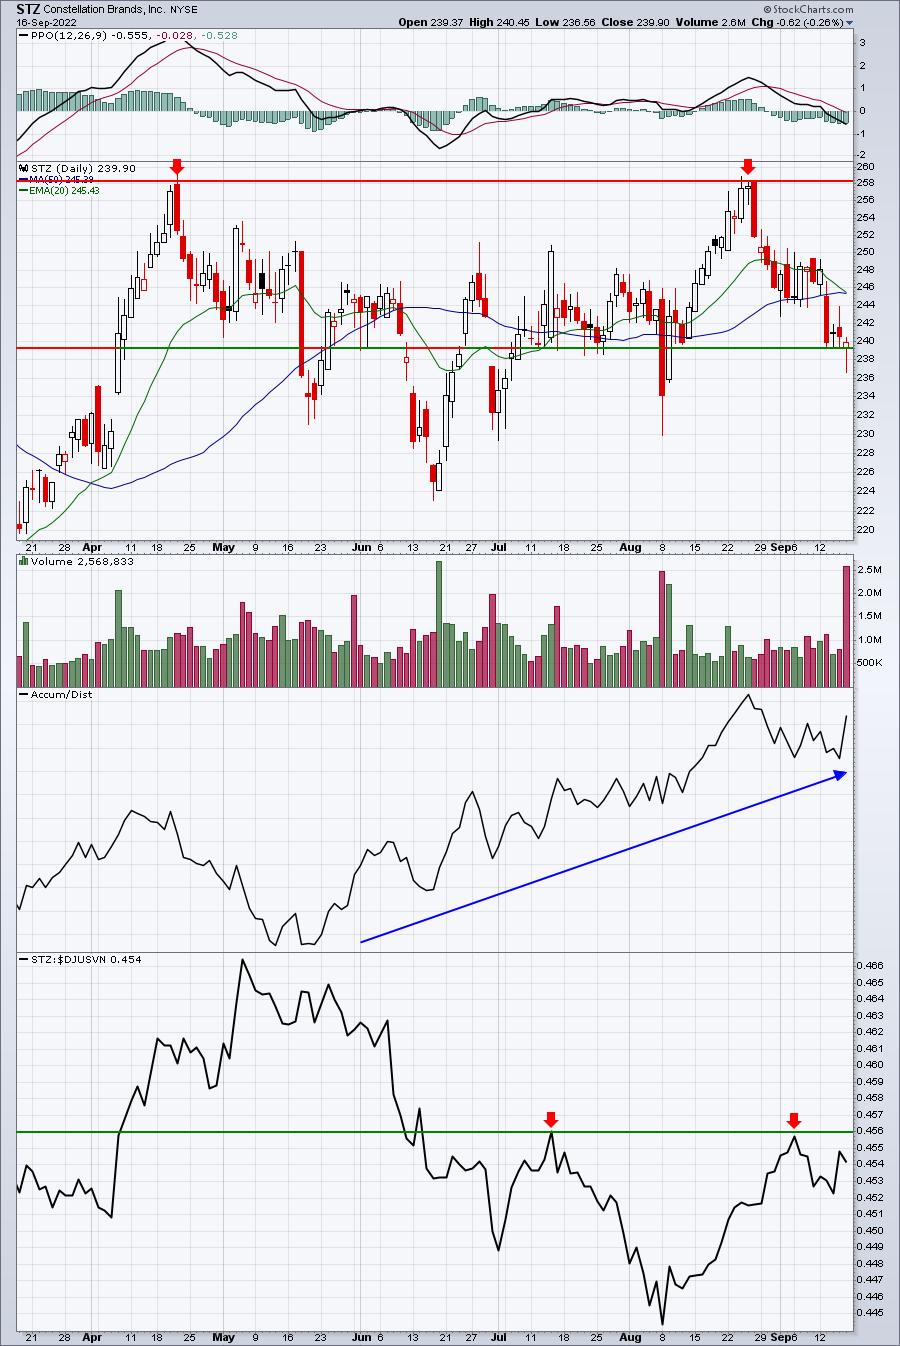
Last week, we suggested two entries - the first at Monday's open (245.00) and the other was 240.30, which triggered on Monday as well. Our closing stop was 239.84. We closed twice beneath 240.00, but held the 239.84 both times. We're going to lower our closing stop slightly to any close beneath 239.25 or any INTRADAY low beneath 236.50. Our target will remain unchanged at 258. Obviously, any further weakness in the upcoming week and we'll be out. As a more defensive play last week, it served its purpose, performing well on a relative basis.
SJM (from SECL and RGCL):
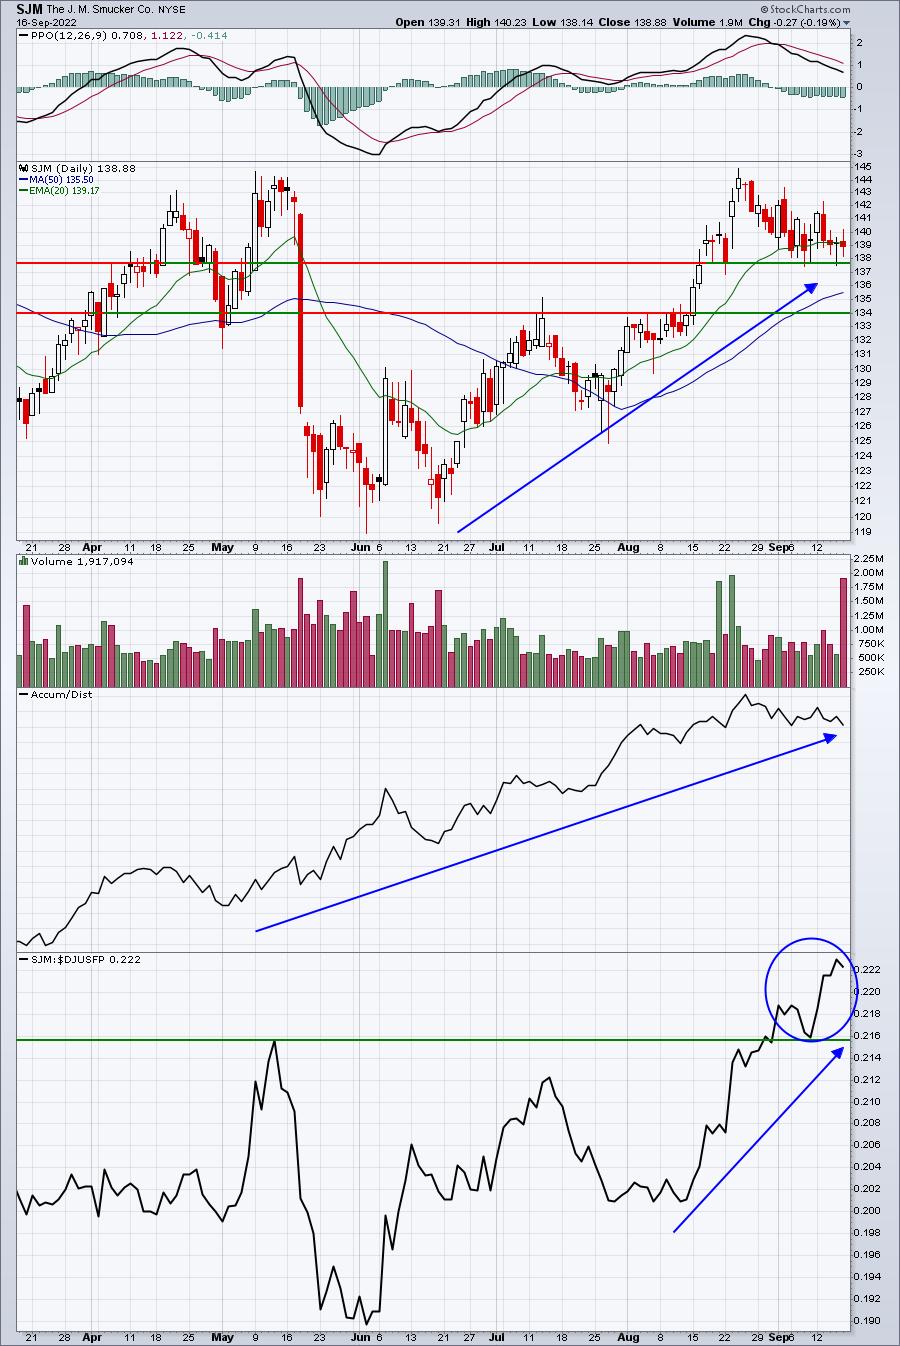
The move to more defensive stocks last week was a good one. SJM held onto its gap support, barely losing any ground on the week and gaining much more relative strength vs. its food products peers ($DJUSFP). We'll keep our closing stop at 137.75 and our target at 144.00.
TXN (from Income Portfolio, SECL, SADCL, RGCL, and BTCL):
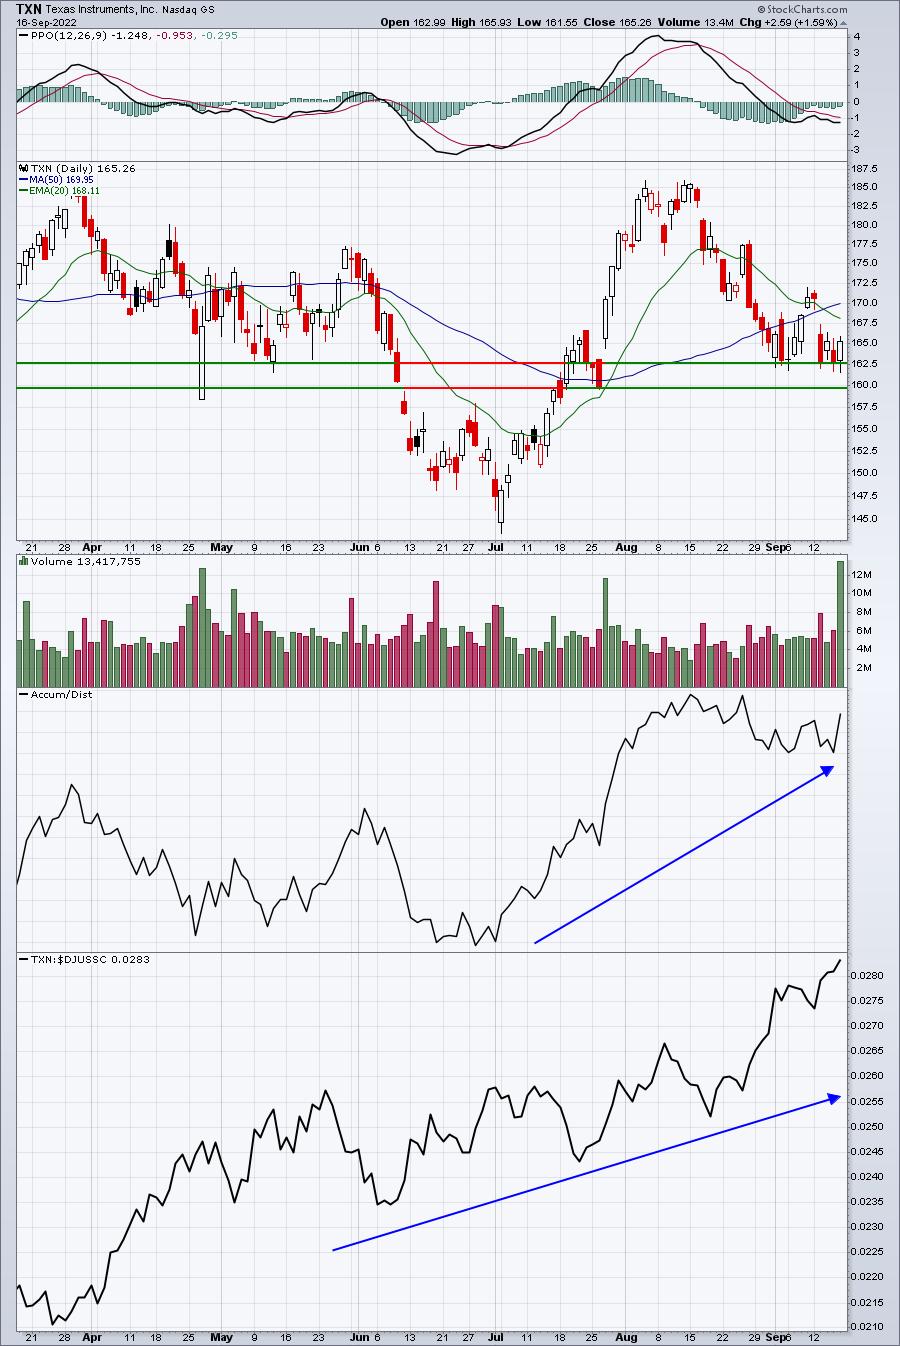
TXN is one of the best-performing semiconductor stocks ($DJUSSC) and its AD line has been very strong. I like two entries - the first at Monday's opening bell and a second entry at 160. I'd keep a very tight closing stop at 159.79. Consider a short-term price target of 172.
The Week Ahead
I know many market participants are very nervous about inflation and rapidly-increasing interest rates and I can understand it, because that's all we see and hear in the media. We're also feeling it too. I'm not saying that it doesn't exist. What I can tell you is that, from my experience and my interpretation of intermarket relationships, Wall Street is NOT worried. Two hedges frequently used by Wall Street firms to counter the effects of inflation are gold and real estate. I want you to look at these two charts and decide for yourself if Wall Street is worried about a lengthy bout of inflation:
Gold ($GOLD):
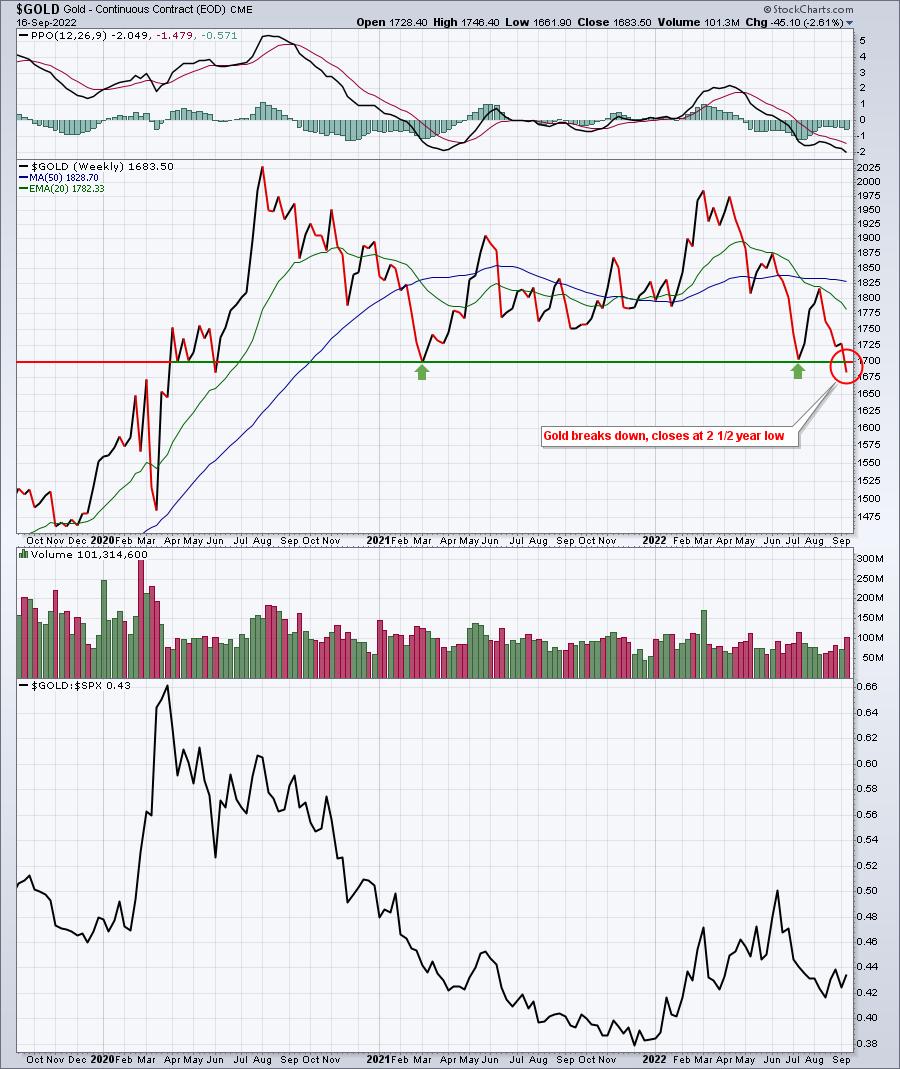
I'm sorry, but I cannot take the long-term inflation threat seriously when all the MBAs on Wall Street are selling gold. We saw a bit of relative strength in gold earlier in 2022, but that topped in June as the stock market bottom printed. Not only is gold NOT going up, it's struggling to even keep pace with the weak S&P 500. This is NOT inflation-type market behavior.
Real Estate (XLRE):
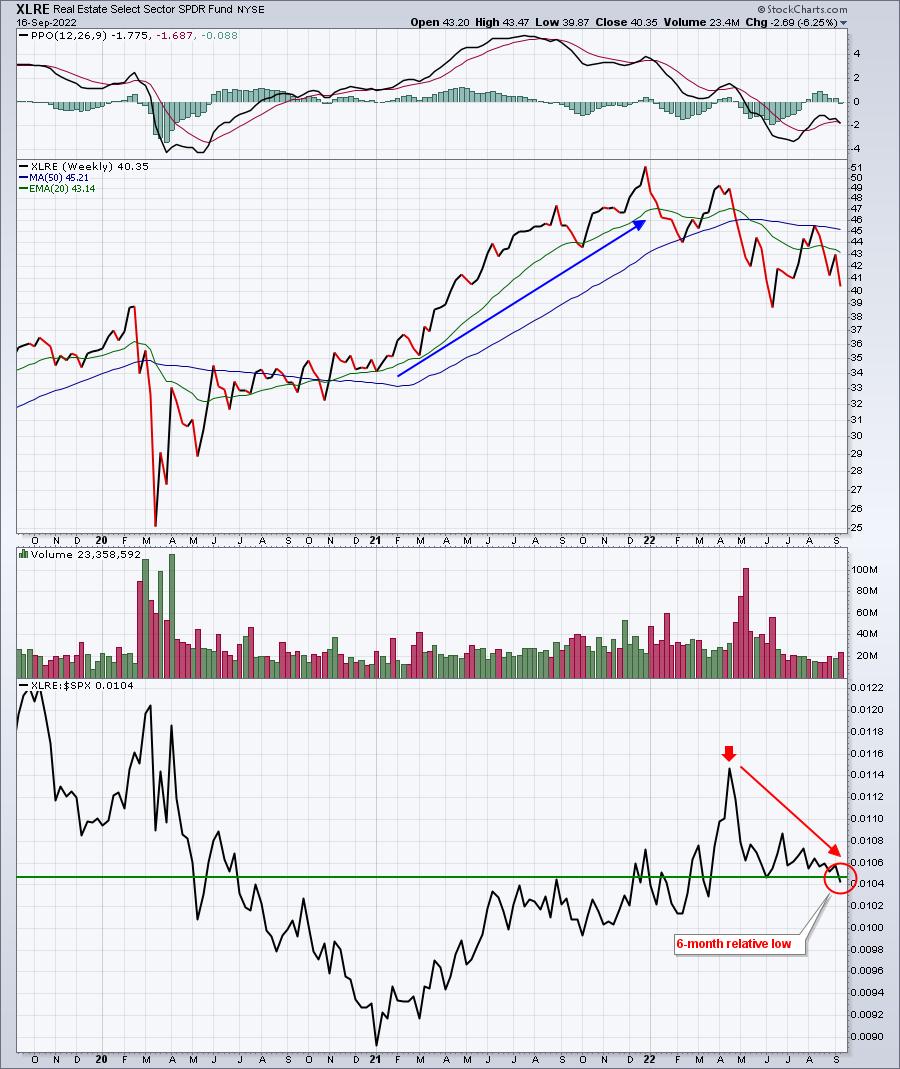
Real estate did very well on an absolute and relative basis in 2021 as inflation first began spiking. But 2022 has been a far different year, with the XLRE:$SPX relative strength hitting a 6-month low this week, as August CPI surprised to the upside.
Listen, we can debate endlessly about the fundamentals. I get it. But there is no argument when it comes to these two intermarket relationships. Neither gold nor real estate are performing well, so we MUST question the inflation argument being supported by the Fed. I believe Wall Street weakness the past month has much more to do with lack of confidence in the Fed than it does with inflation or higher rates.
Just my two cents.
Happy trading!
Tom Bowley, Chief Market Strategist
EarningsBeats.com
"Better timing. Better trades."