
EB Weekly Portfolio Report - Monday, October 31, 2022
Upcoming Earnings Reports
According to Zacks.com, the following companies will be reporting earnings this week and each is a component of one of our portfolios:
Monday, October 31: ON
Tuesday, November 1: UNM
Wednesday, November 2: CLH
Thursday, November 3: PWR, LNTH
Friday, November 4: None
PLEASE NOTE: The above companies were provided using Zacks.com. We do hold our portfolio stocks through one earnings report, but every EarningsBeats.com member must make his/her own investing/trading decisions about holding stocks into earnings reports as it's the most volatile (risky) time to own a stock.
Portfolio Rules and Objectives
Here are the common traits and objectives of our portfolios:
- There are 10 leading stocks from up to 10 leading industries in each portfolio (at the time of selection). Generally, there will only be one stock per industry group, but there could be exceptions.
- They are typically held for an entire 90-day period, with no stops in place. We strive for consistency, transparency, and simplicity in our portfolios. EB.com members may hold these stocks for the entire 90 days, trade them, use stops, etc., but for purposes of our calculation, we will make no exceptions to our "buy and hold for three months" strategy.
- Every stock will generally be held through ONE earnings report
- The expectation is that relative winners will carry the portfolio to outperformance
- They were all entered into as of the close on Friday, August 19th
- Primary objective is to outperform the benchmark S&P 500 over time; quarter-to-quarter performance can be extremely volatile, especially if significant rotation takes place intra-quarter
Here are several considerations for EB members:
- The Income Portfolio should have the least amount of volatility as it will typically be comprised of quality large cap stocks with solid dividends
- The Model and Aggressive Portfolios should be viewed similar to aggressive growth funds; they will typically have a lot of volatility and periodic drawdowns can be significant from time to time
- The Income portfolio stocks will all pay dividends, with the expected average dividend yield to be at least 1.0%
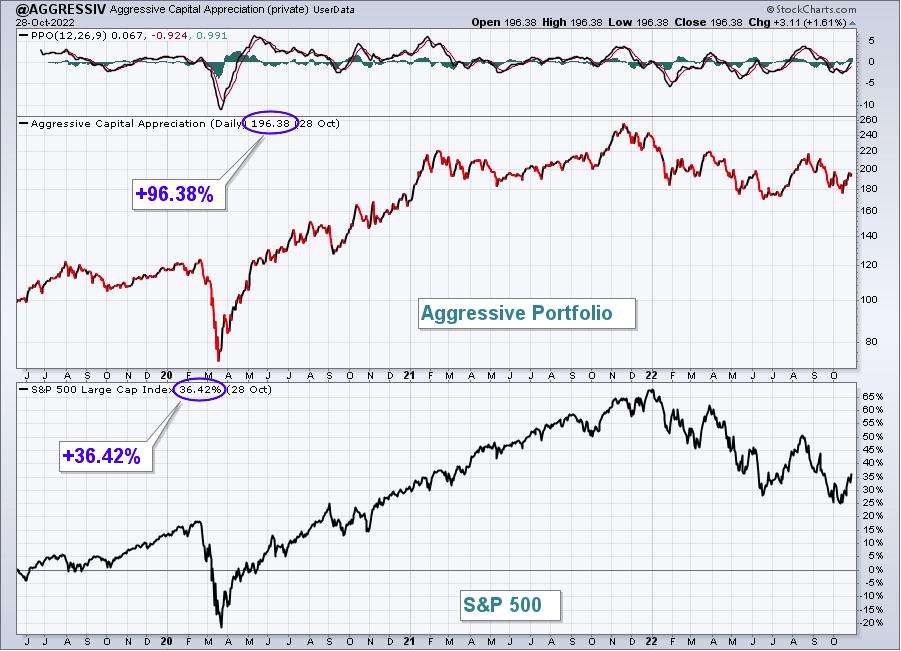
- Drawdowns (losses) should be much milder on the Income portfolio, with more volatility expected on the other two; please review inception-to-date charts below to gain an idea of the volatility associated with each
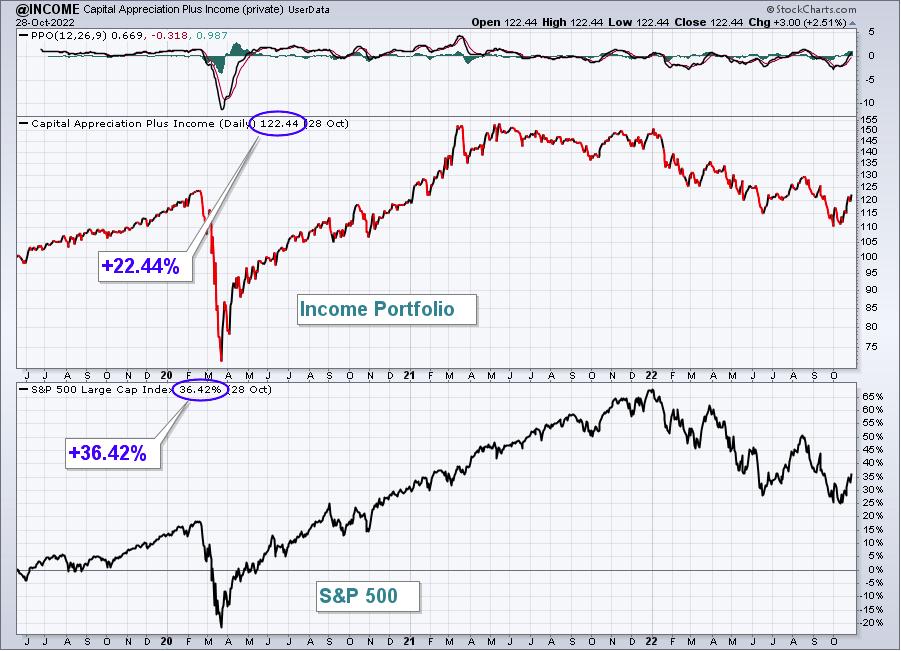
- I believe the larger drawdown on the Income portfolio at the beginning of the pandemic was an anomaly, occurring as many defensive, higher-yielding companies uncharacteristically underperformed during a market decline.
- Large drawdowns in the February through May 2021 and the November 2021 to February 2022 periods were due to the rapid rotation from growth stocks to value stocks; each quarter, our portfolios are based on themes and there is never a guarantee that our analysis and beliefs will be proven correct
- Consider owning or trading these stocks in whatever manner is most comfortable for you; while we will buy all 10 stocks in the manner identified above, feel free to trade certain stocks or wait for pullbacks if the stocks are overbought
- We have no idea what risk each member is willing or able to take. We are not registered investment advisors so be sure you understand the risk you take. Please consult your financial advisor.
- EarningsBeats.com shareholders/employees may own all or some of the portfolio stocks from time to time.
Weekly Snapshot
Here's a weekly recap:
Weekly Summary
Benchmark S&P 500:
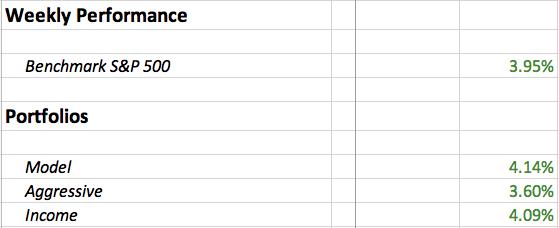
The worst historical week of the year (October 21st close through October 27th close) ended at Thursday's close and gains were modest on the S&P 500 at that time. (The NASDAQ did lose ground during this bearish period) However, Friday opened the most bullish historical period of the year and it was as if a light switch was turned on. The Dow Jones gained more than 800 points on Friday, while the NASDAQ's 310-point gain was an even bigger percentage increase. For the week, the Dow Jones gained nearly 6%, the S&P 500 tacked on almost 4%, and the NASDAQ lagged on a relative basis, but still jumped 2.9%, thanks in large part to Friday's big day.
The 10-year treasury yield ($TNX) fell back from 4.20% to a low of 3.91% last week, which should have triggered an avalanche of buying on the NASDAQ. Unfortunately, earnings issues at many of the large cap NASDAQ companies weighed mightily on this more growth-oriented index. Meta Platforms (META) was truly one UGLY report and it was hammered, while Microsoft (MSFT), Alphabet (GOOGL), and Amazon.com (AMZN) were all hit hard after reporting disappointing results/guidance. There was good news, though. While earnings outweighed lower treasury yields in terms of overall market performance, especially relative performance, much of the relative weakness on the NASDAQ 100 ($NDX) occurred at the opening bell as gaps encouraged further morning selling. By the afternoon sessions, though, the NDX came to life and outperformed the S&P 500. That can be seen by my newest INTRADAY AD indicator, which is named "@SPYQQQ". I developed this intraday ratio and am tracking it using the User-Defined Index feature at StockCharts.com. The actual calculation is based upon the QQQ:SPY relative performance throughout the trading day, ignoring the opening gaps. Check out how this INTRADAY ratio fared last week (and since May 20th):
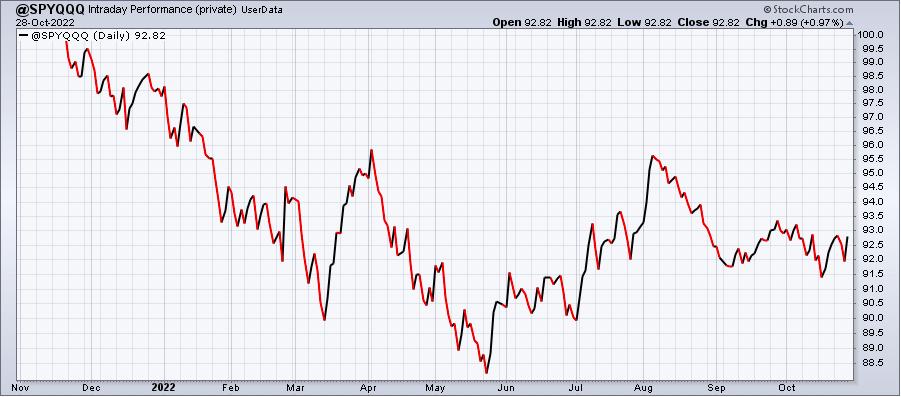
I believe this is a VERY significant reversal signal in our major indices. Don't be surprised if this leads to a HUGE market rally at some point in Q4. Perhaps it's already begun, but we do need to watch both the Fed meeting reaction and the November 10th CPI report reaction as these two headwinds have produced big moves lower in our major indices. If we can escape the next 10 days or so unscathed, or even with higher prices, I believe the worst is behind us.
Model Portfolio:
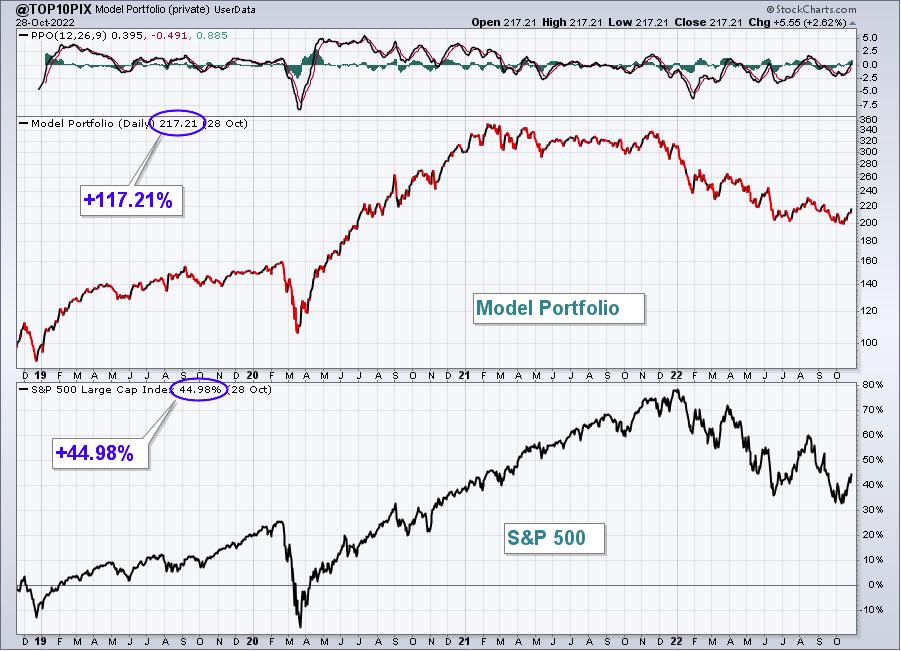
The Model Portfolio gained 4.14% last week, outperforming the S&P 500. Here's the updated inception-to-date chart of the portfolio:
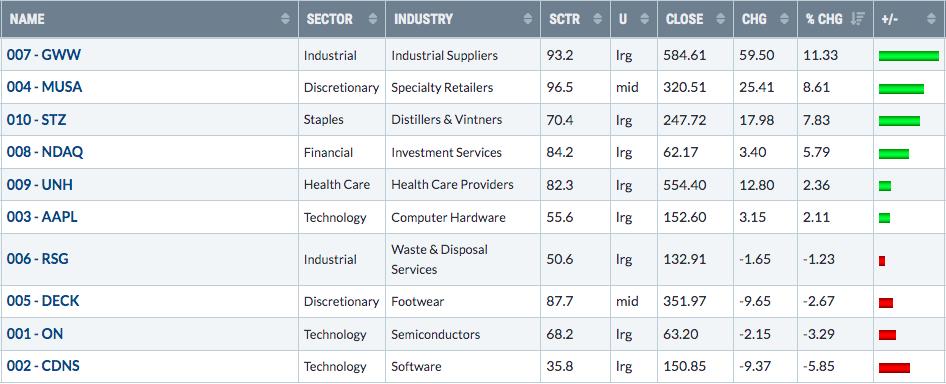
Here are how the Model Portfolio component stocks performed last week (includes today's action):
Aggressive Portfolio:
The Aggressive Portfolio climbed 3.60% last week, but underperformed the S&P 500. Here's the updated inception-to-date chart of the portfolio:
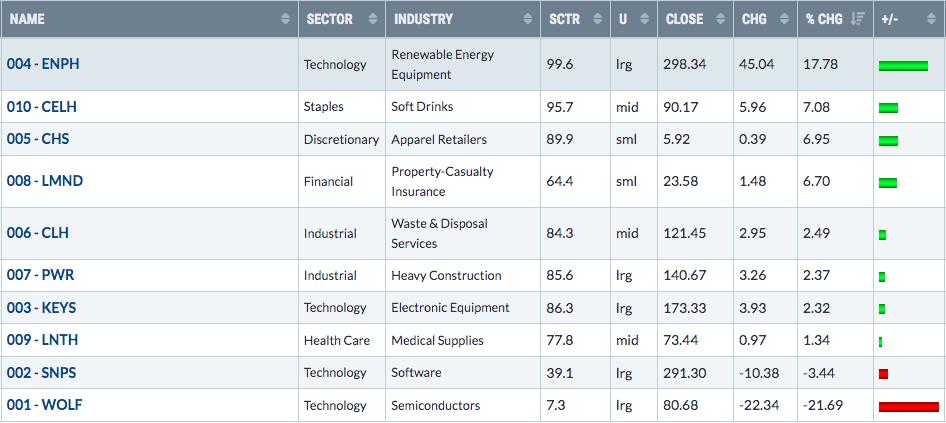
Here are how the Aggressive Portfolio component stocks performed last week (includes today's action):
Income Portfolio:
The Income Portfolio rose 4.09% last week, outperforming the S&P 500.
Here's the updated inception-to-date chart of the portfolio:
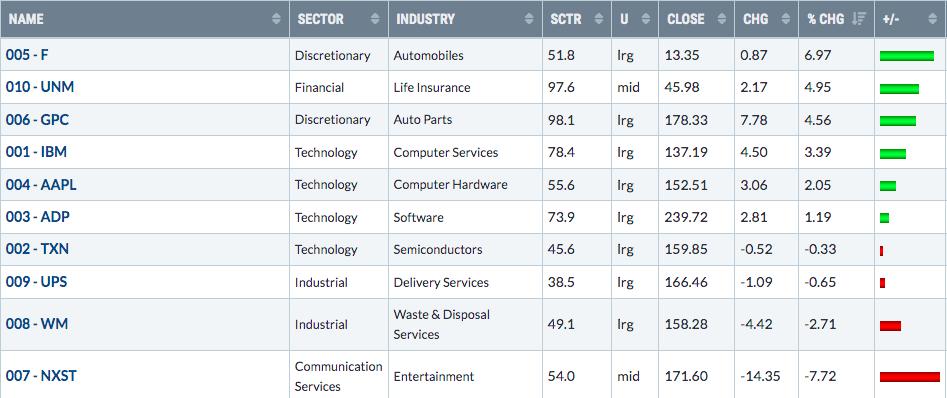
Here are how the Income Portfolio component stocks performed last week (includes today's action):
Model ETF Portfolio
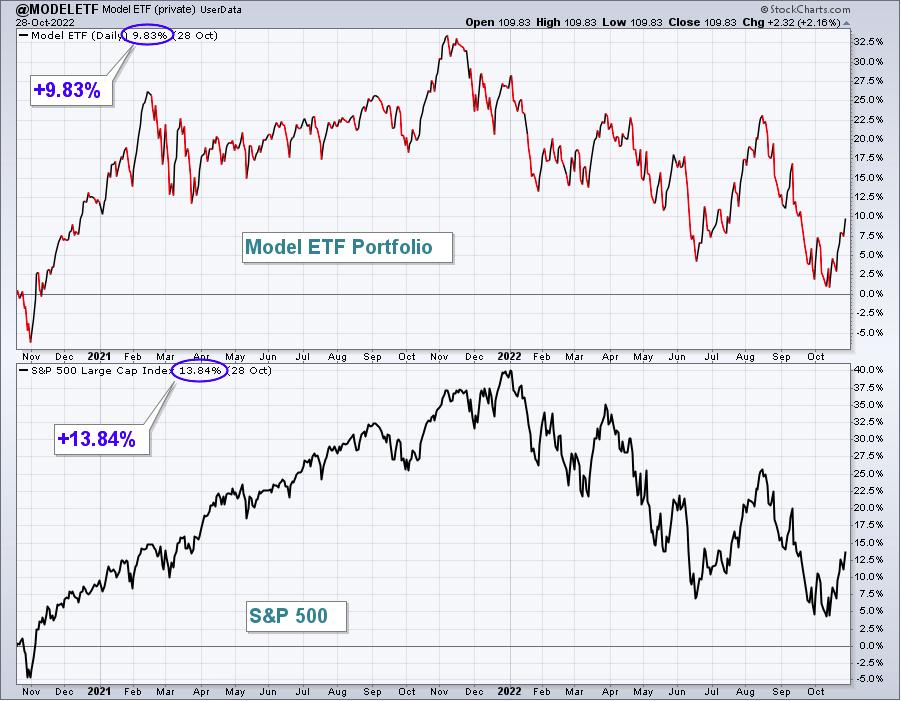
Our Model ETF Portfolio jumped 4.44% last week, but underperformed the S&P 500.
Here's the updated inception-to-date chart of the Model ETF Portfolio:
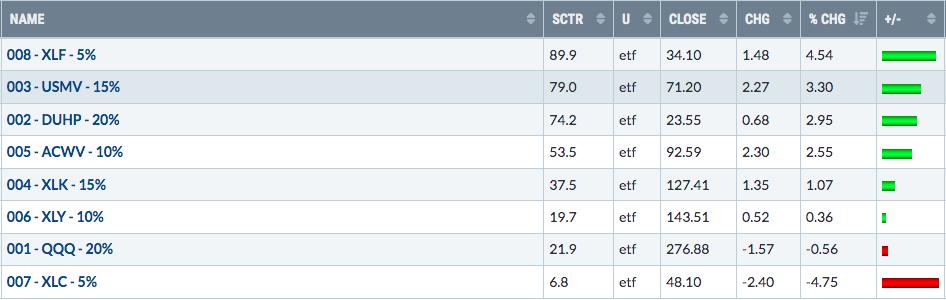
Here are how the Model ETF Portfolio components performed last week (includes today's action):
Model Trades
I will provide Model Trades each week in this Weekly Portfolio Report, which will simply be to outline possible trades based on key support, resistance, relative strength, and where these trades come from. For instance, my trading strategy for Strong AD ChartList (SADCL) stocks might be completely different than my trading strategy on Strong Earnings ChartList (SECL) stocks. Obviously, it would be different from a Short Squeeze ChartList (SSCL) trading candidate. I'll lay out the annotated chart and my reasoning for the (potential) trade. In the following week's EB Weekly Portfolio Report, I'll grade each of the prior week's Model Trades. Grades will generally be based on how these trades performed relative to the S&P 500. Feel free to trade these stocks in a similar manner or according to your own trading strategy. Or ignore them. It's completely up to you. I am not a Registered Investment Advisor (nor is EarningsBeats.com). THESE TRADING CANDIDATES SHOULD NOT BE VIEWED AS INVESTMENT ADVICE.
I view EarningsBeats.com as a market research, market guidance, and market education platform. We do not attempt, in any fashion, to manage anyone's money. We have no idea the risk tolerance of each of our members, nor do we have any idea of your financial goals and objectives. It would be irresponsible for us to provide advice to any of our members. Therefore, please consult your own financial advisor before considering any buy/sell decisions. You are completely responsible for the financial decisions that you make.
Last week's featured Model Trades
We closed out all Model Trades recently and haven't been active. Personally, I've stuck with ETFs to ride higher with U.S. equities during this recent spike. We're now up against key overhead price, moving average, and/or neckline resistance on our major indices, so being relatively careful on the individual stock trading front probably makes sense. For now, we're simply going to watch the action and, if we see a solid reward to risk trade, we'll point it out in our DMRs this week. Here were the last two Model Trades that we were stopped out on:
PDD (from SECL):
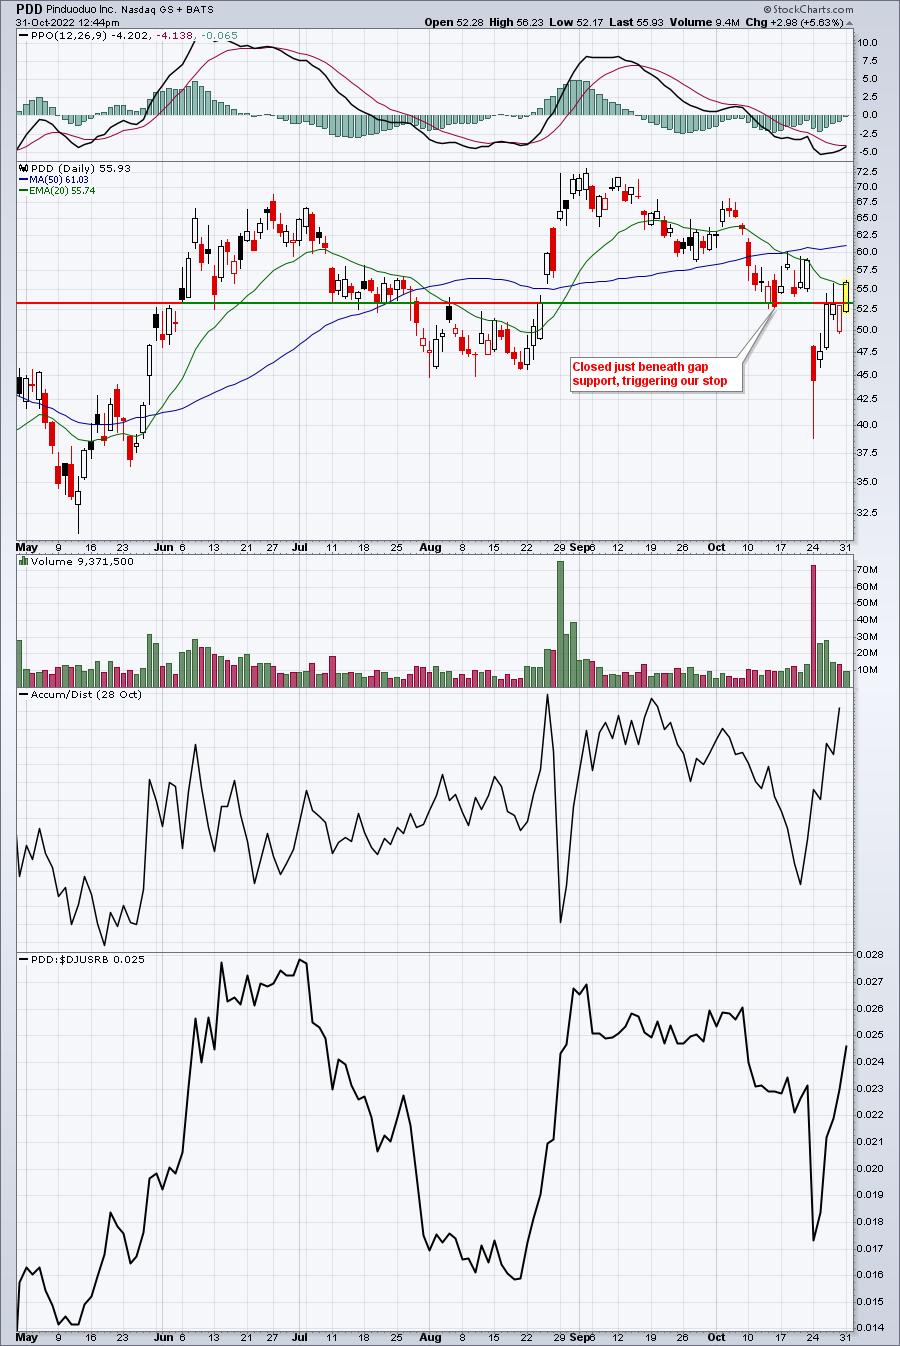
My argument from Friday, October 14th: "I like this one after it printed a reversing hollow candle yesterday in a key gap support zone. I like entry at the open today and again at 53.50 with a closing stop beneath 53.21. I'm looking for a return back to 66.50, my target."
Result: We were stopped out almost as soon as we entered. Our two entries were 56.20 and 53.50, so an average entry of 54.85. The close was beneath our closing stop, so our forced exit was 52.90, resulting in a 3.56% loss. The only positive was that the QQQ fell 3.86% from its open to its close that day. Still, having a stock stopped out the same day you place it is never ideal.
Grade: D
ACLS (from RGCL):
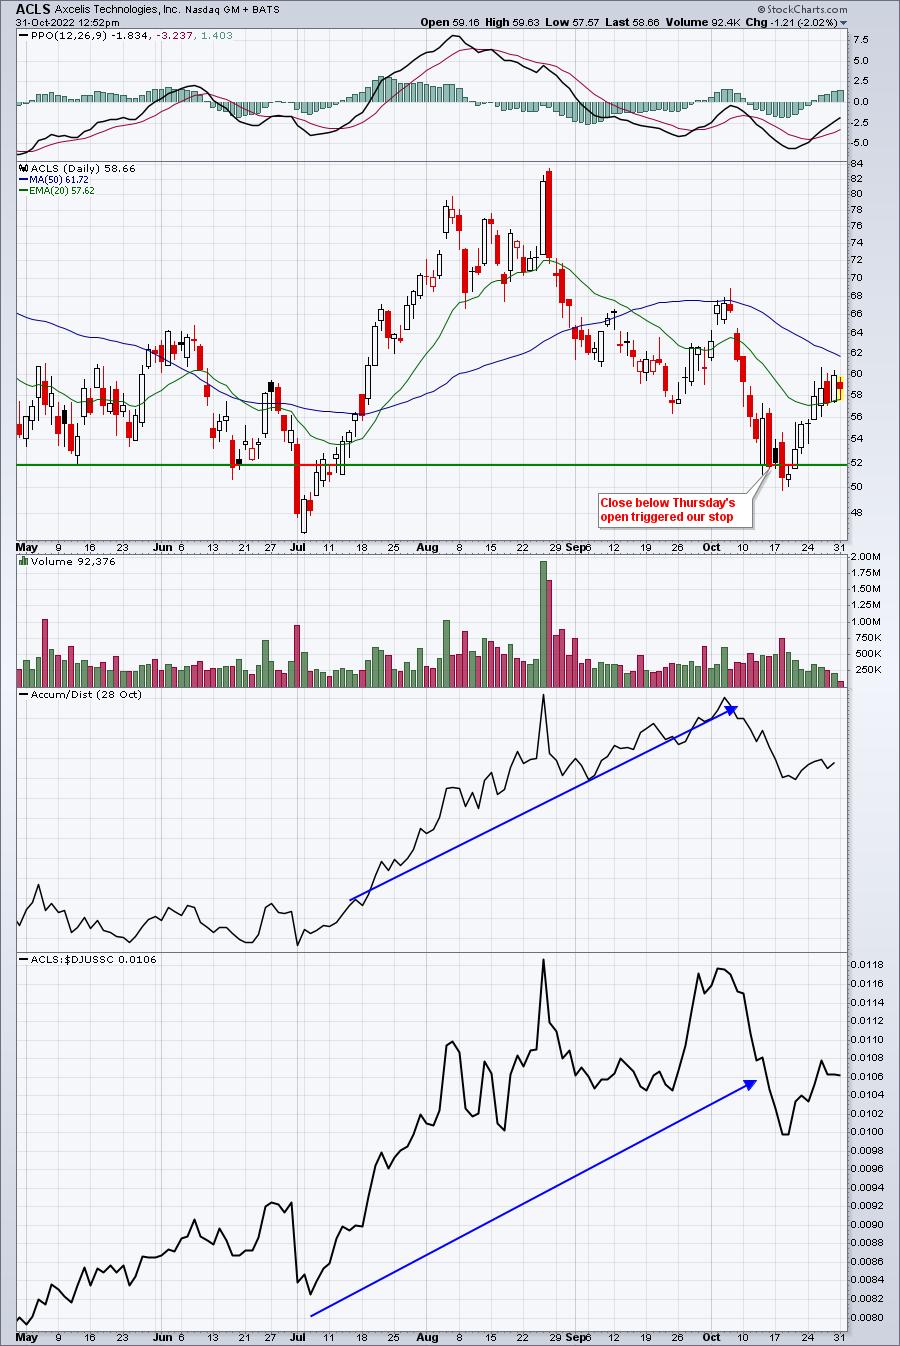
My argument from Friday, October 14th: "I didn't see any industry group that made a better and stronger reversal yesterday than semiconductors ($DJUSSC). The group is so oversold and recently took the double gut punch of AMD and AMAT warning. Even a oversold bounce from here could be powerful. ACLS has been a leader in the group. I like it at today's open and again at 54.00 on a pullback. Consider a closing stop beneath at 51.90 and a target of 67.00."
Result: We entered this one at two levels, 56.30 and 54.00, or an average of 55.15. We were stopped out at the close at 51.71, resulting in a 6.68% loss. This one stung for two reasons. First, losing nearly 7% on a trade is a big loss for me, even though it was clearly an aggressive trade. Second, ACLS has since moved up and, when it pushed above 60, would have represented nearly a 10% profit. Timing in a volatile market, though, makes a big difference and our timing here was not good.
Grade: F
The Week Ahead
Well, it's Fed week and it's jobs week, either of which could derail the monster month that we've enjoyed, particularly on the Dow Jones. But I am approaching the stock market as if it's 2022 decline has already priced in all the bad news. Any further bad news could potentially DELAY our rally, but I don't believe it'll eliminate it. I will only grow bearish if my signals tell me to do so. Right now, I am as bullish as I've been since June when I called a market bottom.
From a technical perspective, my biggest question entering this week is "Where does the S&P 500 end the week, now that it's reached that key 3900 level?" We've seen a number of rallies and declines fail once reaching this level. A confirming close back above 3900 should be viewed quite bullishly. Here's the chart:
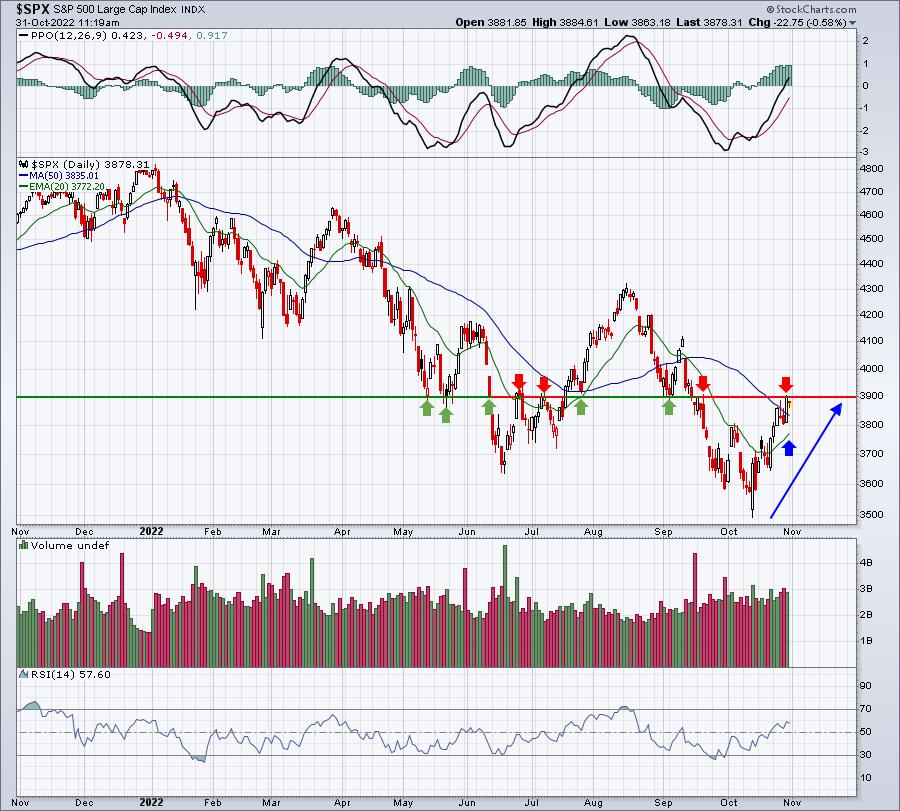
The green arrows mark 3900 (or thereabouts) as key support and the red arrows mark this same level as key resistance. We closed at 3901 on Friday and we're trading just beneath that level currently. Which way are we going to go? Note that we've been crossing the 20-day EMA repeatedly since the June bottom. That's a TRENDLESS market. Right now, we're in the midst of a short-term uptrend. If the rising 20-day EMA holds as support on the next decline and we move right back up to a new high, that's a signal a CONFIRMED uptrend has begun and I'd grow much more bullish in terms of trading individual stocks. Until then, I'll remain a bit more cautious with ETFs. One last comment on the above chart. RSI 60 historically presents challenges when we're in a bear market. We did climb temporarily above RSI 60 back in August during the last rally, but that's not normal technical behavior. We're at RSI 60 again. A break above 60 bodes well for U.S. equities, while failure leaves the bears in charge - at least for now.
Happy trading!
Tom Bowley, Chief Market Strategist
EarningsBeats.com
"Better timing. Better trades."