
EB Weekly Portfolio Report - Sunday, November 13, 2022
Our Fall Special Has Begun!
Our Annual Fall Special began on Saturday. It is our BEST deal of the year and I want to make sure our members take advantage. For more information, you can CLICK HERE.
Upcoming Earnings Reports
According to Zacks.com, the following companies will be reporting earnings this week and each is a component of one of our portfolios:
Monday, November 14: None
Tuesday, November 15: None
Wednesday, November 16: None
Thursday, November 17: KEYS
Friday, November 18: None
PLEASE NOTE: The above companies were provided using Zacks.com. We do hold our portfolio stocks through one earnings report, but every EarningsBeats.com member must make his/her own investing/trading decisions about holding stocks into earnings reports as it's the most volatile (risky) time to own a stock.
Portfolio Rules and Objectives
Here are the common traits and objectives of our portfolios:
- There are 10 leading stocks from up to 10 leading industries in each portfolio (at the time of selection). Generally, there will only be one stock per industry group, but there could be exceptions.
- They are typically held for an entire 90-day period, with no stops in place. We strive for consistency, transparency, and simplicity in our portfolios. EB.com members may hold these stocks for the entire 90 days, trade them, use stops, etc., but for purposes of our calculation, we will make no exceptions to our "buy and hold for three months" strategy.
- Every stock will generally be held through ONE earnings report
- The expectation is that relative winners will carry the portfolio to outperformance
- They were all entered into as of the close on Friday, August 19th
- Primary objective is to outperform the benchmark S&P 500 over time; quarter-to-quarter performance can be extremely volatile, especially if significant rotation takes place intra-quarter
Here are several considerations for EB members:
- The Income Portfolio should have the least amount of volatility as it will typically be comprised of quality large cap stocks with solid dividends
- The Model and Aggressive Portfolios should be viewed similar to aggressive growth funds; they will typically have a lot of volatility and periodic drawdowns can be significant from time to time
- The Income portfolio stocks will all pay dividends, with the expected average dividend yield to be at least 1.0%
- Drawdowns (losses) should be much milder on the Income portfolio, with more volatility expected on the other two; please review inception-to-date charts below to gain an idea of the volatility associated with each
- I believe the larger drawdown on the Income portfolio at the beginning of the pandemic was an anomaly, occurring as many defensive, higher-yielding companies uncharacteristically underperformed during a market decline.
- Large drawdowns in the February through May 2021 and the November 2021 to February 2022 periods were due to the rapid rotation from growth stocks to value stocks; each quarter, our portfolios are based on themes and there is never a guarantee that our analysis and beliefs will be proven correct
- Consider owning or trading these stocks in whatever manner is most comfortable for you; while we will buy all 10 stocks in the manner identified above, feel free to trade certain stocks or wait for pullbacks if the stocks are overbought
- We have no idea what risk each member is willing or able to take. We are not registered investment advisors so be sure you understand the risk you take. Please consult your financial advisor.
- EarningsBeats.com shareholders/employees may own all or some of the portfolio stocks from time to time.
Weekly Snapshot
Here's a weekly recap:
Weekly Summary
Benchmark S&P 500:
To say that last week was a solid week would be a MAJOR understatement. The bulls needed to see that big breakout above 3900 on the S&P 500. They also needed to see a revival in my sustainability ratios. They needed support from semiconductors ($DJUSSC), software ($DJUSSW) and internet ($DJUSNS).
They got it ALL and much, much more in what should be a major turning point (for the better) for U.S. equities. Let's start with that S&P 500 chart:
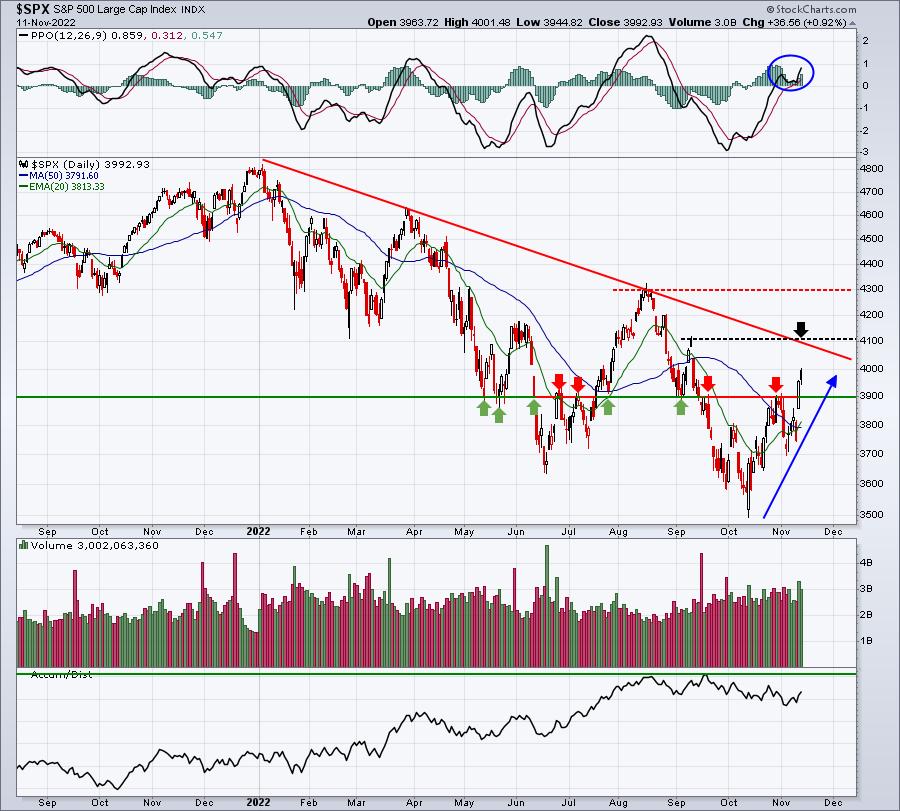
There will be a few keys for me that I'll be laser-focused on. First, can the S&P 500 break its 2022 downtrend and clear its September price reaction high near 4100? If so, I say we shoot straight higher to 4300 to establish the right side of a very significant neckline with a bottoming reverse head & shoulders pattern.
Treasury yields CRATERED on Thursday, which the negative divergence had been suggesting:
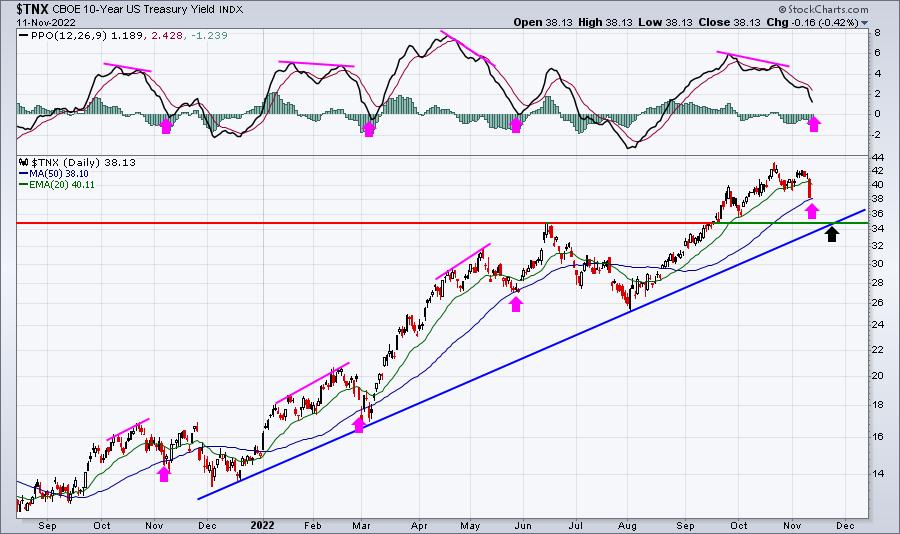
Those negative divergences have been 4 for 4 since late 2021. Based on lots of prior experience, I look for PPO centerline and/or 50-day SMA tests (pink arrows) after I see a divergence print - either positive or negative. Note that the last 3 negative divergences correctly pointed out the short-term reversal, but they were NOT long-term signals. It's still possible that the 10-year treasury yield ($TNX) bounces and goes back up to highs again. I don't believe it's going to happen, because I think the inflation story is coming to an end. But I could be wrong and, if I am, this will be nothing but a short-term move lower.
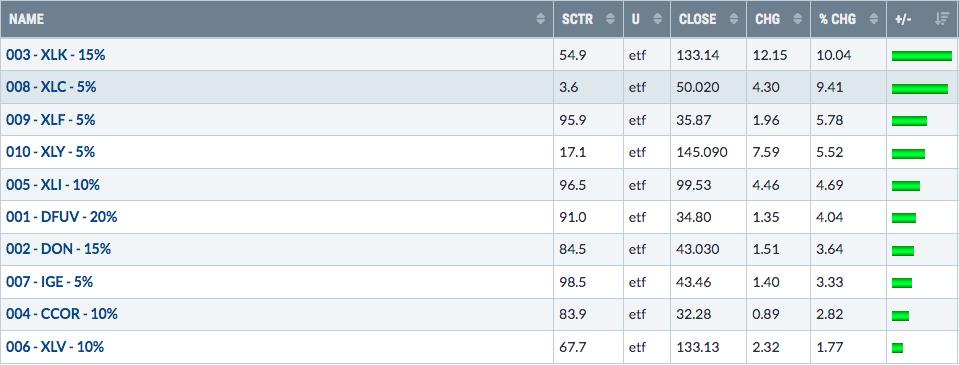
Technology (XLK, +10.04%) was the top-performing sector last week and leadership within this sector was quite encouraging as well:
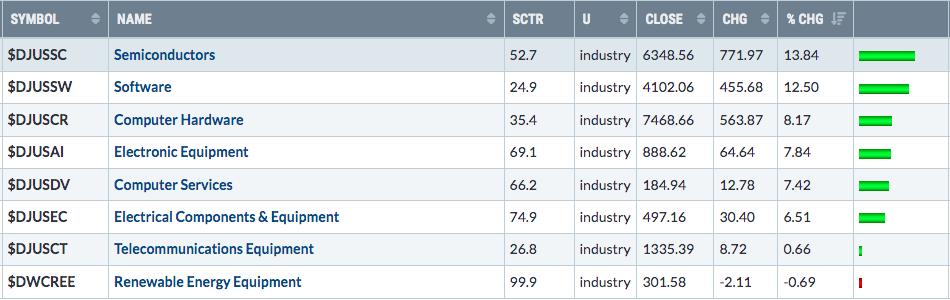
Areas of the stock market that can grow earnings quickly will benefit the most as interest rates top and begin to decline. Lower rates will provide a boost to the economy and future rapidly-growing earnings will then be valued much higher as the interest rate used to discount those future earnings will provide a much, much higher present value. It's a win-win for growth stocks and you can see how the stock market jumped all over growth stocks late last week:
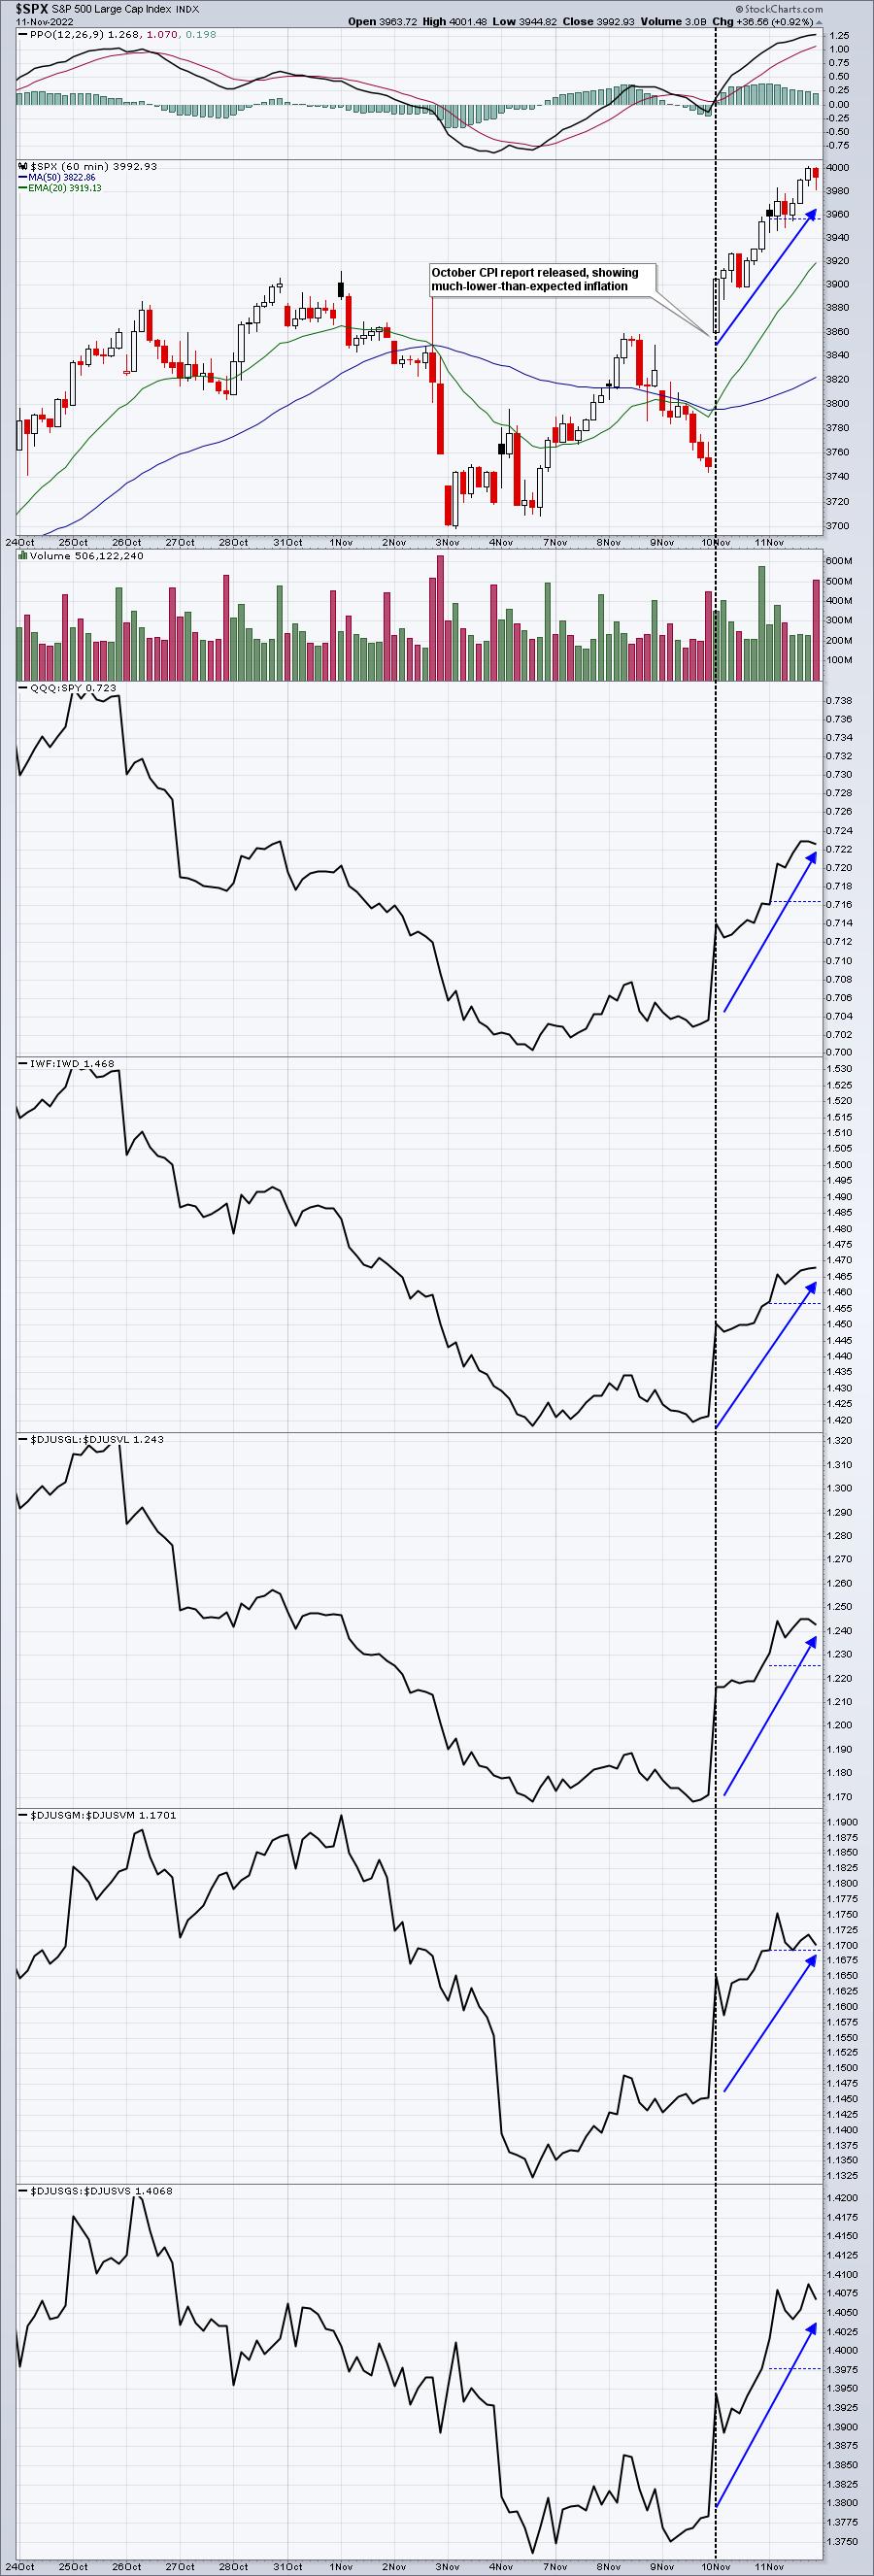
We're not completely out of the woods, but last week was a VERY good start to what could be the resumption of our 9-year old secular bull market.
Model Portfolio:
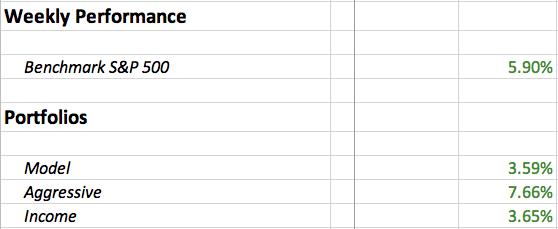
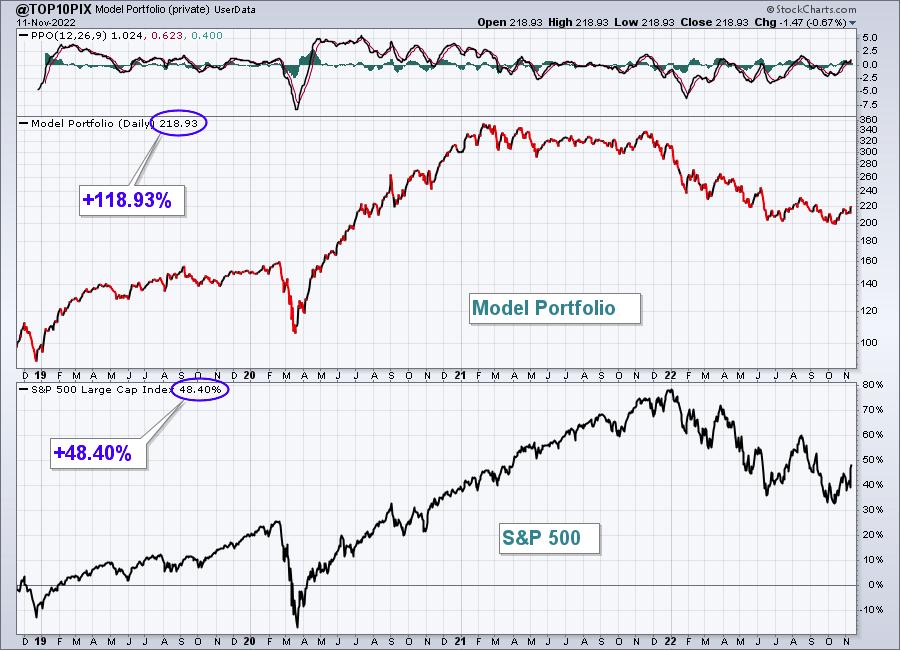
The Model Portfolio rose 3.59% last week, underperforming the S&P 500. Here's the updated inception-to-date chart of the portfolio:
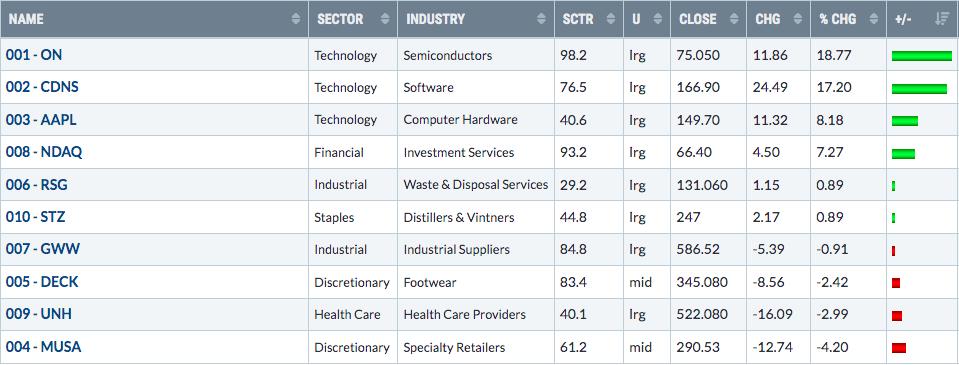
Here are how the Model Portfolio component stocks performed last week:
Aggressive Portfolio:
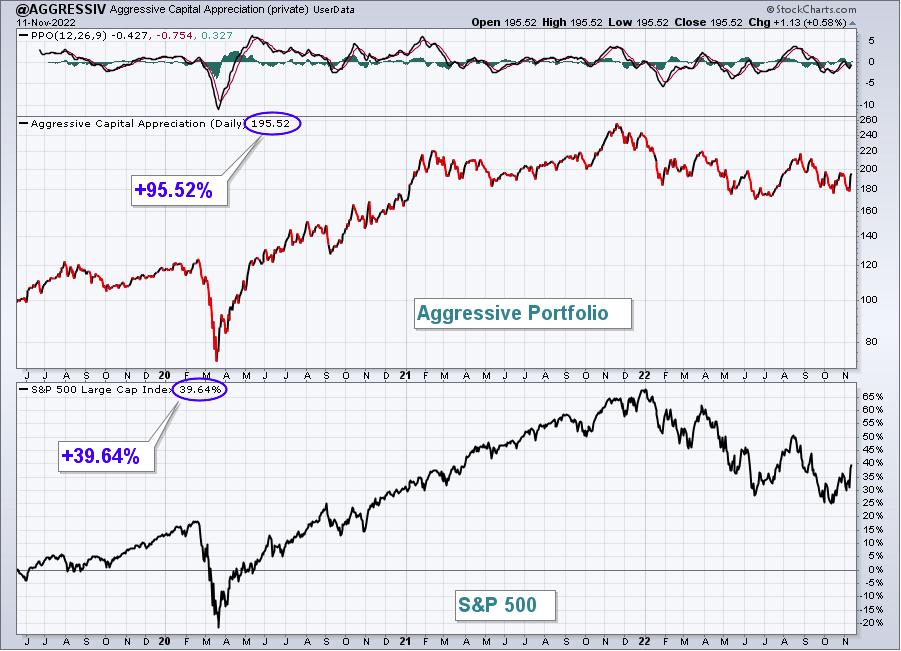
The Aggressive Portfolio surged 7.66% last week, outperforming the S&P 500. Here's the updated inception-to-date chart of the portfolio:
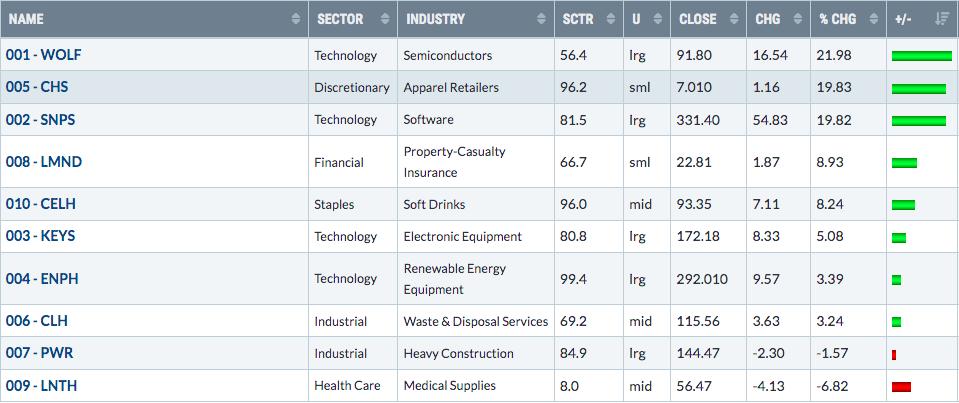
Here are how the Aggressive Portfolio component stocks performed last week:
Income Portfolio:
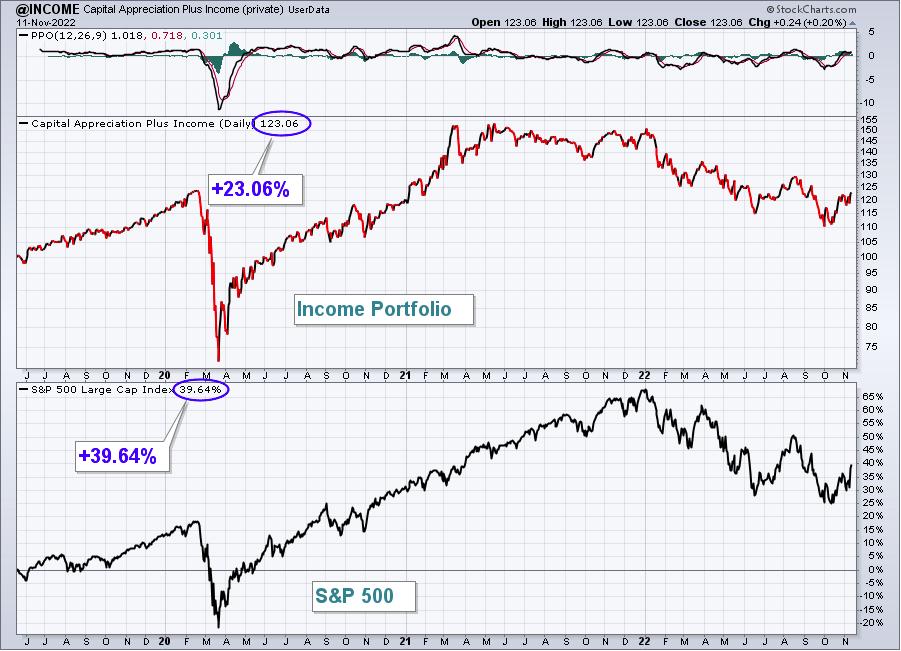
The Income Portfolio gained 3.65% last week, underperforming the S&P 500.
Here's the updated inception-to-date chart of the portfolio:
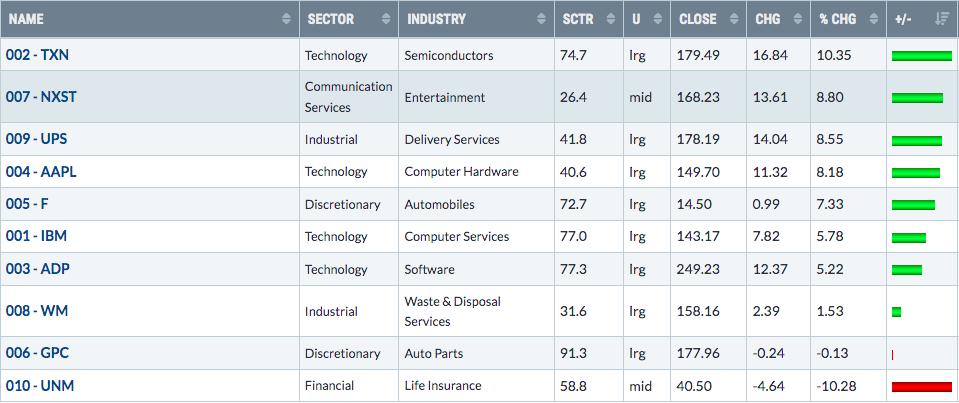
Here are how the Income Portfolio component stocks performed last week:
Model ETF Portfolio
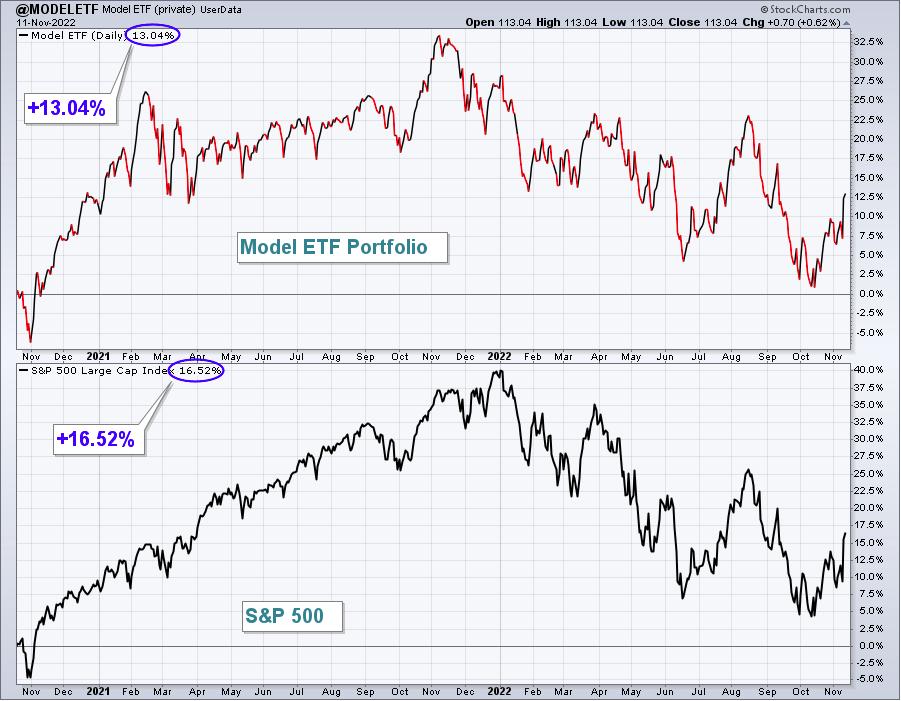
Our Model ETF Portfolio jumped 4.92% last week, but underperformed the S&P 500.
Here's the updated inception-to-date chart of the Model ETF Portfolio:
Here are how the Model ETF Portfolio components performed last week:
Model Trades
I will provide Model Trades each week in this Weekly Portfolio Report, which will simply be to outline possible trades based on key support, resistance, relative strength, and where these trades come from. For instance, my trading strategy for Strong AD ChartList (SADCL) stocks might be completely different than my trading strategy on Strong Earnings ChartList (SECL) stocks. Obviously, it would be different from a Short Squeeze ChartList (SSCL) trading candidate. I'll lay out the annotated chart and my reasoning for the (potential) trade. In the following week's EB Weekly Portfolio Report, I'll grade each of the prior week's Model Trades. Grades will generally be based on how these trades performed relative to the S&P 500. Feel free to trade these stocks in a similar manner or according to your own trading strategy. Or ignore them. It's completely up to you. I am not a Registered Investment Advisor (nor is EarningsBeats.com). THESE TRADING CANDIDATES SHOULD NOT BE VIEWED AS INVESTMENT ADVICE.
I view EarningsBeats.com as a market research, market guidance, and market education platform. We do not attempt, in any fashion, to manage anyone's money. We have no idea the risk tolerance of each of our members, nor do we have any idea of your financial goals and objectives. It would be irresponsible for us to provide advice to any of our members. Therefore, please consult your own financial advisor before considering any buy/sell decisions. You are completely responsible for the financial decisions that you make.
Last week's featured Model Trades
We've been avoiding Model Trades, mostly because of the dangerous volatile conditions and the frequent rotation from sector to sector. Just as one sector gets hot, money rotates away from it and moves into a different sector. Personally, I've been sticking primarily with the QQQ (ETF that tracks the NASDAQ 100) as I believe the stock market is in place and I look for more growth-oriented areas of the market to outperform as inflation fears subside and interest rates retreat. During advances, my plan is to leverage into the QLD a bit. 20-day EMA tests represent the best reward-to-risk opportunities to enter leveraged ETFs, in my opinion.
I do want to provide you with solid trading candidates, however. So below are MANY trading candidates that you can consider:
From Strong Earnings ChartList (SECL):
WIX:
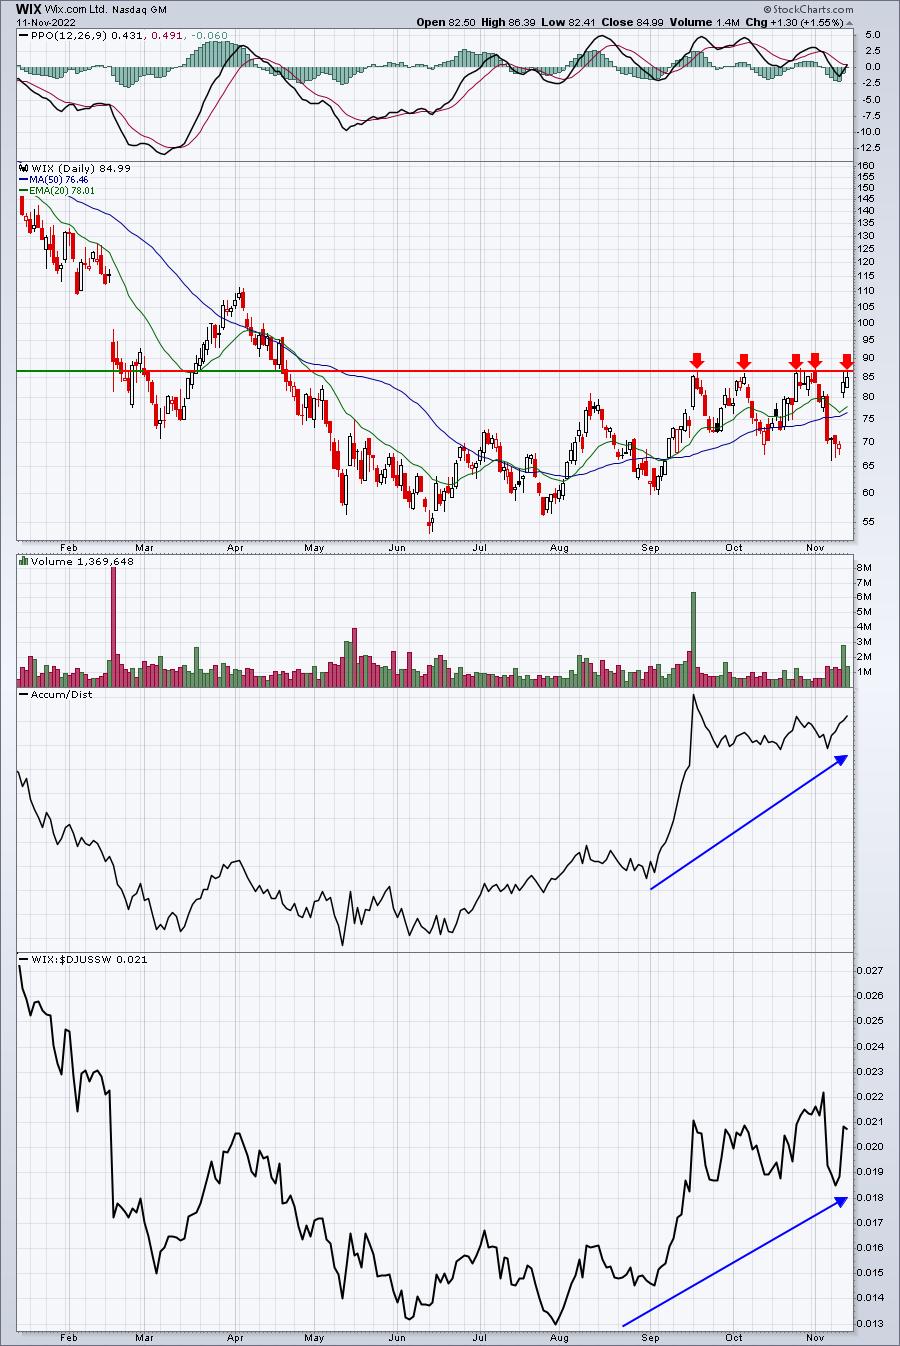
WIX has been a strong relative performer in software ($DJUSSW) over the past few months, but we haven't yet seen an open or close above 86.74. If WIX can break through that key resistance, I could see a significant move higher. The rising 20-day EMA is where I'd look for support.
DOCS:
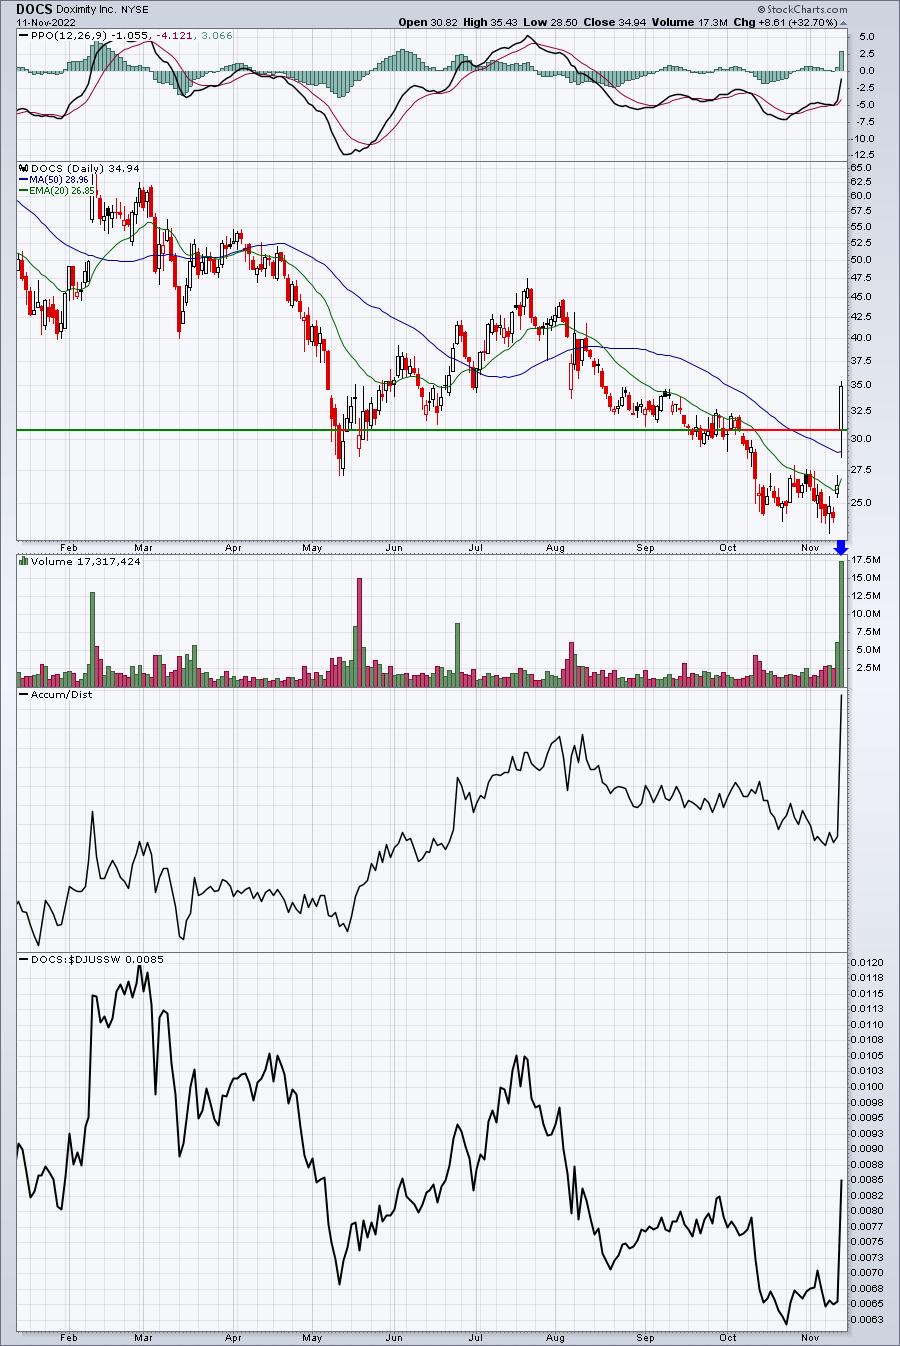
When I see THAT kind of volume accompany a move higher and the stock closes at or near its high of the day, it's a significant signal of heavy demand and accumulation. Therefore, buying on weakness becomes my strategy. Now you might think, "well, there's no way DOCS moves back close to that open at 30.82, but I've seen much crazier things. I don't like chasing after a move like this, but showing some patience can pay off. One way to be disciplined and organized is to use the Alerts feature at StockCharts.com. From "Your Dashboard", click on the blue gearshift (looks like the first picture below) and make sure that you've checked "Scans and alerts".

Once you've done that, scroll down on the page until you see the "Alerts" area. I added an alert for DOCS crossing below $31.00. That'll prompt me to look at the chart and decide whether to place my order. Now my Alerts area looks like this:
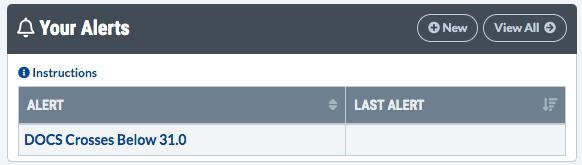
I set it up so that I'd receive a site notification as I'm usually on StockCharts.com. As a backup, I also asked for a text to my cell phone. A third option would be an email.
FICO:
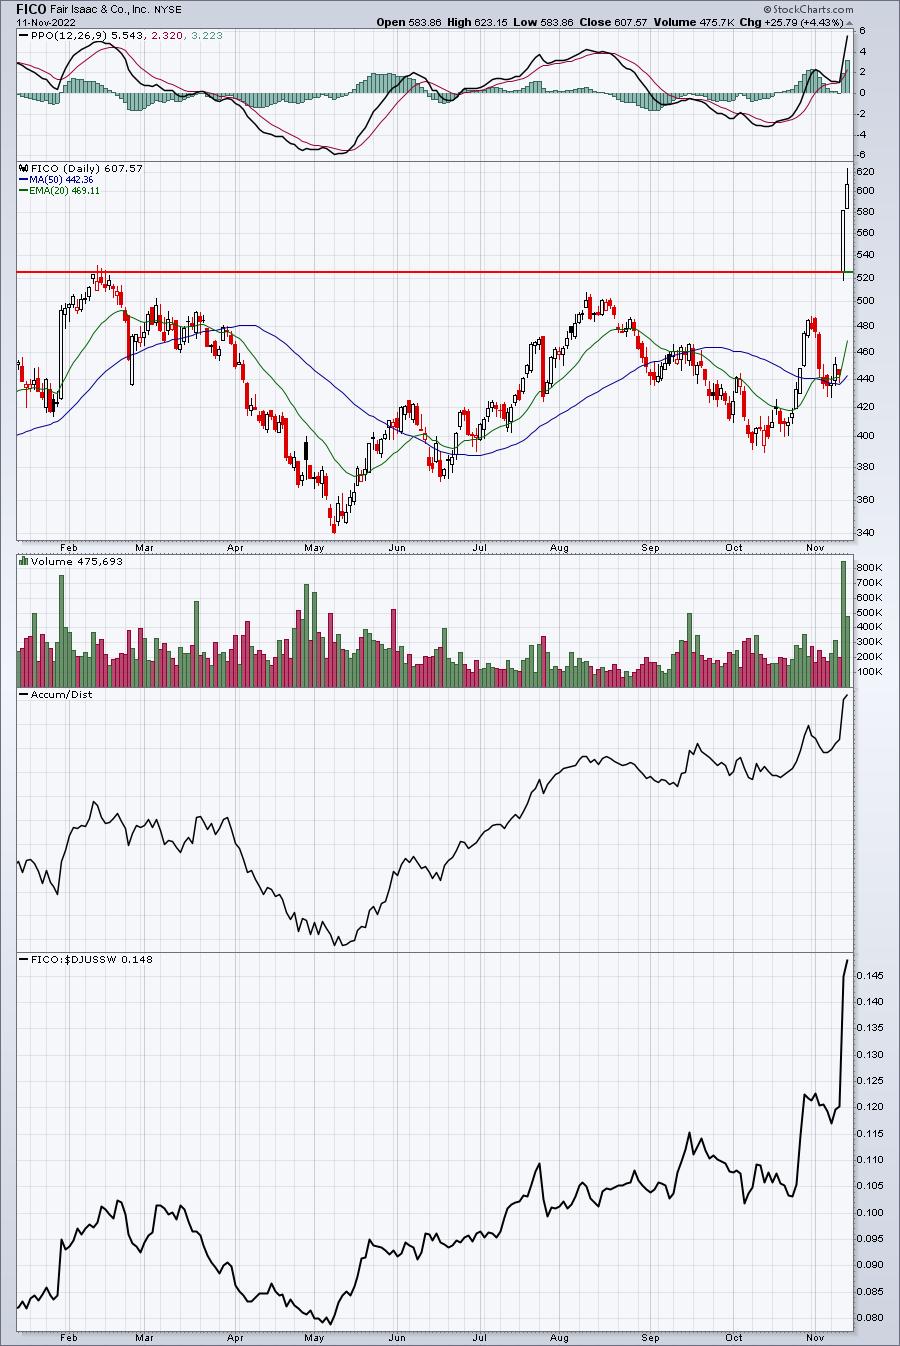
Similar to DOCS. FICO had its highest volume of the year when it gapped up on Thursday to 525.74. Any move back down at or near that level and I'd be very interested in a potential buy.
ARCT:
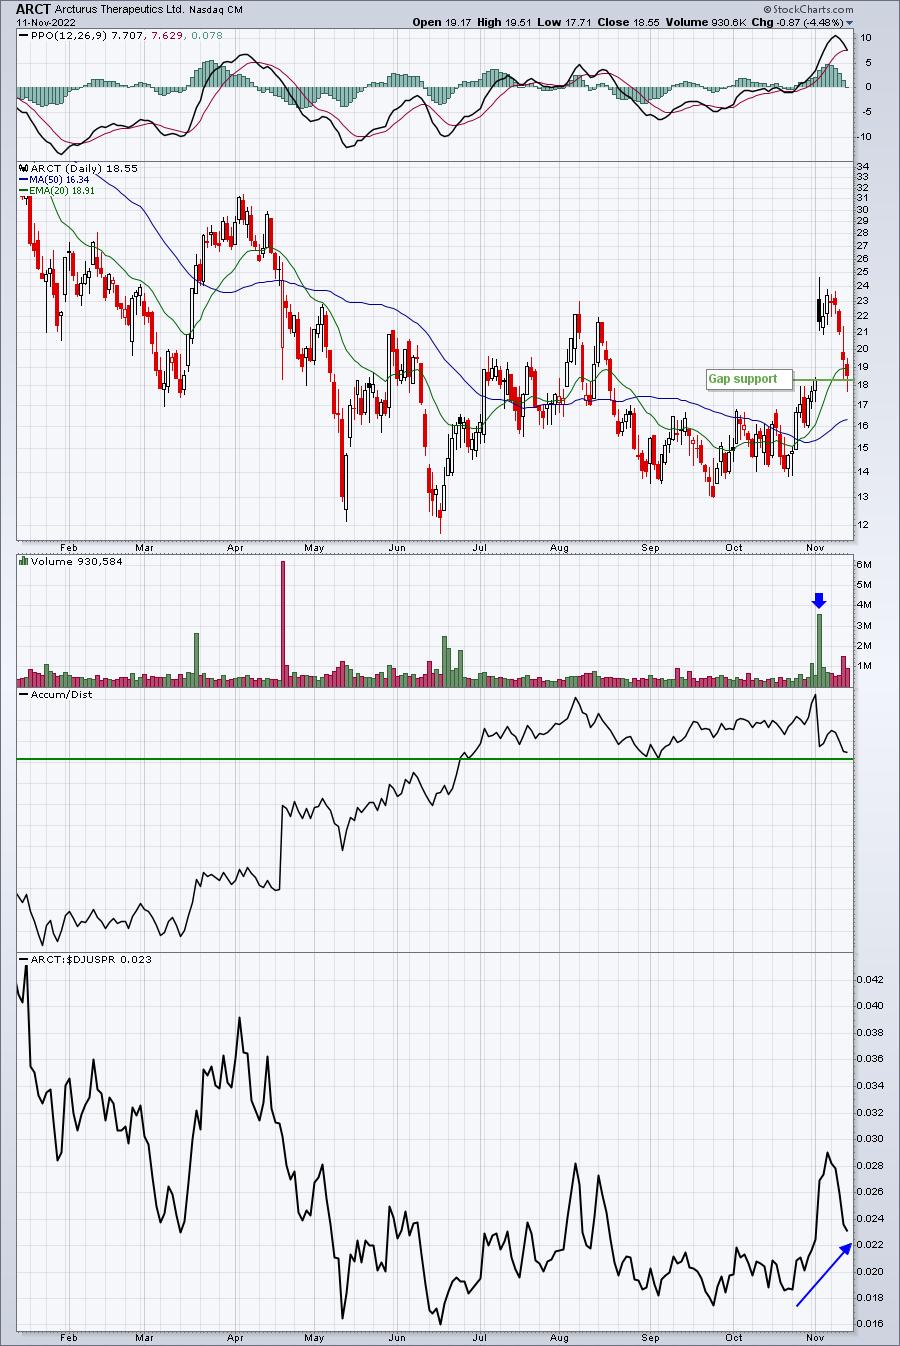
ARCT represents more of a "trade now" if you're interested. After gapping up from 18.28 on November 2nd, ARCT ultimately reached 24.65, before tumbling more than 8 bucks, or roughly 33%, in just 7 trading days. I know it seems impossible for suddenly-hot stocks to fall like that, but it happens. That's why I hate chasing stocks. We think they'll just keep skyrocketing, but if you lose 33% in 7 days, that is PAINFUL. Buying at gap support may not work either, but at least we can keep a fairly tight stop.
AFG:
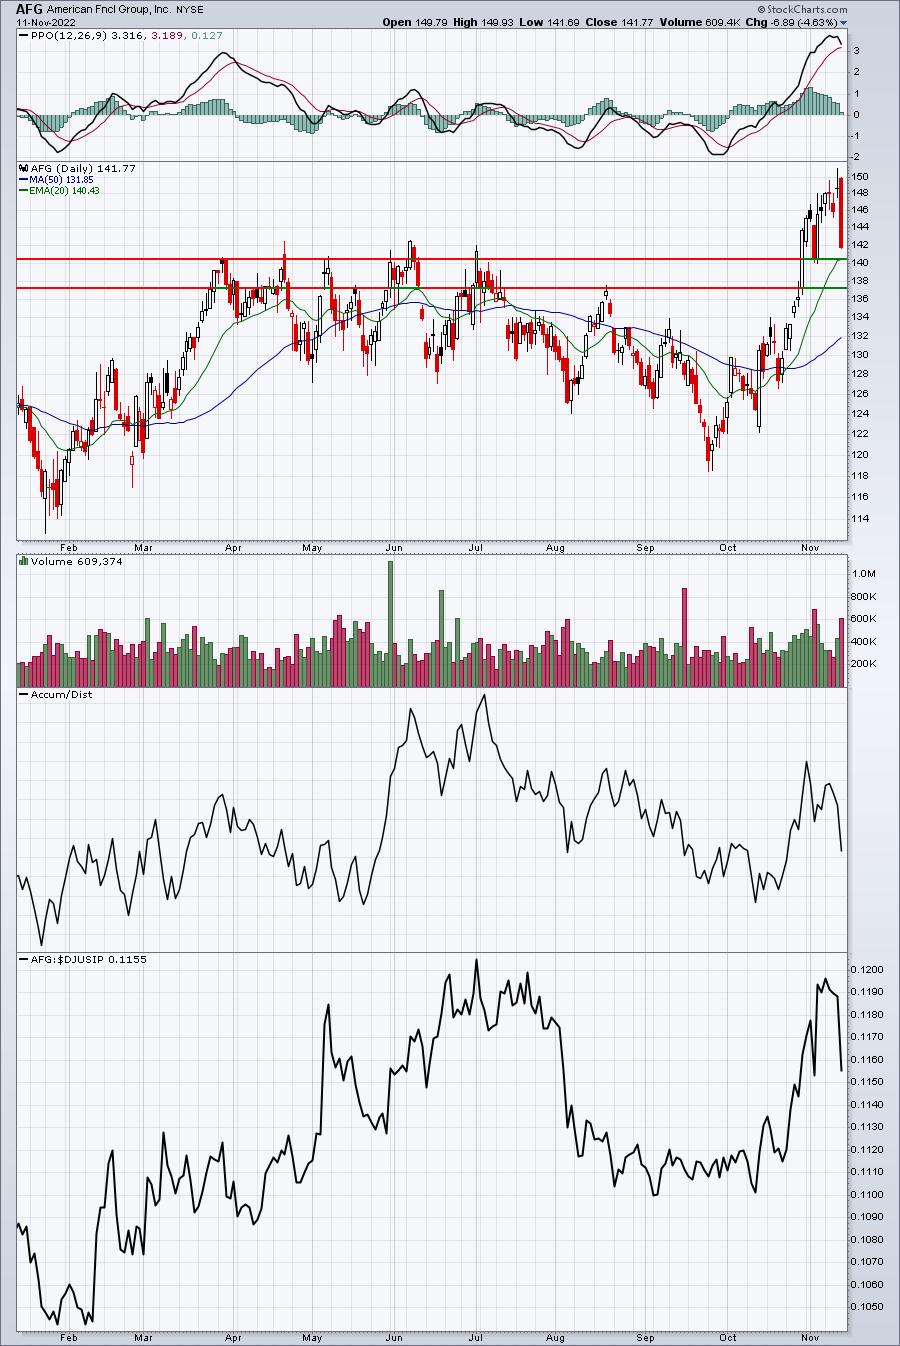
While technology stocks were soaring on Thursday and Friday, the recently-hot insurance area cooled off. That could provide some excellent short-term opportunities on pullbacks. AFG had a beautiful breakout recently on increasing volume and has now pulled back. I prefer it on a 20-day EMA test near 140. That's also the recent price low in early November. A quick reversal and 10-dollar gain shouldn't be ruled out here.
LLY:
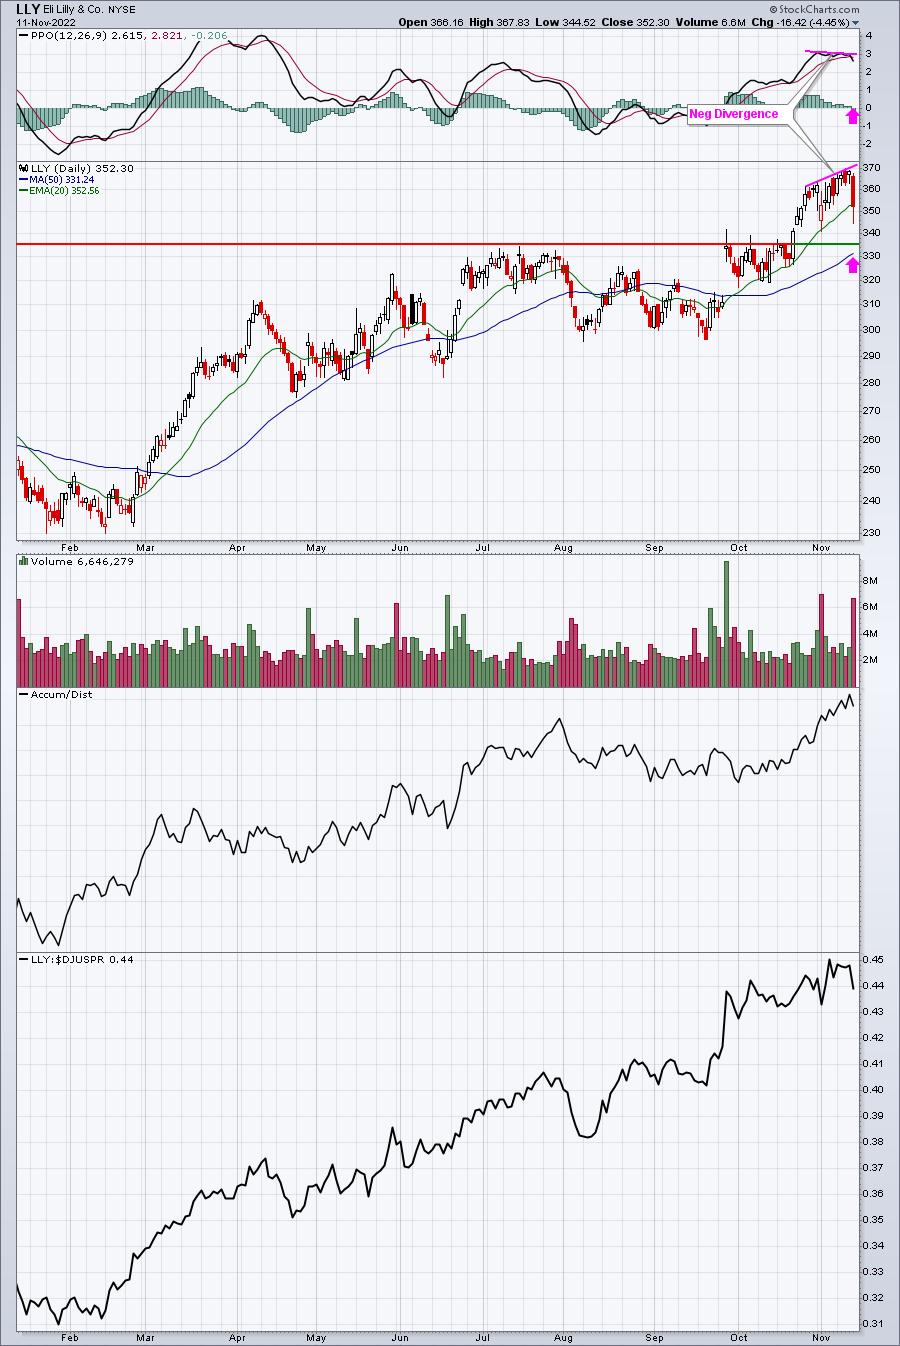
Like insurance, many health care stocks are seeing some profit taking as money rotates. LLY produced an excellent quarterly earnings report, pulled back initially, before moving up and setting a new high. Unfortunately, the latest high was accompanied by a slight negative divergence. That typically results in a test of the 50-day SMA, which just so happens to coincide with a key price support near 335. That would be an excellent reward-to-risk entry as the 50-day SMA climbs just beneath that level.
The Week Ahead
Heading into last week, it seemed as though the pressure was on the bulls to clear key price and moving average resistance. After the better-than-expected CPI numbers on Thursday morning and the massively bullish reaction, the picture has clearly changed. The S&P 500 has seen a golden cross, where it's 20-day EMA crossed back above its 50-day SMA. Therefore, the chart configuration is one that's much more bullish with price action above the 20-day EMA, which, in turn, is above the 50-day SMA. We are uptrending....until proven otherwise.
I anticipated a test of the middle channel support line early during this cyclical bear market. We've seen that and now we appear to be trending back above it. Here's what it looks like on the S&P 500:
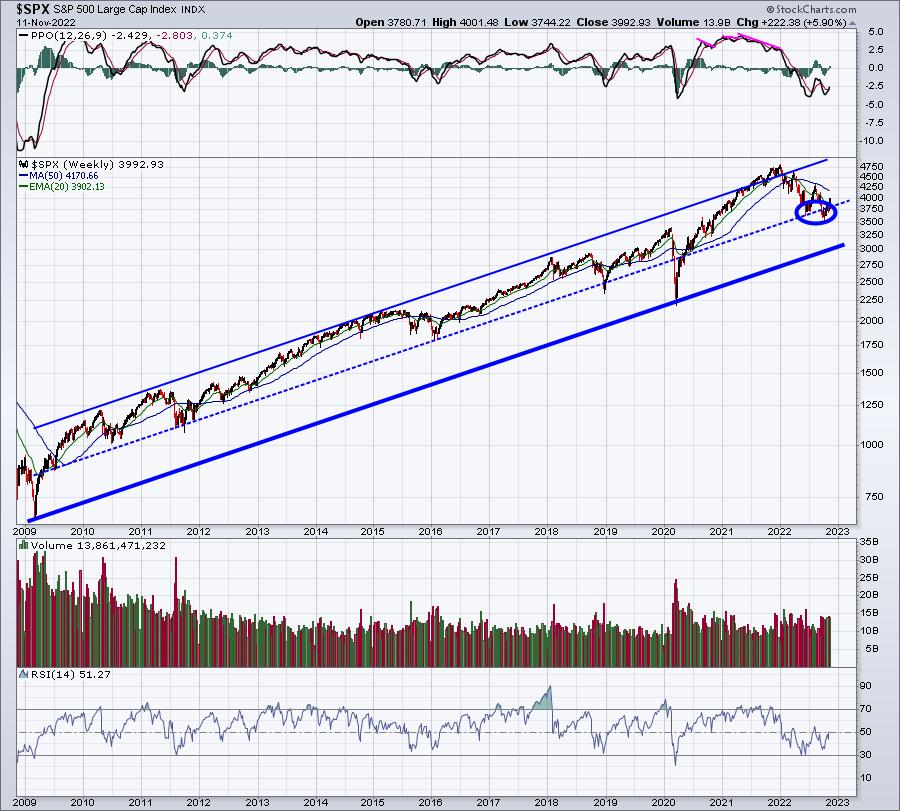
The long-term secular bull market supports the notion that we're once again heading higher. As I said above, until the market proves me wrong, I'm 100% in on this being the next secular bull market advance.
Happy trading!
Tom Bowley, Chief Market Strategist
EarningsBeats.com
"Better timing. Better trades."