
EB Weekly Portfolio Report - Sunday, January 22, 2023
Upcoming Earnings Reports
According to Zacks.com, the following companies will be reporting earnings this week and each is a component of one of our portfolios:
Monday, January 23: None
Tuesday, January 24: TRV
Wednesday, January 25: IBM, ADP
Thursday, January 26: MUR
Friday, January 27: BAH
PLEASE NOTE: The above companies were provided using Zacks.com. We do hold our portfolio stocks through one earnings report, but every EarningsBeats.com member must make his/her own investing/trading decisions about holding stocks into earnings reports as it's the most volatile (risky) time to own a stock.
Portfolio Rules and Objectives
Here are the common traits and objectives of our portfolios:
- There are 10 leading stocks from up to 10 leading industries in each portfolio (at the time of selection). Generally, there will only be one stock per industry group, but there could be exceptions.
- They are typically held for an entire 90-day period, with no stops in place. We strive for consistency, transparency, and simplicity in our portfolios. EB.com members may hold these stocks for the entire 90 days, trade them, use stops, etc., but for purposes of our calculation, we will likely make no exceptions to our "buy and hold for three months" strategy.
- Every stock will generally be held through ONE earnings report
- The expectation is that relative winners will carry the portfolio to outperformance
- All portfolio stocks were announced on Thursday, November 17th, and were all entered into as of the close on Friday, November 18th for tracking purposes
- Primary objective is to outperform the benchmark S&P 500 over time; quarter-to-quarter performance can be extremely volatile, especially if significant rotation takes place intra-quarter
Here are several considerations for EB members:
- The Income Portfolio should have the least amount of volatility as it will typically be comprised of quality large cap stocks with solid dividends
- The Model and Aggressive Portfolios should be viewed similar to aggressive growth funds; they will typically have a lot of volatility and periodic drawdowns can be significant from time to time
- The Income portfolio stocks will all pay dividends, with the expected average dividend yield to be at least 1.0%
- Drawdowns (losses) should be much milder on the Income portfolio, with more volatility expected on the other two; please review inception-to-date charts below to gain an idea of the volatility associated with each
- I believe the larger drawdown on the Income portfolio at the beginning of the pandemic was an anomaly, occurring as many defensive, higher-yielding companies uncharacteristically underperformed during a market decline.
- Large drawdowns in the February through May 2021 and the November 2021 to February 2022 periods were due to the rapid rotation from growth stocks to value stocks; each quarter, our portfolios are based on themes and there is never a guarantee that our analysis and beliefs will be proven correct
- Consider owning or trading these stocks in whatever manner is most comfortable for you; while we will buy all 10 stocks in the manner identified above, feel free to trade certain stocks or wait for pullbacks if the stocks are overbought
- We have no idea what risk each member is willing or able to take. We are not registered investment advisors so be sure you understand the risk you take. Please consult your financial advisor.
- EarningsBeats.com shareholders/employees may own all or some of the portfolio stocks from time to time.
Weekly Snapshot
Here's a weekly recap:
Weekly Summary
Benchmark S&P 500:
We saw a bit of a character change in the way the S&P 500 traded last week vs. other similar rebounds in 2022. I shared an S&P 500 chart recently, highlighting how the prior rebounds have evolved and, ultimately, led to further downside. The current version, however, looks a bit different:
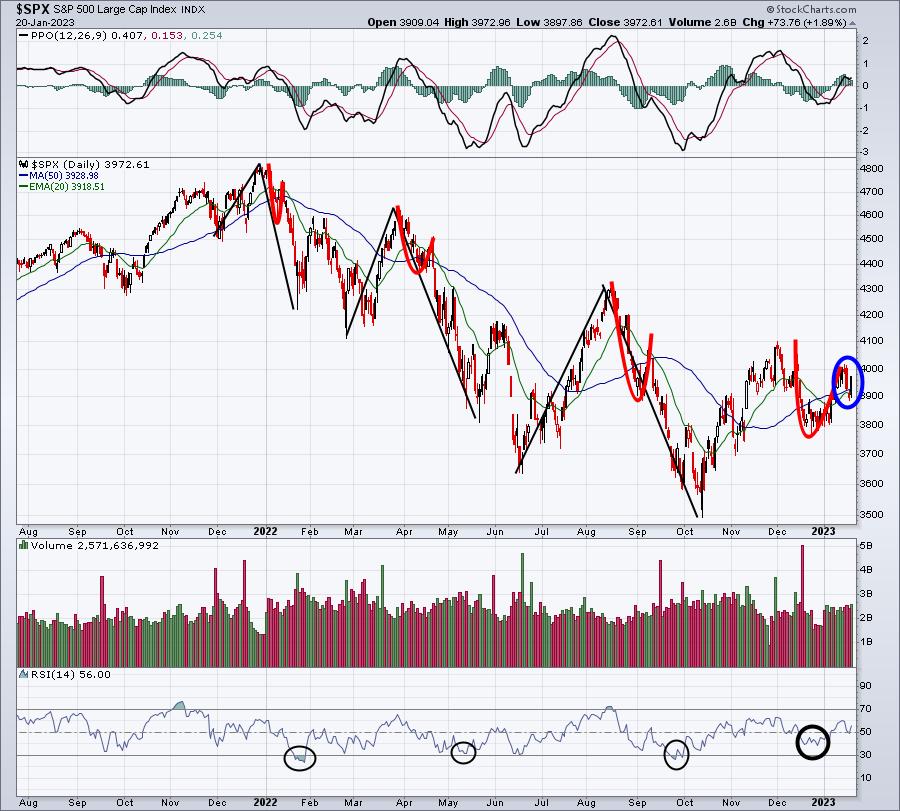
The bold, dark circle in the RSI panel first highlights that the recent selling did NOT take the RSI back beneath 40. That's different than previous versions of the 2022 bear market. When RSI holds 40, it begins to provide characteristics of a bull market advance. Last week, though, another key development took place. Note that the prior 3 key market tops in 2022 had a "hook" print after the top. In all 3 previous cases, the "hook" was followed by abrupt selling and a swift move lower. In this case, the S&P 500 fell back quickly below its 20-day EMA, only to recover solidly back above it on Friday on slightly higher volume. This certainly doesn't mean the bottom is confirmed, but it is another bullish development that is different than what we saw in 2022. I believe 2023 is going to be a very solid year, one in which it's obvious that the 2022 bear market was of the cyclical (short-term) variety. Friday's action was a step in that direction, but the biggest confirming piece will be a closing price on the S&P 500 above 4110. Will it happen next week? Early February? We'll soon find out.
Model Portfolio:
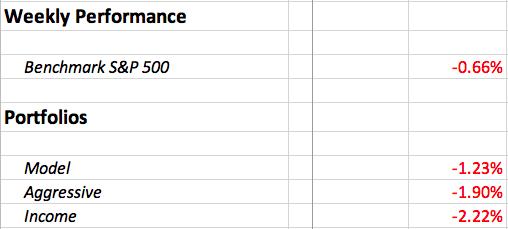
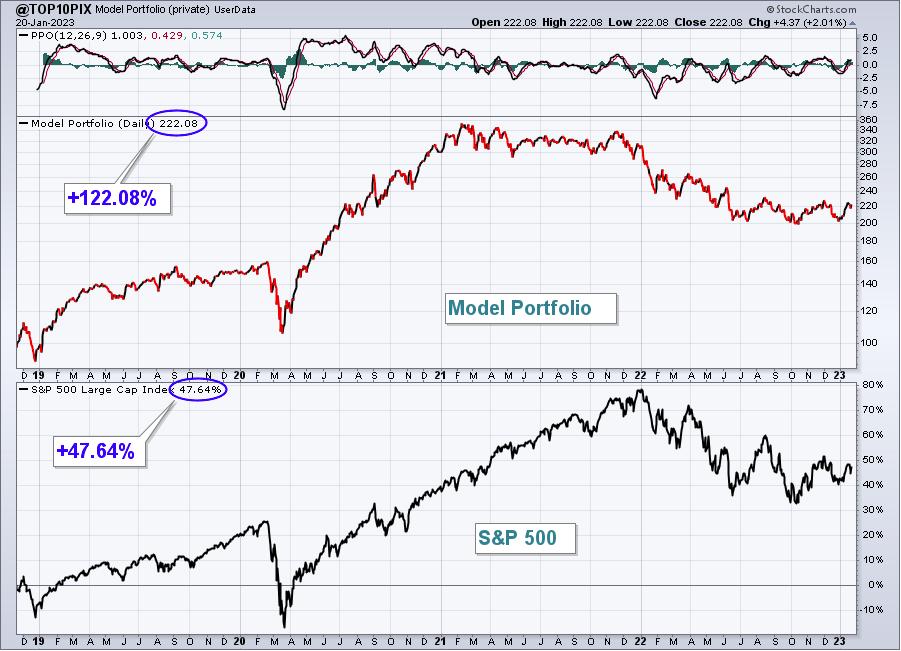
The Model Portfolio dropped 1.23% last week, underperforming the S&P 500. Here's the updated inception-to-date chart of the portfolio:
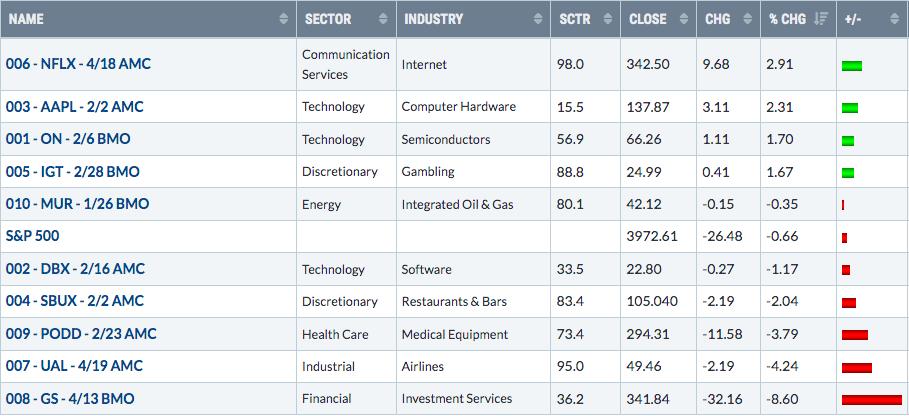
Here are how the Model Portfolio component stocks performed last week:
Aggressive Portfolio:
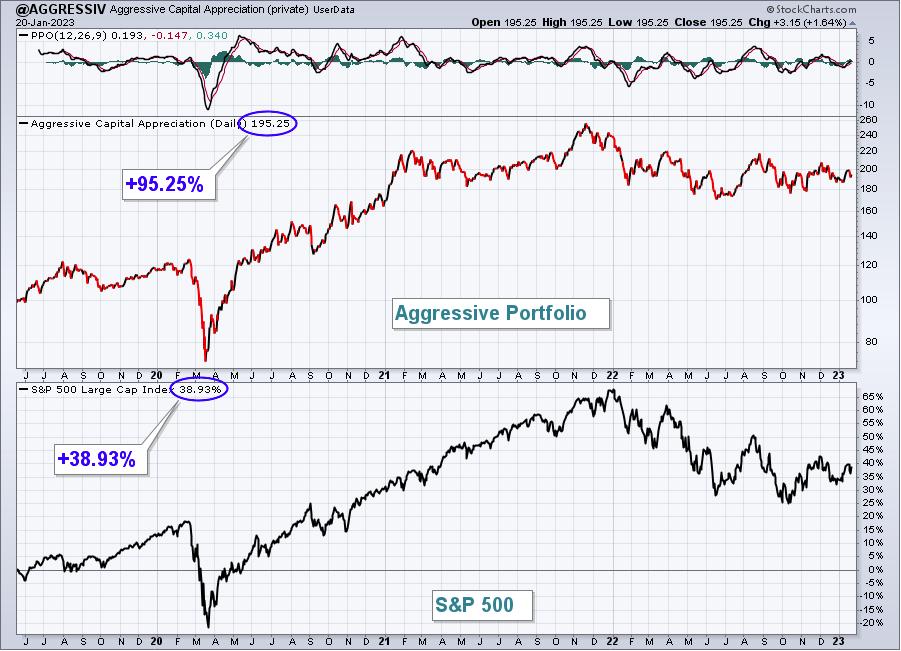
The Aggressive Portfolio fell 1.90% last week, underperforming the S&P 500. Here's the updated inception-to-date chart of the portfolio:
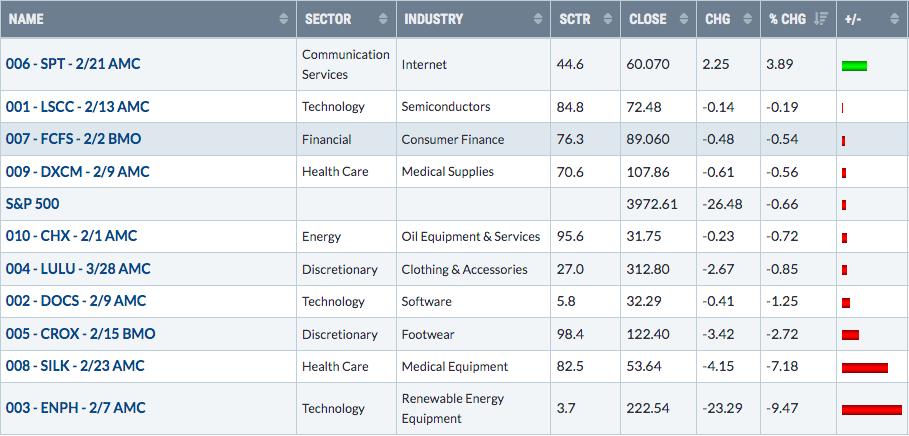
Here are how the Aggressive Portfolio component stocks performed last week:
Income Portfolio:
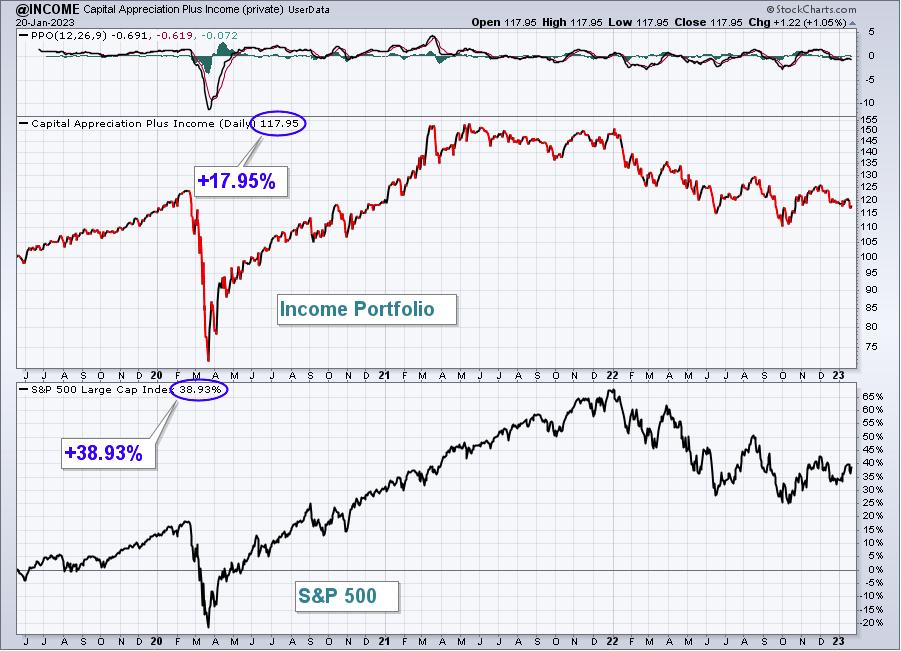
The Income Portfolio declined 2.22% last week, underperforming the S&P 500.
Here's the updated inception-to-date chart of the portfolio:
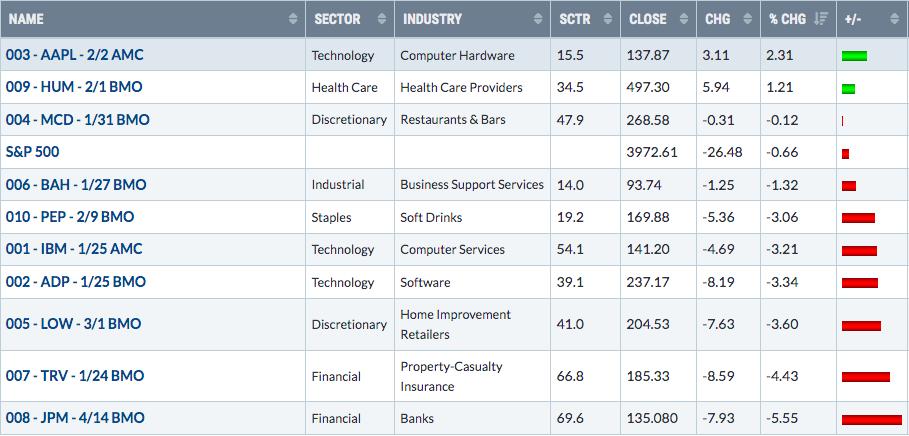
Here are how the Income Portfolio component stocks performed last week:
Model ETF Portfolio
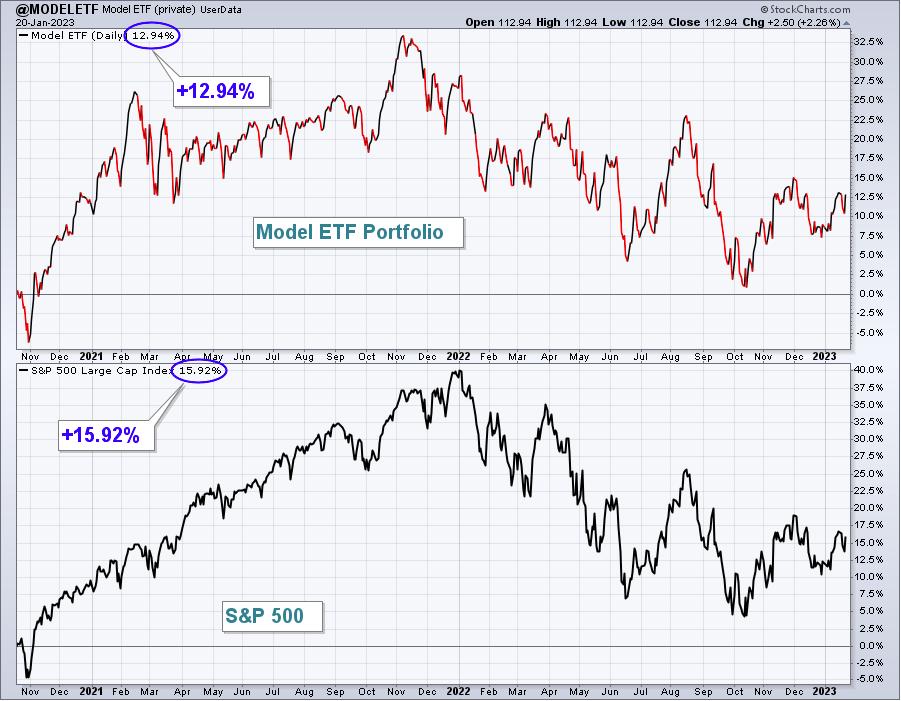
Our Model ETF Portfolio dipped 0.19% last week, outperforming the S&P 500.
Here's the updated inception-to-date chart of the Model ETF Portfolio:
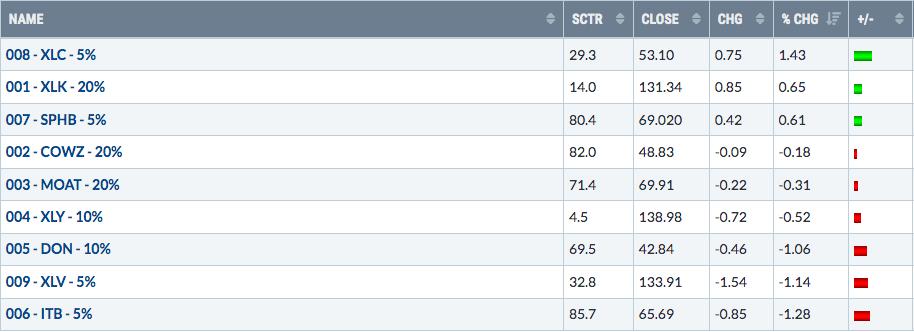
Here are how the Model ETF Portfolio components performed last week:
Model Trade Setups
I will provide Model Trade Setups each week in this Weekly Portfolio Report, which will simply be to outline possible trades based on key support, resistance, relative strength, and where these trades come from. For instance, my trading strategy for Strong AD ChartList (SADCL) stocks might be completely different than my trading strategy on Strong Earnings ChartList (SECL) stocks. Obviously, it would be different from a Short Squeeze ChartList (SSCL) trading candidate. I'll lay out the annotated chart and my reasoning for the (potential) trade. I may provide follow-up on some or all of these setups in the Daily Market Report (DMR). I'll also provide full disclosure, if I own any of the setups provided. Feel free to trade these Model Trade Setups based on the annotated charts provided, or according to your own trading strategy. Or ignore them. It's completely up to you. I am not a Registered Investment Advisor (nor is EarningsBeats.com). THESE TRADING CANDIDATES SHOULD NOT BE VIEWED AS INVESTMENT ADVICE.
I view EarningsBeats.com as a market research, market guidance, and market education platform. We do not attempt, in any fashion, to manage anyone's money. We have no idea the risk tolerance of each of our members, nor do we have any idea of your financial goals and objectives. It would be irresponsible for us to provide advice to any of our members. Therefore, please consult your own financial advisor before considering any buy/sell decisions. You are completely responsible for the financial decisions that you make.
Last Week's Setups
Here were the setups provided last week and how they performed:
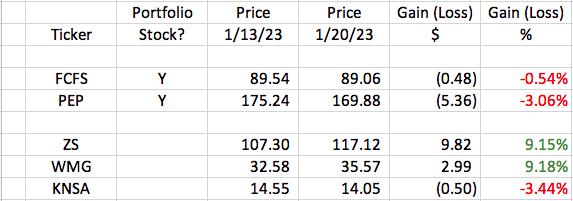
The S&P 500 finished the week down 0.66%, so having 2 of our 5 setups up nearly 10% makes last week's setups very strong. Our best pick is hard to say between Z and WMG, but I'd probably go with the latter as WMG was consistently strong throughout the week, where you would have had to withstand a lot more volatility with ZS. ZS, however, produced huge gains quickly, opening down at 105.19 on Tuesday morning and hitting its high for the week at 118.89 just 24 hours later. I also had provided a quick target of 115-120 last week, which provided an opportunity to book that huge profit within just a day. Again, the argument for which was better could go either way.
The worst call was simply my belief that beaten-down defensive stocks would offer us up the best opportunity, given the options-related risk in the market last week. As it turns out, the major selling that took place last week was concentrated in those defensive names as PEP and KNSA both struggled as components within soft drinks ($DJUSSD) and pharmaceuticals ($DJUSPR), respectively. The market is never easy, even when you make an appropriate cautious call.
This Week's Setups
Every week, I will provide setups among our Portfolio stocks and our ChartList stocks. My preference is to trade Portfolio stocks, when appropriate. These stocks are in our portfolios for a reason - they're generally leaders within leading or improving industries.
We are not far from a HUGE test of the S&P 500 downtrend line, which now intersects very close to the 4000 level. I've updated this chart, which appeared in our Daily Market Report (DMR) at the end of December:
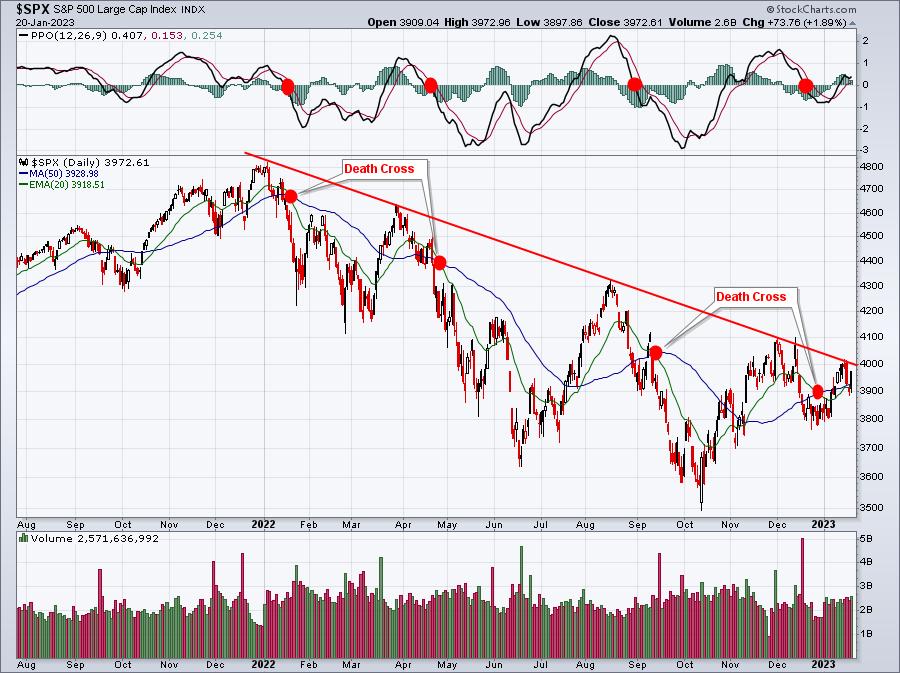
Trend lines are somewhat subjective and can be drawn in various ways to fit each trader's eyes. You can connect intraday prices, closing prices, or some combination of both. But I think we can all agree that 4000 is at least CLOSE to where this downtrend line currently intersects price action. Also, note the 4 "death crosses" provided. A death cross occurs when a short-term moving average crosses beneath a long-term moving average. The last 3 death crosses resulted in HUGE declines before we ever saw the next "golden cross", which is where the short-term moving averages crosses back above the long-term moving average. Unlike the last 3 death crosses, this one has seen a subsequent golden cross before ever coming close to new lows. In other words, the S&P 500 is showing resiliency, one ingredient that was missing throughout 2022. Will it make a difference? I believe it will and that's why I'm remaining on the offensive in terms of Model Trade setups.
Of the following setups, GD REPORTS EARNINGS ON WEDNESDAY MORNING, 1/25.
Portfolio Stocks:
GS:
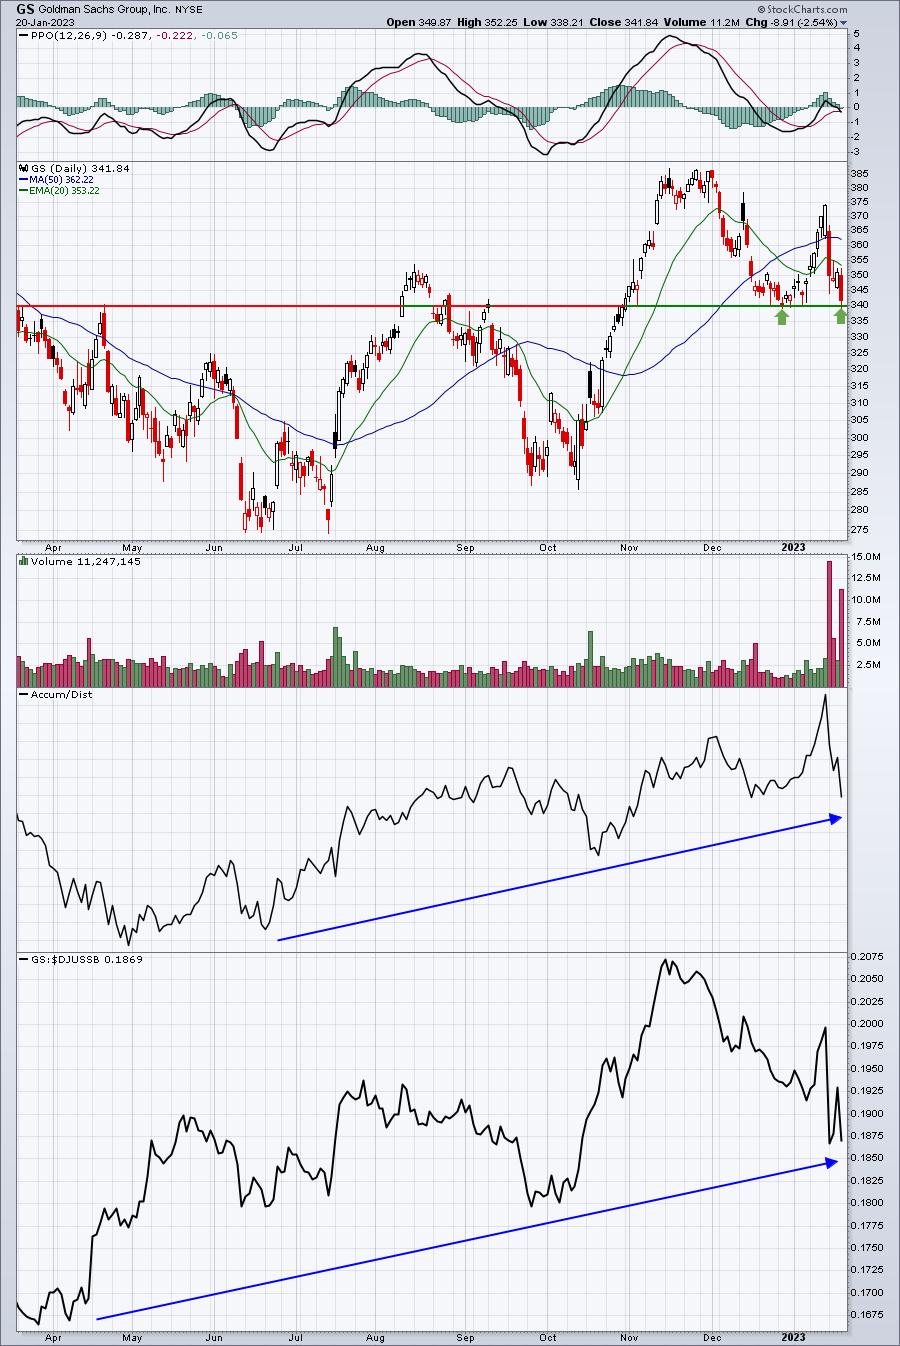
Price support test.
SPT:
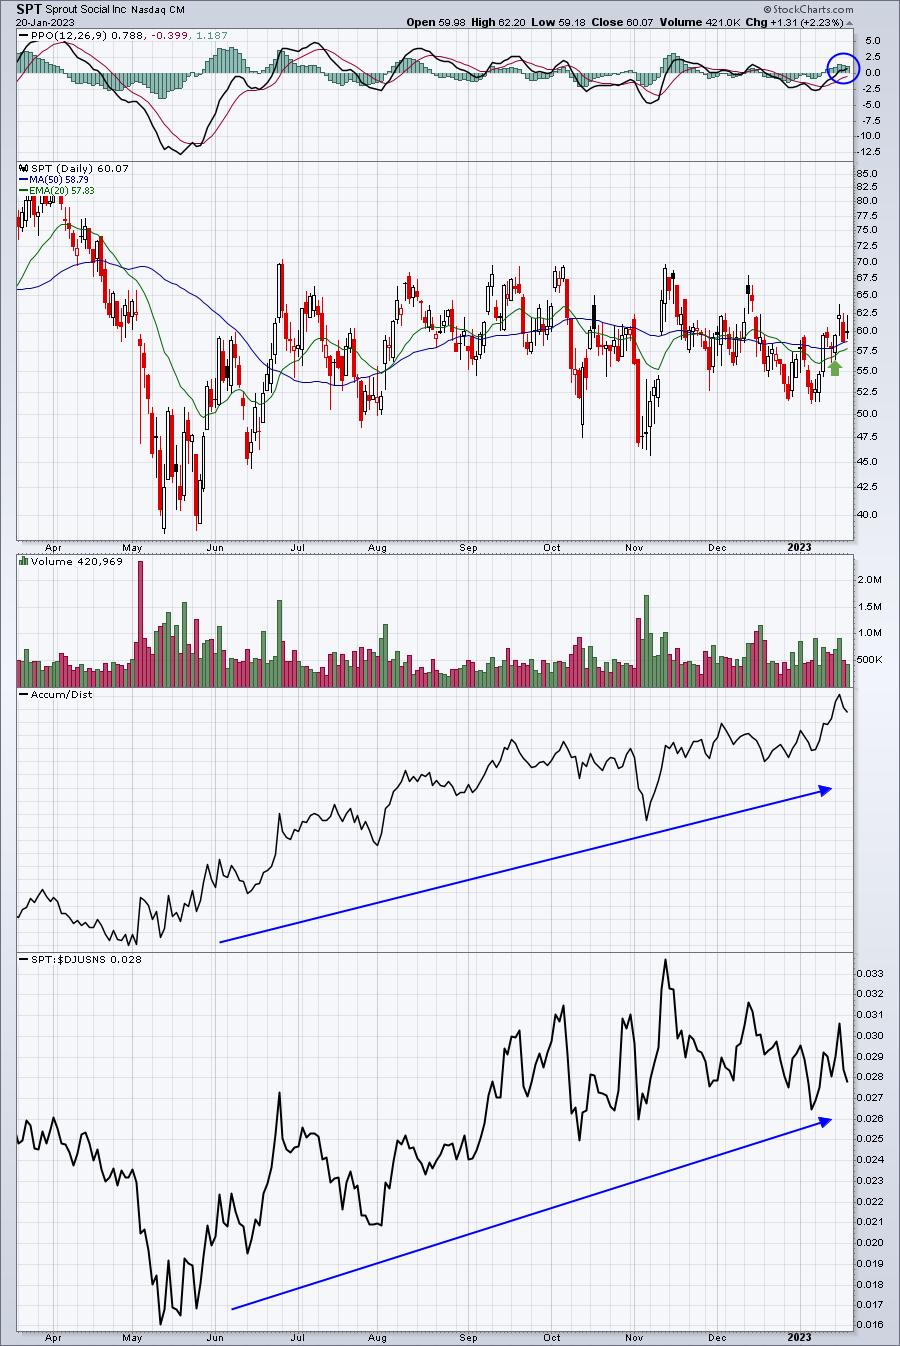
New high on AD line and bullish PPO centerline crossover. Trending above 20-day EMA and strong relative performer in internet ($DJUSNS).
FCFS:
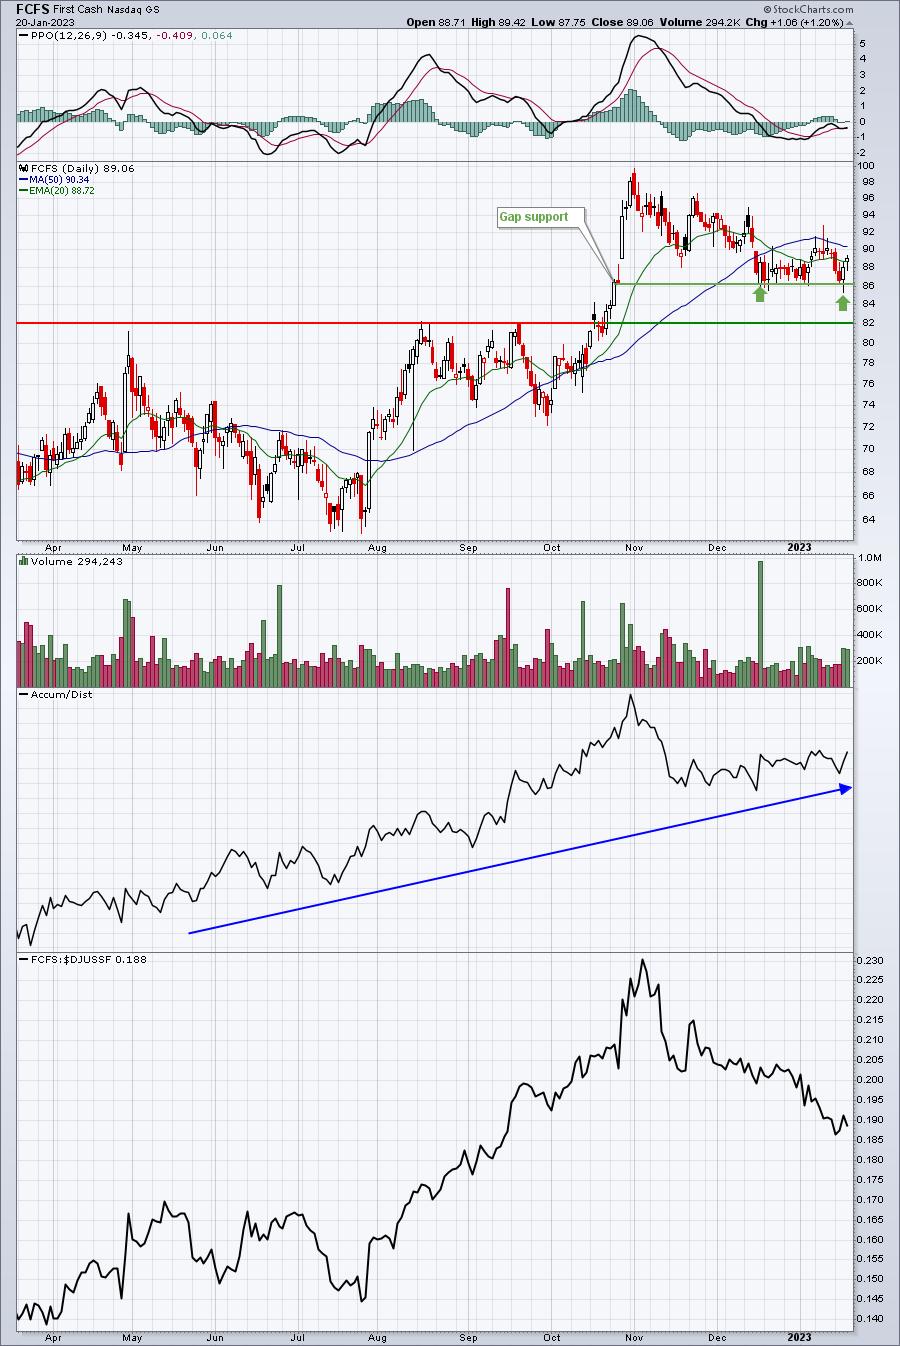
Sticking with this one for another week. Nice Thursday reversal. I'm looking to start the right side of a cup.
SILK:
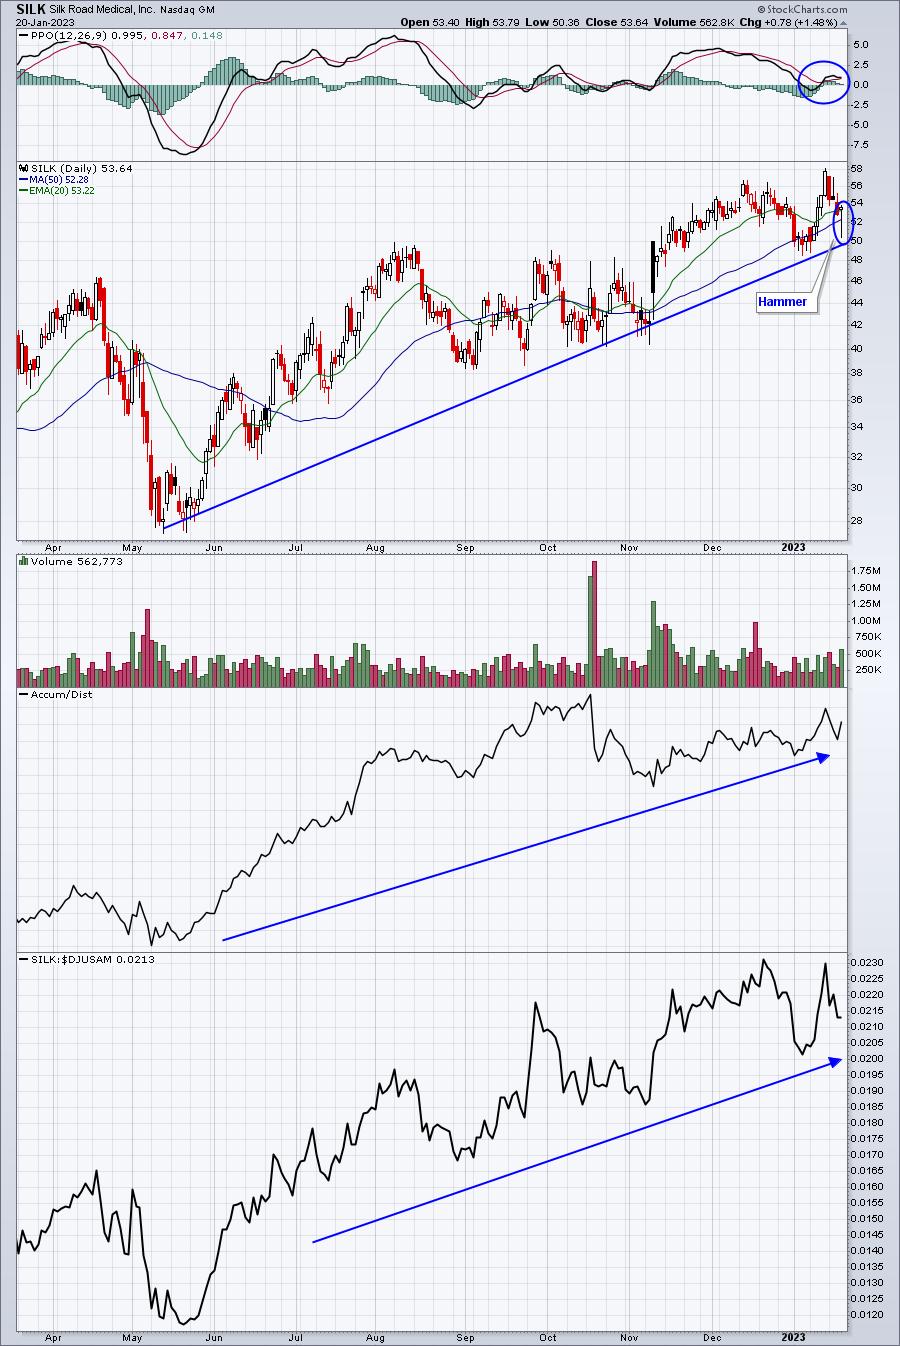
Big week with SILK two weeks ago. I see the potential for another big week ahead. Nice hammer on Friday near trendline support and 20-day EMA. Excellent relative strength.
DXCM:
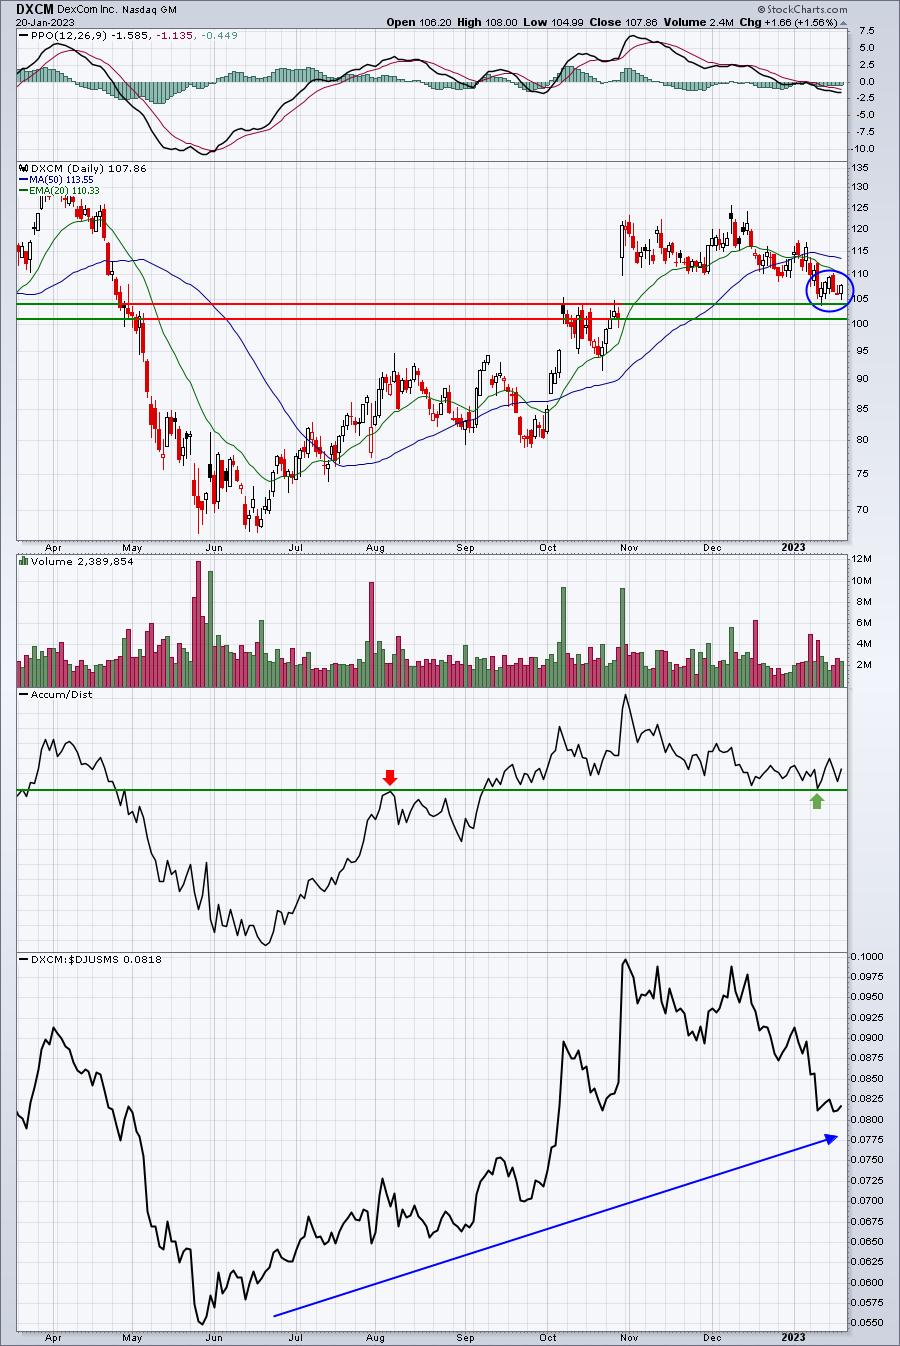
Preparing for launch. 4 nice hollow candles in last 6 days and a rapidly-improving peer group ($DJUSMS).
JPM:
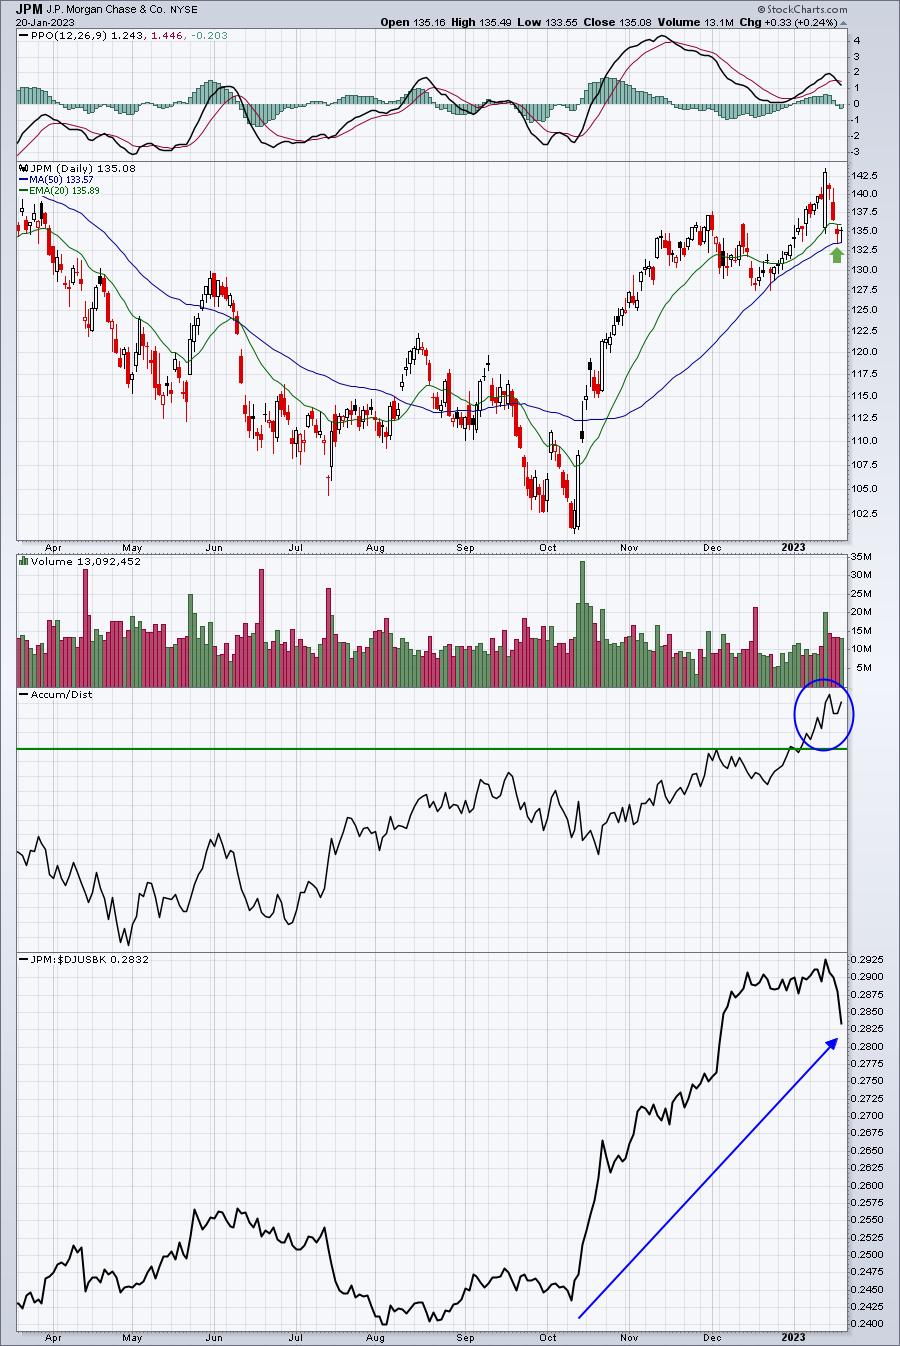
Clearly one of the best bank stocks ($DJUSBK). Love the pullback to 50-day SMA, where we see twin tails from Thursday and Friday.
Other ChartList stocks (all from Strong Earnings ChartList):
HUBB:
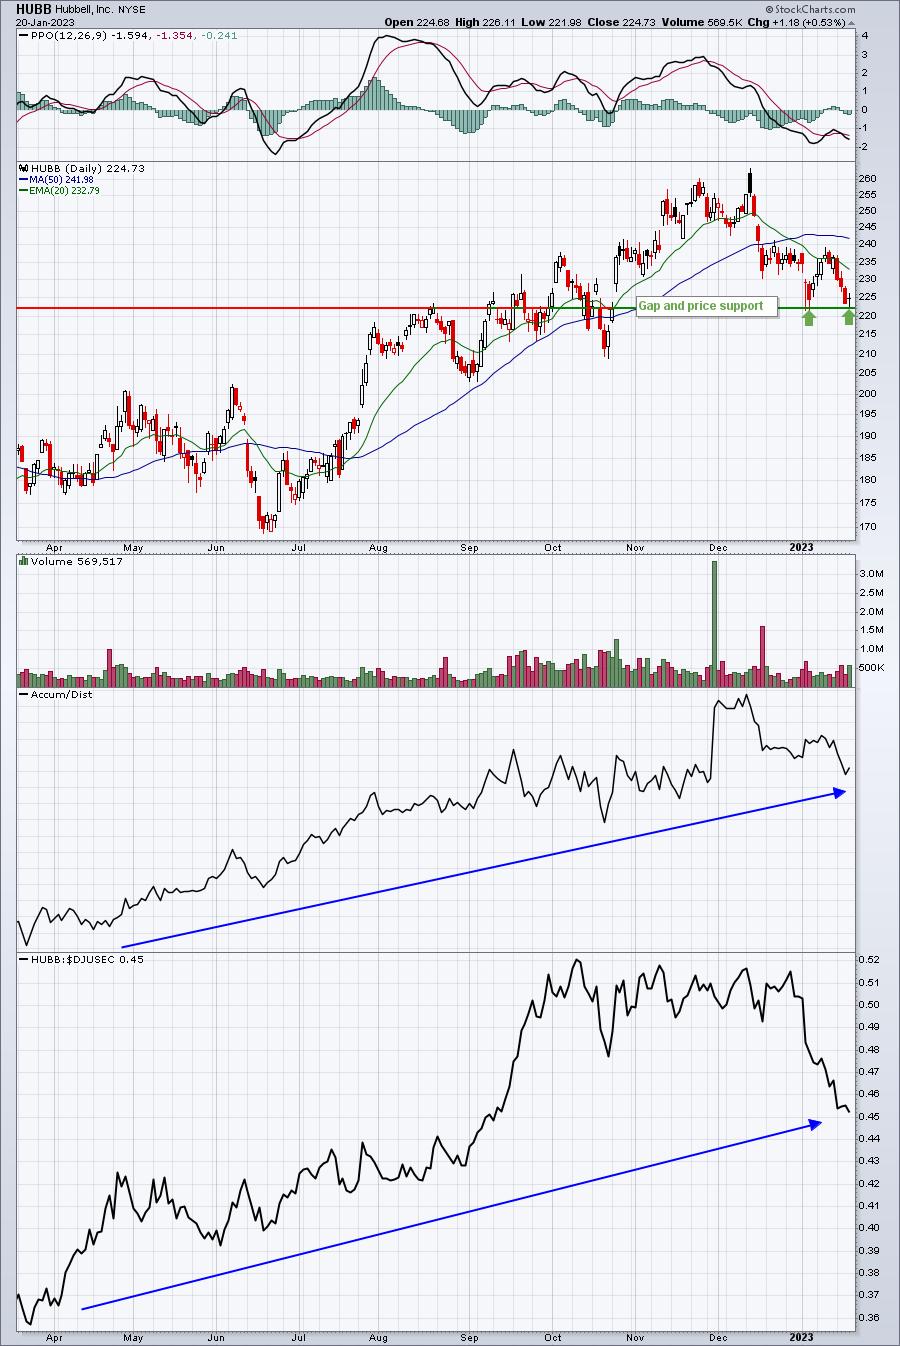
Gap and price support.
JNPR:
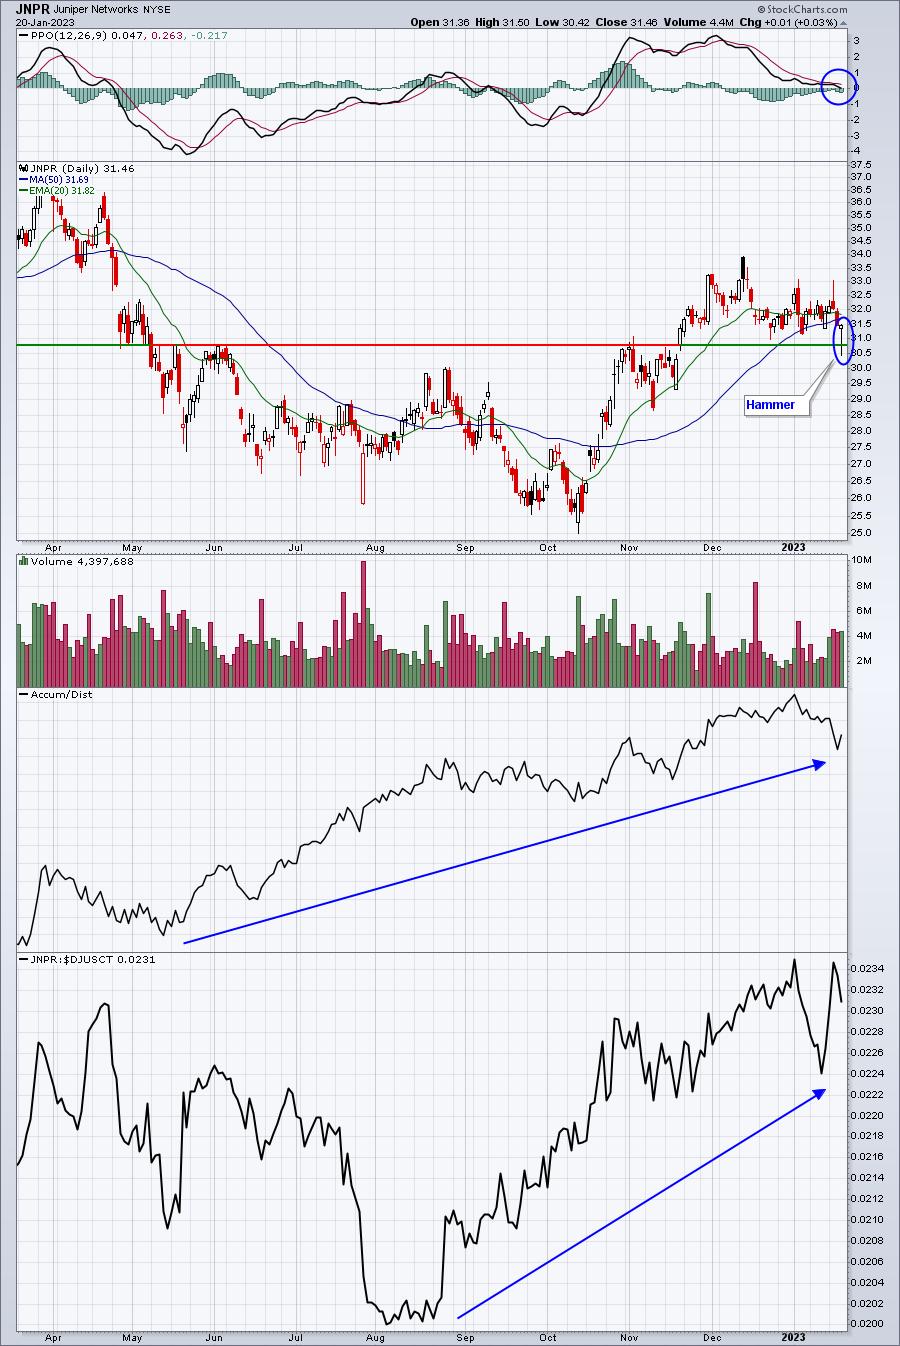
Gap and support test with a hammer on Friday. PPO centerline test. Leader in telecom equipment ($DJUSCT).
GD:
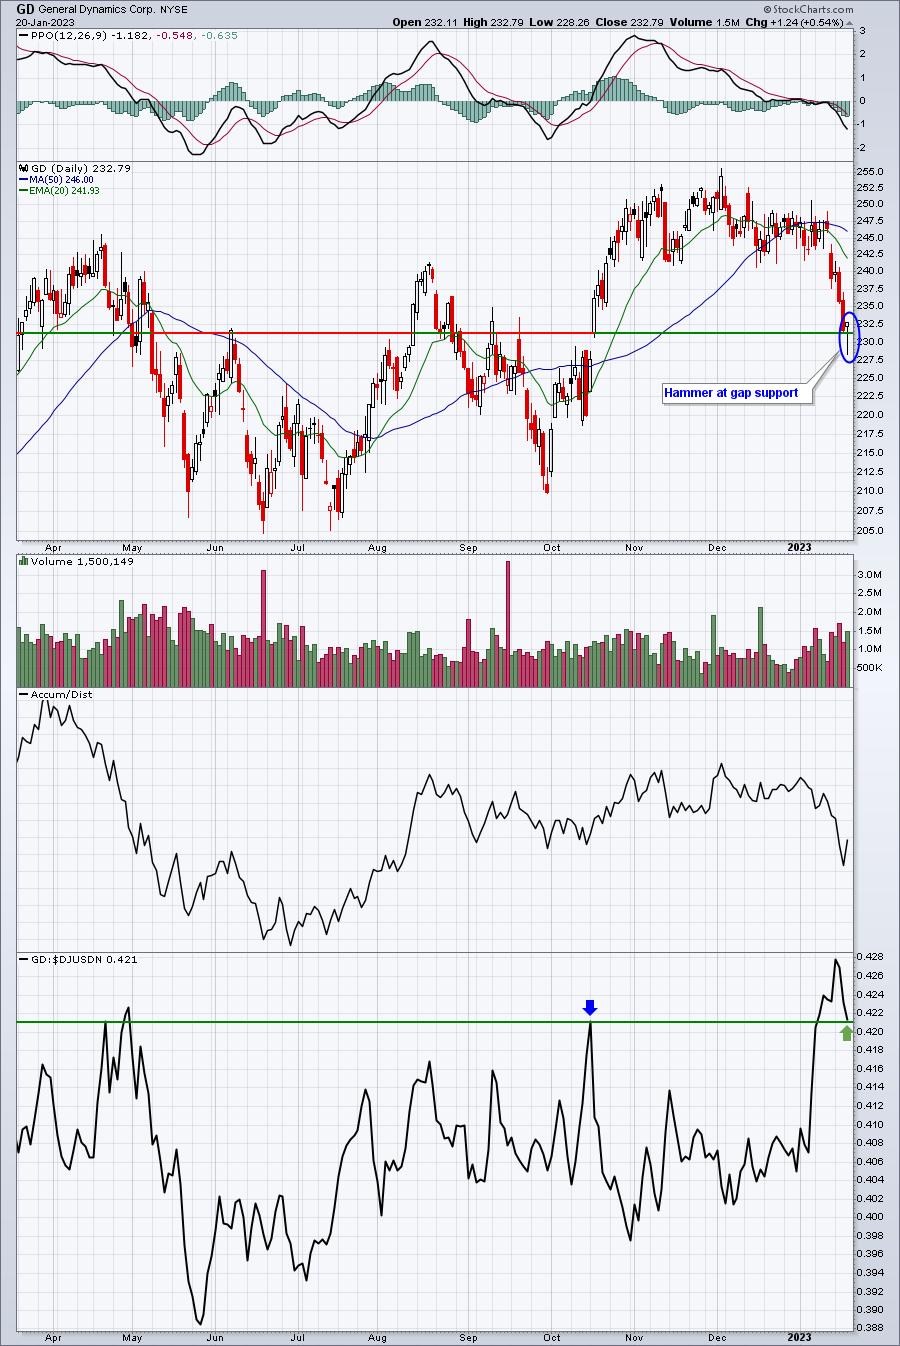
Big relative winner in defense ($DJUSDN) prints hammer on Friday at key gap support. REPORTS EARNINGS ON WEDNESDAY, 1/25. Might be worth a gamble to hold into earnings for those with a HIGH RISK TOLERANCE.
TXRH:
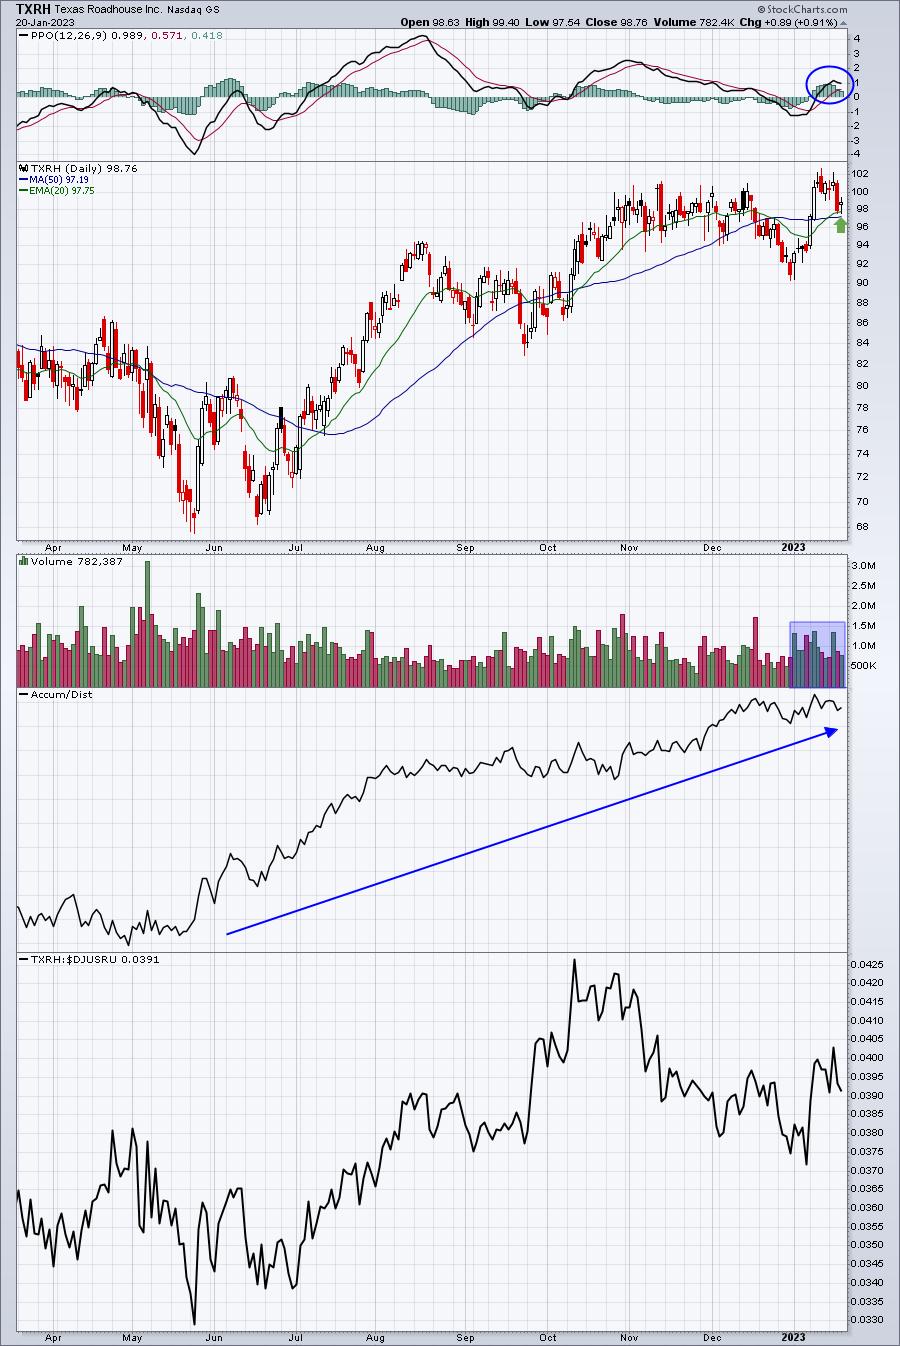
20-day EMA test after the PPO saw a bullish centerline crossover. Volume trends turning more bullish.
PARR:
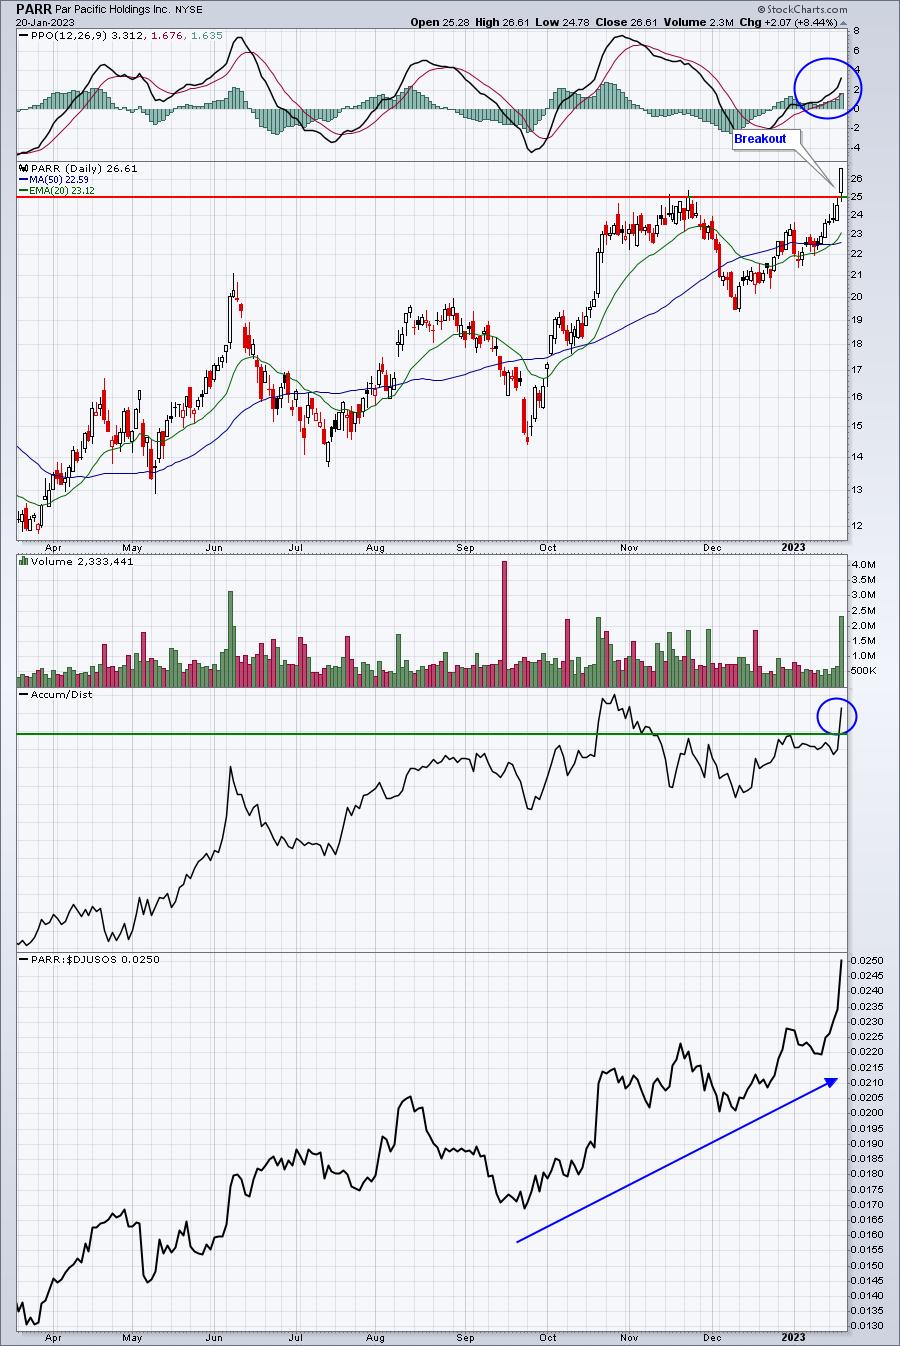
Leader in energy. This is the one breakout candidate for this week. Could see immediate follow through, but I really like stocks like this that pull back to key price and/or 20-day EMA support. Keep it on a Watch List.
APO:
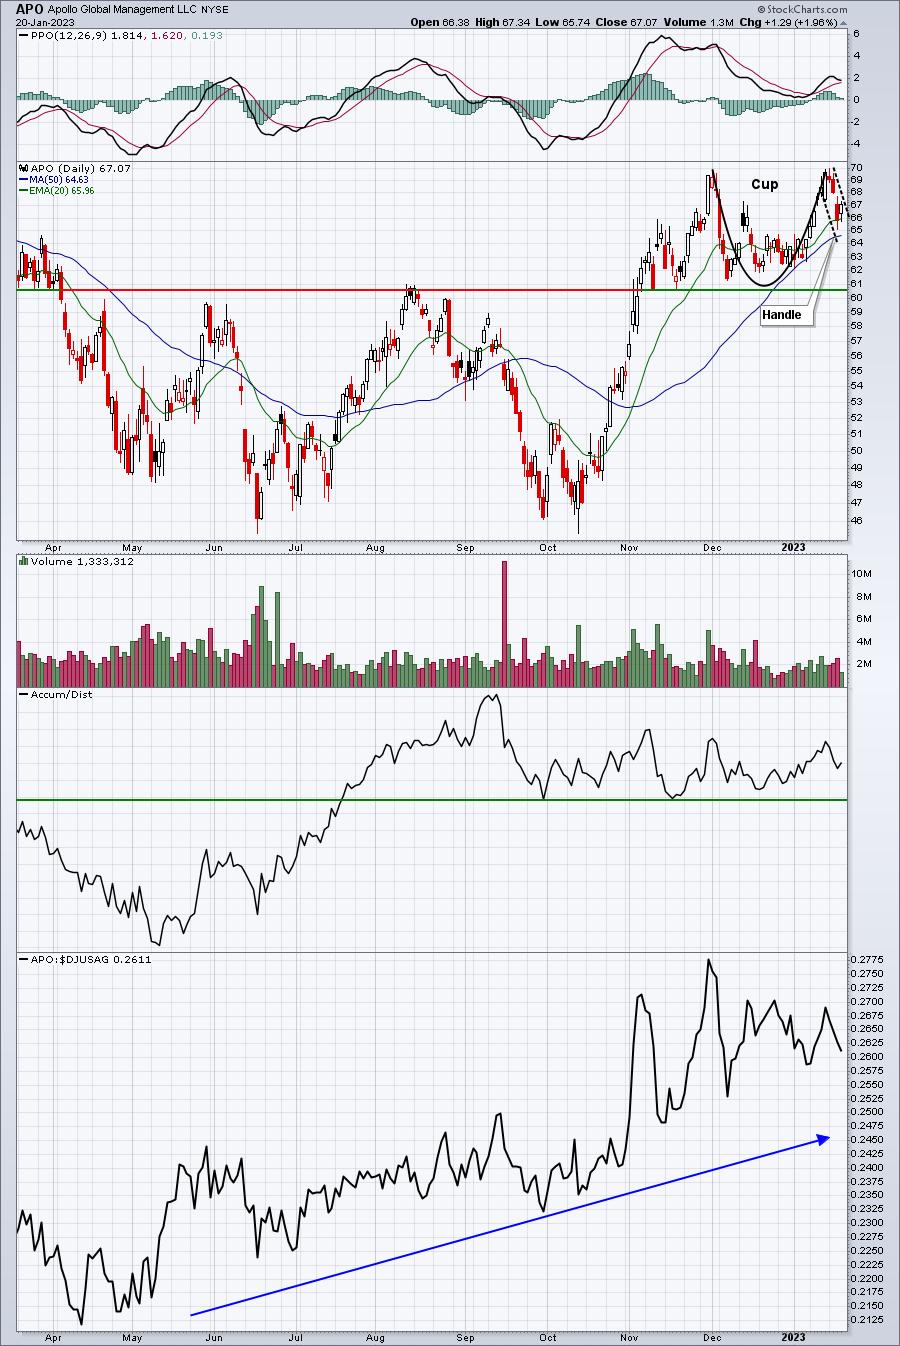
Bullish cup with handle pattern, with handle testing 20-day EMA. A leader amongst the asset managers ($DJUSAG).
The Week Ahead
Earnings will be a very important theme for the next several weeks and one thing to pay close attention to is the reaction to company's earnings reports that fall short of expectations. A perfect example last week was Netflix (NFLX), which came up well short of expectations, posting EPS of $.12 vs. a consensus estimate of $.47. Results were mixed, however, as NFLX beat revenues ($7.85 billion vs. $7.84 billion). But what really got the bulls going was its subscriber growth and outlook. Management had predicted 4.5 million new subscribers, but the actual number was a staggering 7.7 million new subscribers. Personally, I was convinced NFLX would report excellent results given their leadership position in the internet space ($DJUSNS). It's been uptrending vs. the DJUSNS for months. Clearly, Wall Street firms liked what they were hearing from NFLX management in recent weeks as the stock has been under accumulation.
Another example wasn't an earnings report, but rather the reaction to big layoffs. Wayfair (W) soared on Friday after announcing that it would lay off 10% of its work force. W also benefited from a short squeeze that will be interesting to watch next week as traders have shorted 35% of its float. The breakout on Friday on heavy volume could result in a sudden surge higher in the online retailer's share price:
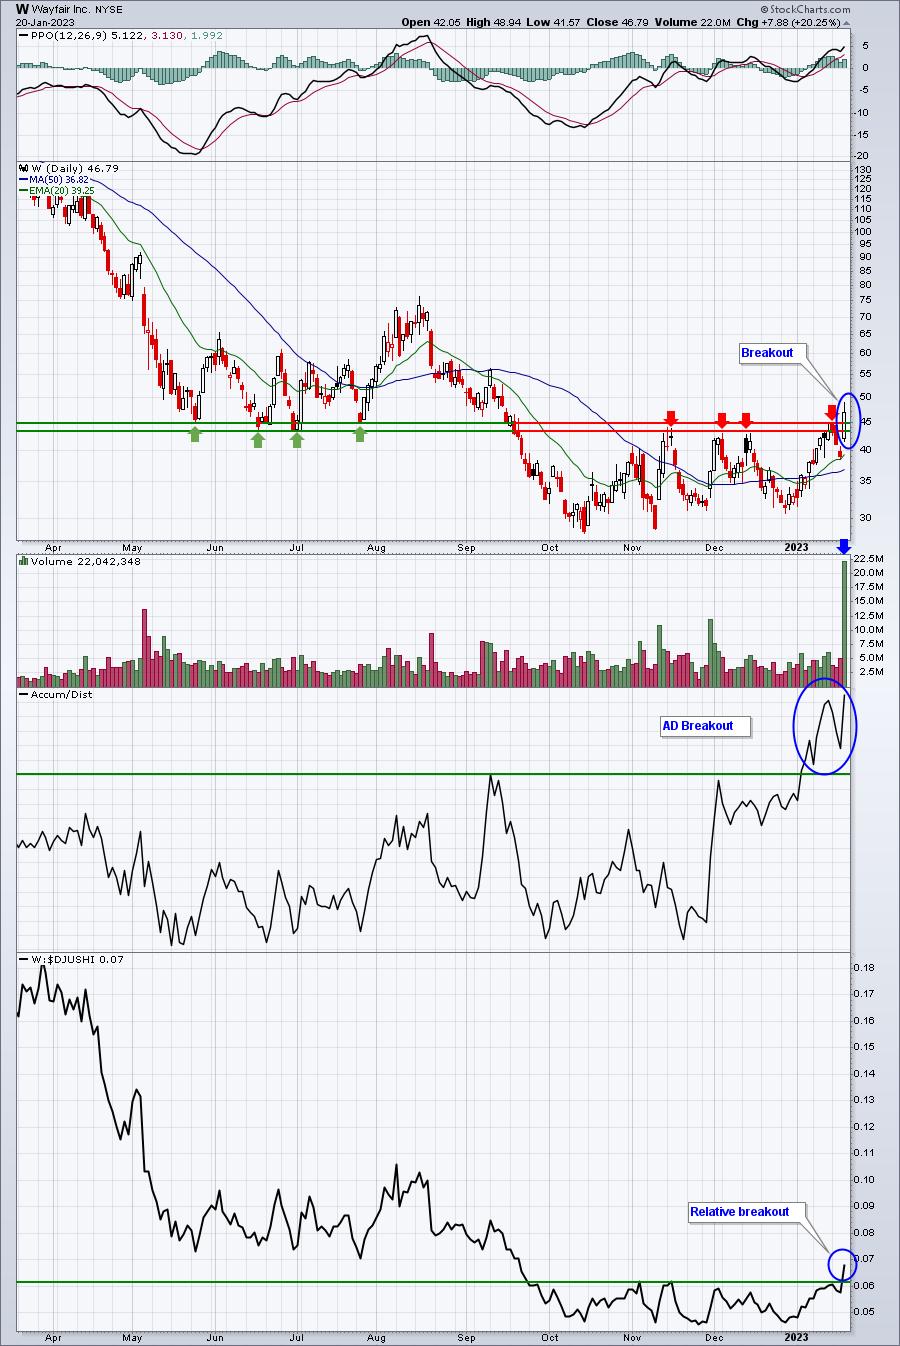
The volume suggests that short sellers were running for the exits on Friday. I would not be at all surprised to see that continue next week.
So as the volume of earnings reports soars, what will Wall Street's reaction be? We know that an unusually high number of earnings reports will likely disappoint, but will we continue to see "buying on the news" after we saw "selling on the rumors"? If NFLX and W are any indication, the next several weeks could prove to be very bullish, going against the grain in terms of common sense. Unfortunately, however, many investors and traders don't understand how the stock market works. Bad news is almost always priced in ahead of time. Keep in mind that Wall Street is looking at earnings 2 to 3 quarters out and, if they see future improvement, they'll use the release of bad news as an opportunity to buy cheap.
Happy trading!
Tom Bowley, Chief Market Strategist
EarningsBeats.com
"Better timing. Better trades."