
EB Weekly Portfolio Report - Sunday, February 19, 2023
Upcoming Earnings Reports
According to Zacks.com, the following companies will be reporting earnings this week and each is a component of one of our portfolios:
Monday, February 20: None - Market Closed
Tuesday, February 21: None
Wednesday, February 22: None
Thursday, February 23: None
Friday, February 24: None
PLEASE NOTE: The above companies were provided using Zacks.com. We do hold our portfolio stocks through one earnings report, but every EarningsBeats.com member must make his/her own investing/trading decisions about holding stocks into earnings reports as it's the most volatile (risky) time to own a stock.
Portfolio Rules and Objectives
Here are the common traits and objectives of our portfolios:
- There are 10 leading stocks from up to 10 leading industries in each portfolio (at the time of selection). Generally, there will only be one stock per industry group, but there could be exceptions.
- They are typically held for an entire 90-day period, with no stops in place. We strive for consistency, transparency, and simplicity in our portfolios. EB.com members may hold these stocks for the entire 90 days, trade them, use stops, etc., but for purposes of our calculation, we will likely make no exceptions to our "buy and hold for three months" strategy.
- Every stock will generally be held through ONE earnings report
- The expectation is that relative winners will carry the portfolio to outperformance
- All portfolio stocks were announced on Thursday, November 17th, and were all entered into as of the close on Friday, November 18th for tracking purposes
- Primary objective is to outperform the benchmark S&P 500 over time; quarter-to-quarter performance can be extremely volatile, especially if significant rotation takes place intra-quarter
Here are several considerations for EB members:
- The Income Portfolio should have the least amount of volatility as it will typically be comprised of quality large cap stocks with solid dividends
- The Model and Aggressive Portfolios should be viewed similar to aggressive growth funds; they will typically have a lot of volatility and periodic drawdowns can be significant from time to time
- The Income portfolio stocks will all pay dividends, with the expected average dividend yield to be at least 1.0%
- Drawdowns (losses) should be much milder on the Income portfolio, with more volatility expected on the other two; please review inception-to-date charts below to gain an idea of the volatility associated with each
- I believe the larger drawdown on the Income portfolio at the beginning of the pandemic was an anomaly, occurring as many defensive, higher-yielding companies uncharacteristically underperformed during a market decline.
- Large drawdowns in the February through May 2021 and the November 2021 to February 2022 periods were due to the rapid rotation from growth stocks to value stocks; each quarter, our portfolios are based on themes and there is never a guarantee that our analysis and beliefs will be proven correct
- Consider owning or trading these stocks in whatever manner is most comfortable for you; while we will buy all 10 stocks in the manner identified above, feel free to trade certain stocks or wait for pullbacks if the stocks are overbought
- We have no idea what risk each member is willing or able to take. We are not registered investment advisors so be sure you understand the risk you take. Please consult your financial advisor.
- EarningsBeats.com shareholders/employees may own all or some of the portfolio stocks from time to time.
Weekly Snapshot
Here's a weekly recap:
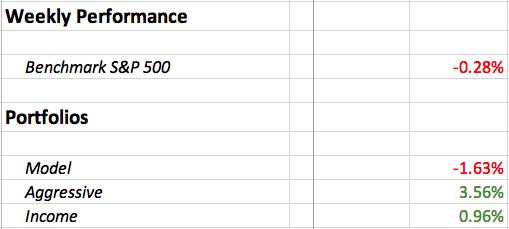
Weekly Summary
Benchmark S&P 500:
There were certainly elements of "Opposite George" week last week. The weakest sectors (ie, the defensive sectors) were among the weekly leaders. Consumer discretionary (XLY, +1.63%) led the action, but utilities (XLU, +1.14%) and consumer staples (XLP, +0.97%) were in the #2 and #3 spots. Technology (XLK, -0.40%), which had been on a roll since the early part of 2023, was unable to keep pace. The big loser, however, was energy (XLE, -6.34%). Not only did it have a horrific week, it also lost ascending triangle support:
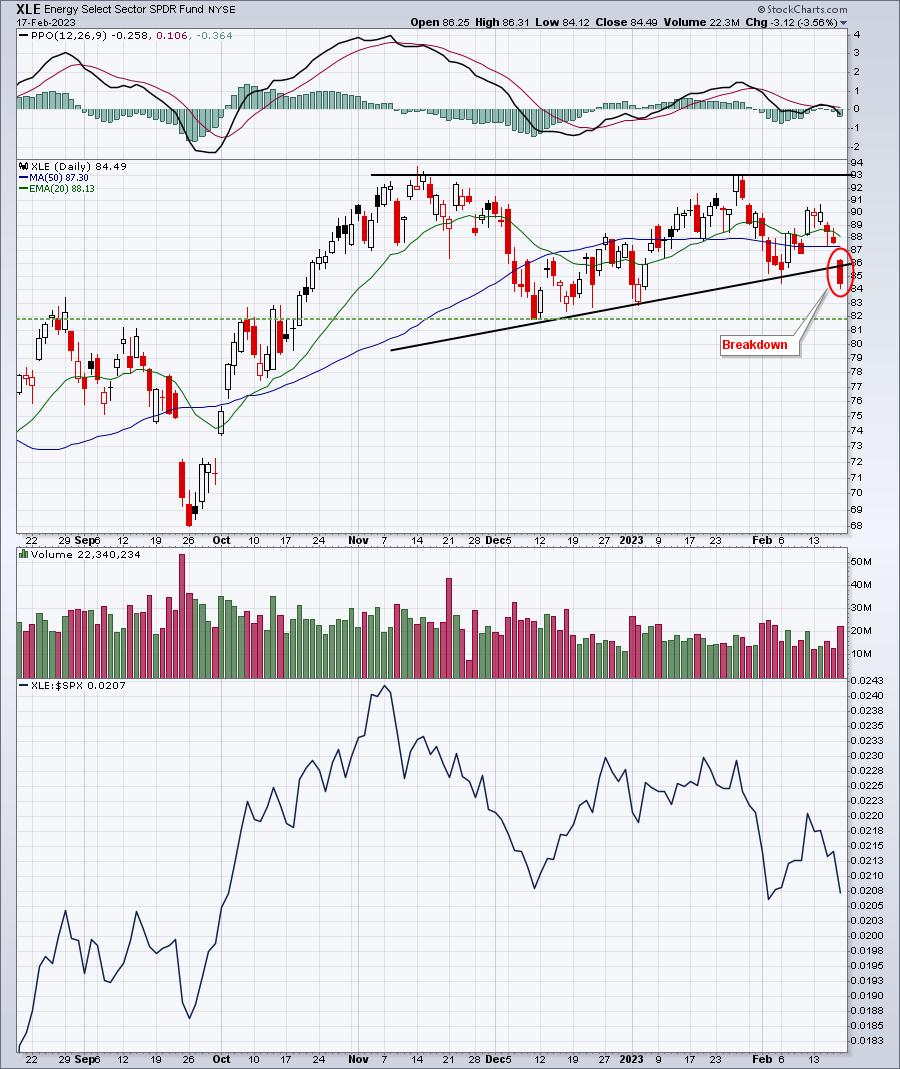
Next support on the XLE is December price support just below 82.
Model Portfolio:
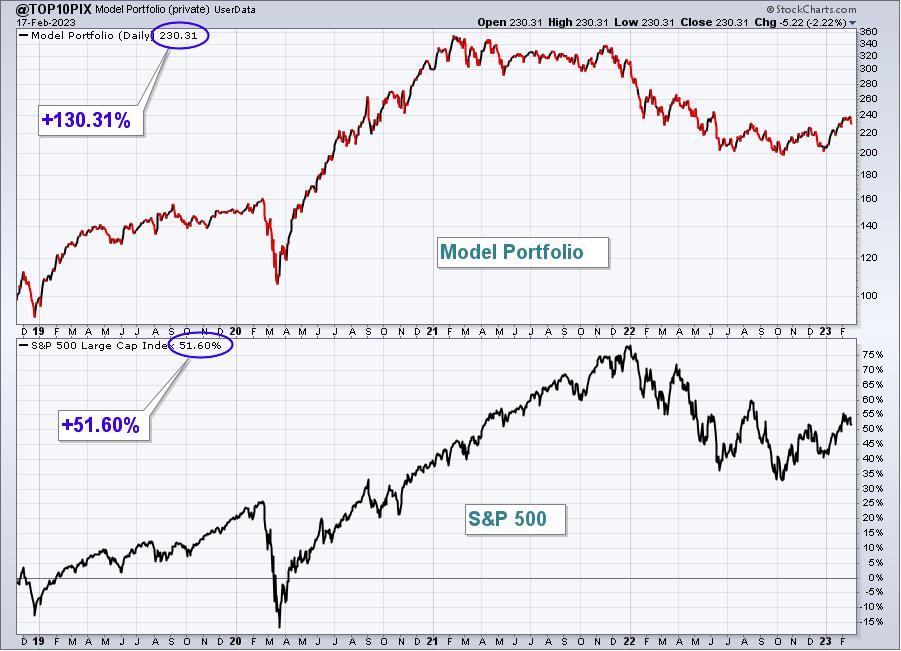
The Model Portfolio lost 1.63% last week, underperforming the S&P 500. Here's the updated inception-to-date chart of the portfolio:
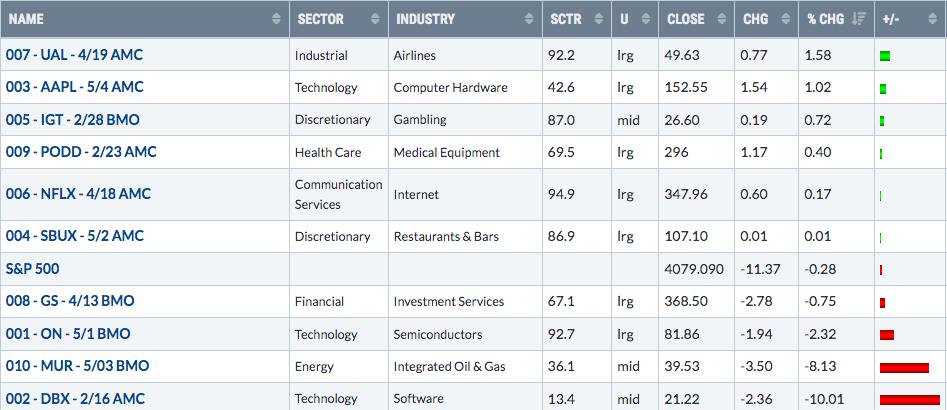
Here are how the Model Portfolio component stocks performed last week:
Aggressive Portfolio:
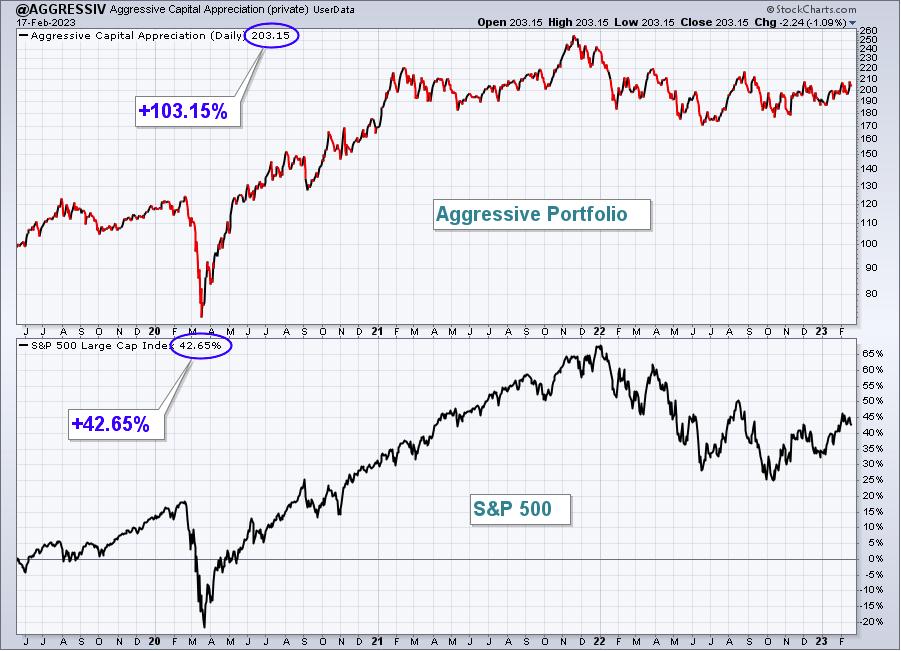
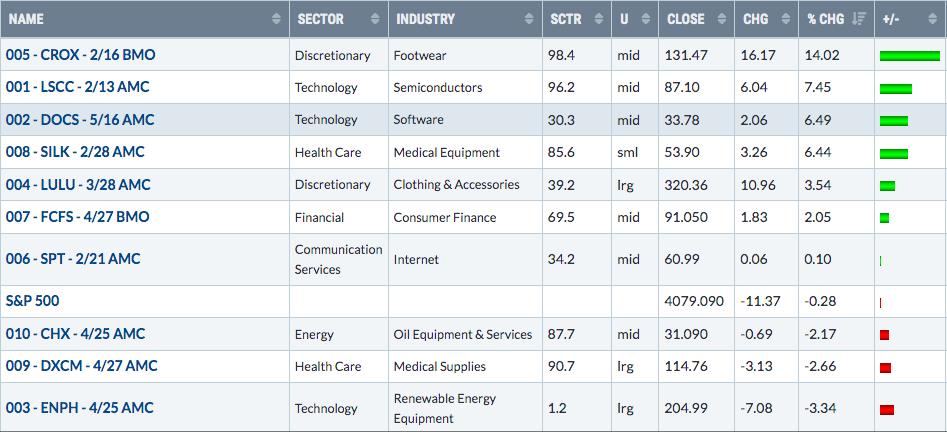
The Aggressive Portfolio jumped 3.56% last week, significantly outperforming the S&P 500. Here's the updated inception-to-date chart of the portfolio:
Here are how the Aggressive Portfolio component stocks performed last week:
Income Portfolio:
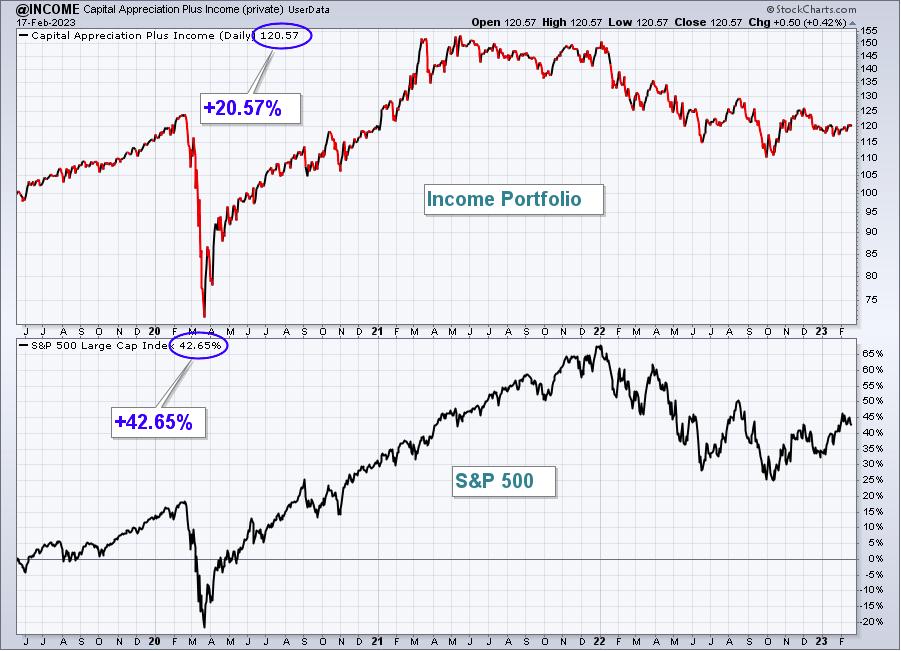
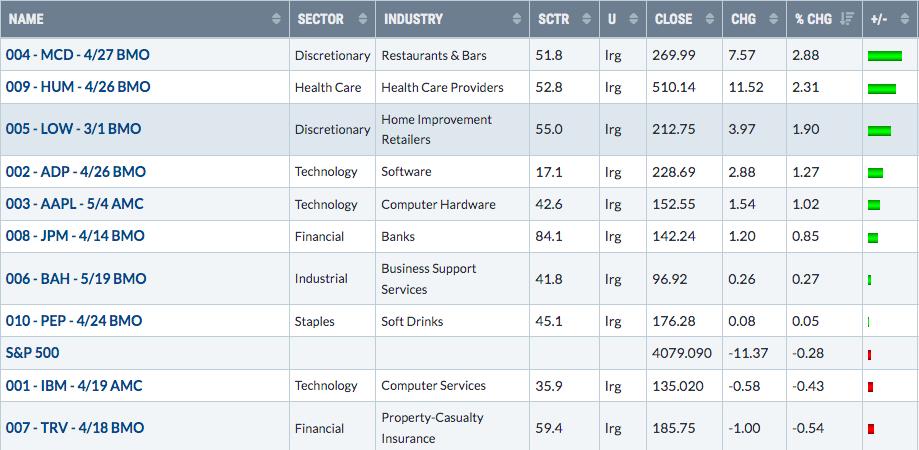
The Income Portfolio rose 0.96% last week, outperforming the S&P 500.
Here's the updated inception-to-date chart of the portfolio:
Here are how the Income Portfolio component stocks performed last week:
Model ETF Portfolio
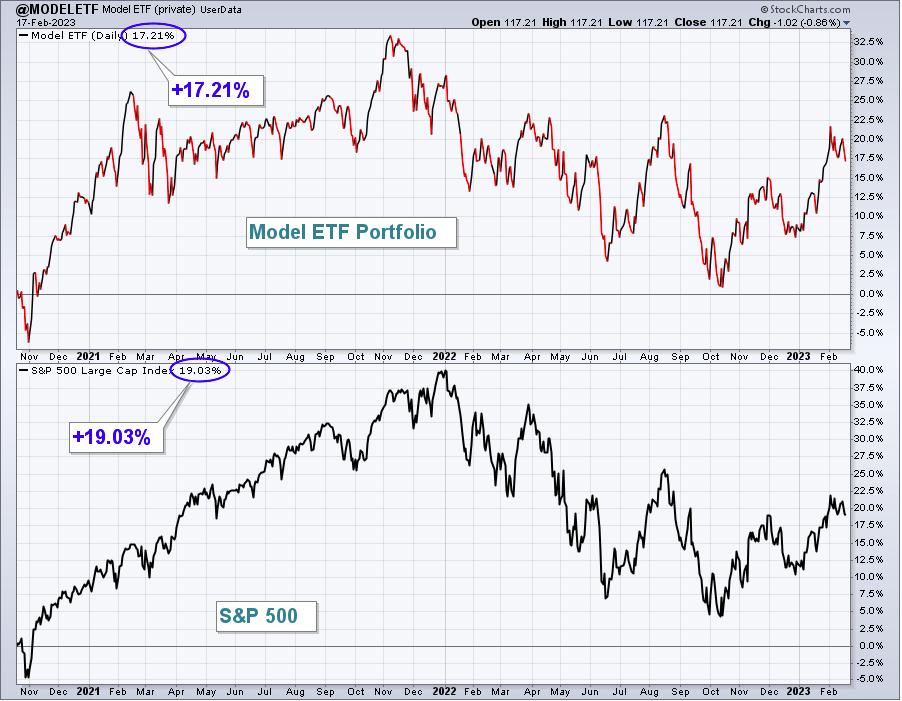
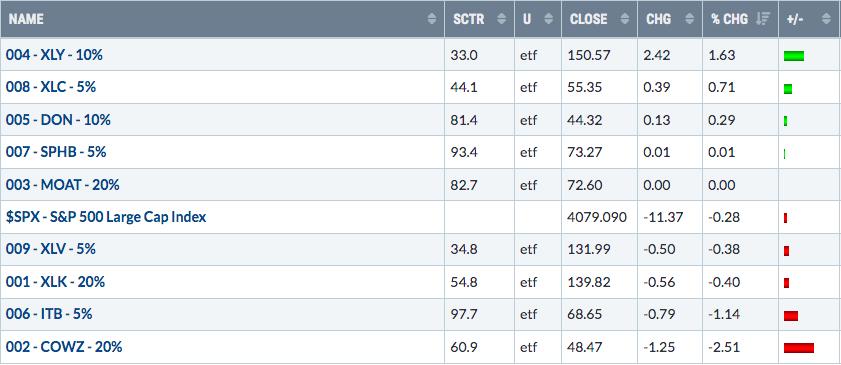
Our Model ETF Portfolio lost 0.41% last week, slightly underperforming the S&P 500.
Here's the updated inception-to-date chart of the Model ETF Portfolio:
Here are how the Model ETF Portfolio components performed last week:
Model Trade Setups
I will provide Model Trade Setups each week in this Weekly Portfolio Report, which will simply be to outline possible trades based on key support, resistance, relative strength, and where these trades come from. For instance, my trading strategy for Strong AD ChartList (SADCL) stocks might be completely different than my trading strategy on Strong Earnings ChartList (SECL) stocks. Obviously, it would be different from a Short Squeeze ChartList (SSCL) trading candidate. I'll lay out the annotated chart and my reasoning for the (potential) trade. I may provide follow-up on some or all of these setups in the Daily Market Report (DMR). I'll also provide full disclosure, if I own any of the setups provided. Feel free to trade these Model Trade Setups based on the annotated charts provided, or according to your own trading strategy. Or ignore them. It's completely up to you. I am not a Registered Investment Advisor (nor is EarningsBeats.com). THESE TRADING CANDIDATES SHOULD NOT BE VIEWED AS INVESTMENT ADVICE.
I view EarningsBeats.com as a market research, market guidance, and market education platform. We do not attempt, in any fashion, to manage anyone's money. We have no idea the risk tolerance of each of our members, nor do we have any idea of your financial goals and objectives. It would be irresponsible for us to provide advice to any of our members. Therefore, please consult your own financial advisor before considering any buy/sell decisions. You are completely responsible for the financial decisions that you make.
Last Week's Setups
Here were the setups provided last week and how they performed:
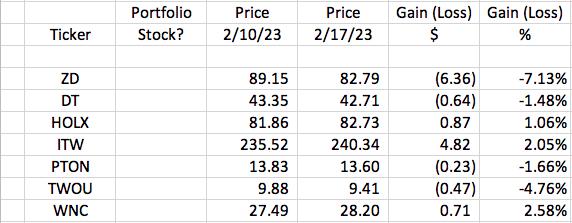
We ended the week with 3 winners and 4 losers, but the week felt much better than our final results. It seemed as though all of our setups took a major turn for the worse on Thursday and Friday after starting the week mostly on fire. DT, PTON, and TWOU all had very solid gains earlier in the week, before succumbing to the selling pressure that was likely due to options expiration. Overall, it wasn't a horrible week, but it just didn't end well.
On to the next week....
This Week's Setups
Every week, I will provide setups among our Portfolio stocks and our ChartList stocks. My preference is to trade Portfolio stocks, when appropriate. These stocks are in our portfolios for a reason - they're generally leaders within leading or improving industries.
The upcoming week could set the tone for the next 4-6 weeks. Do we continue this uptrend or might we see a period of selling and consolidation before another leg higher? The XLK, XLY, and XLC all tested their rising 20-day EMAs last week and finished close to that key moving average on Friday. The bullish case would be a big bounce this week off of this test. We'll base our weekly setups off of the current technical evidence and live with the results. But we'll also keep the number of setups a bit light.
Here are this week's Model Trade Setups:
All Stocks From Strong Earnings ChartList (SECL):
PDD:
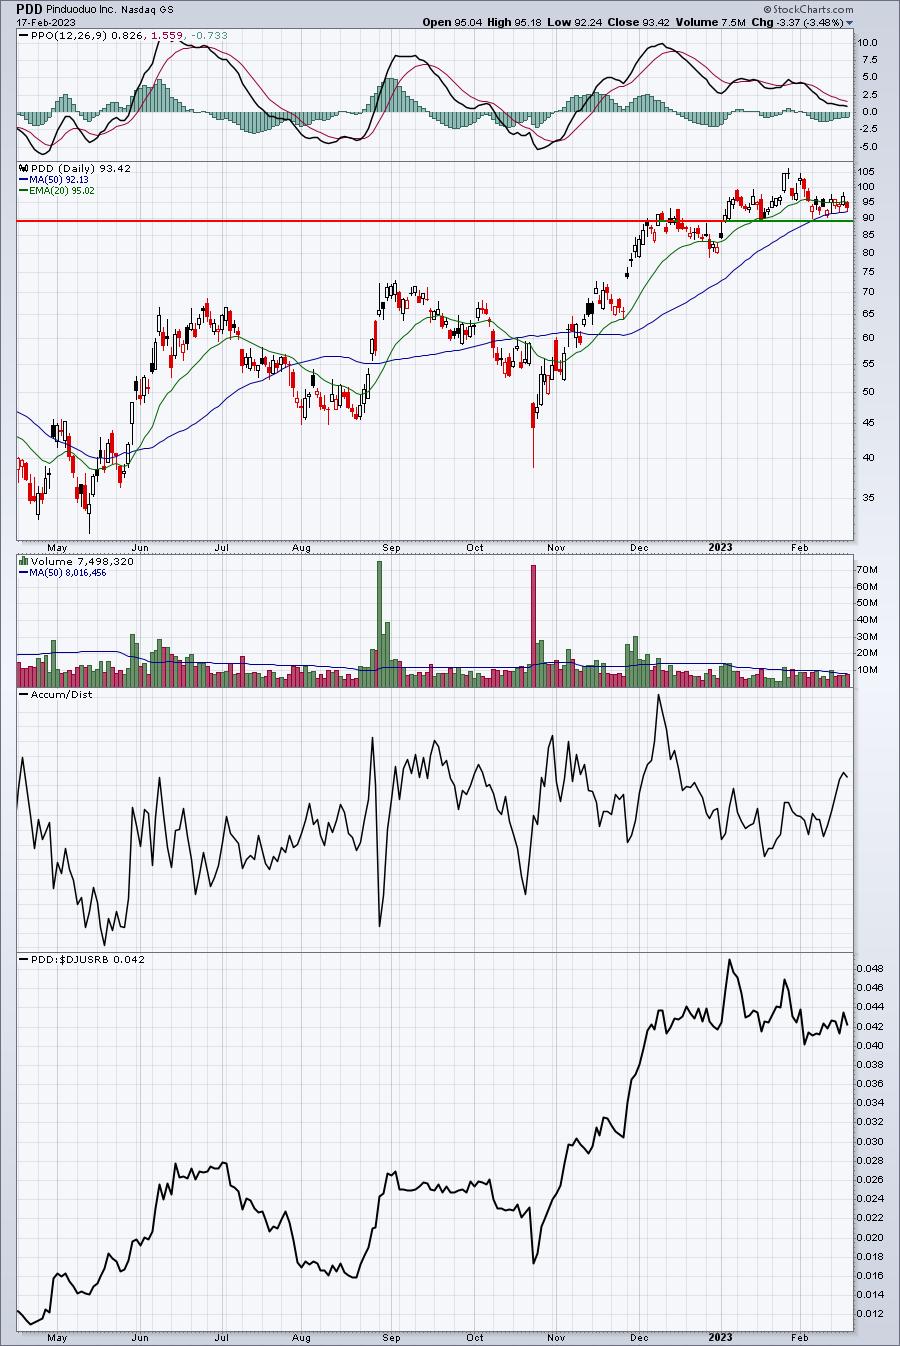
50-day SMA test. PDD has been one of the best market performers over last several months. Price support is closer to 89, if the 50-day SMA doesn't hold. I'd target a return trip to 105.
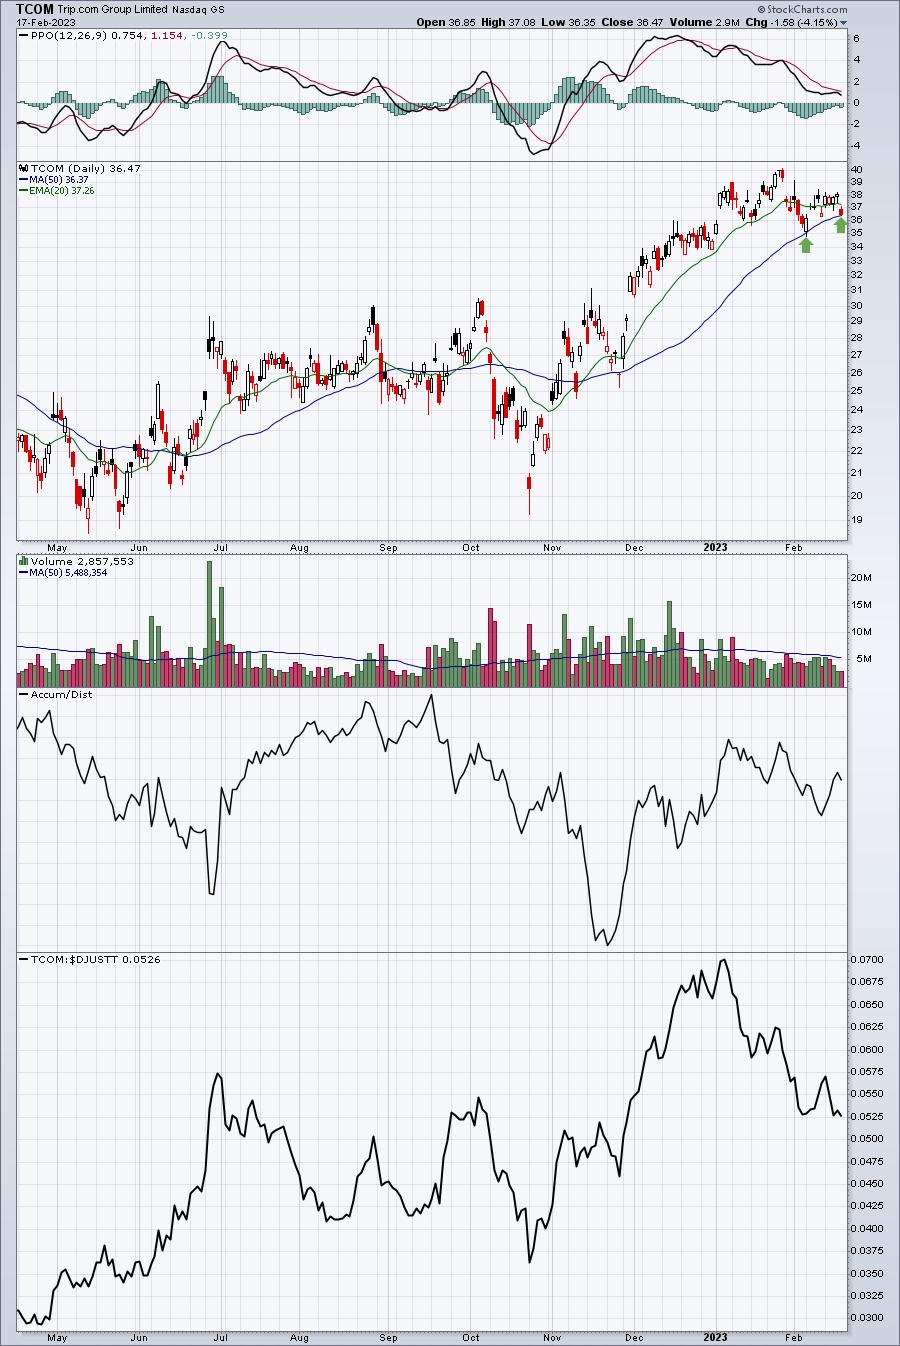
TCOM:
DHI:
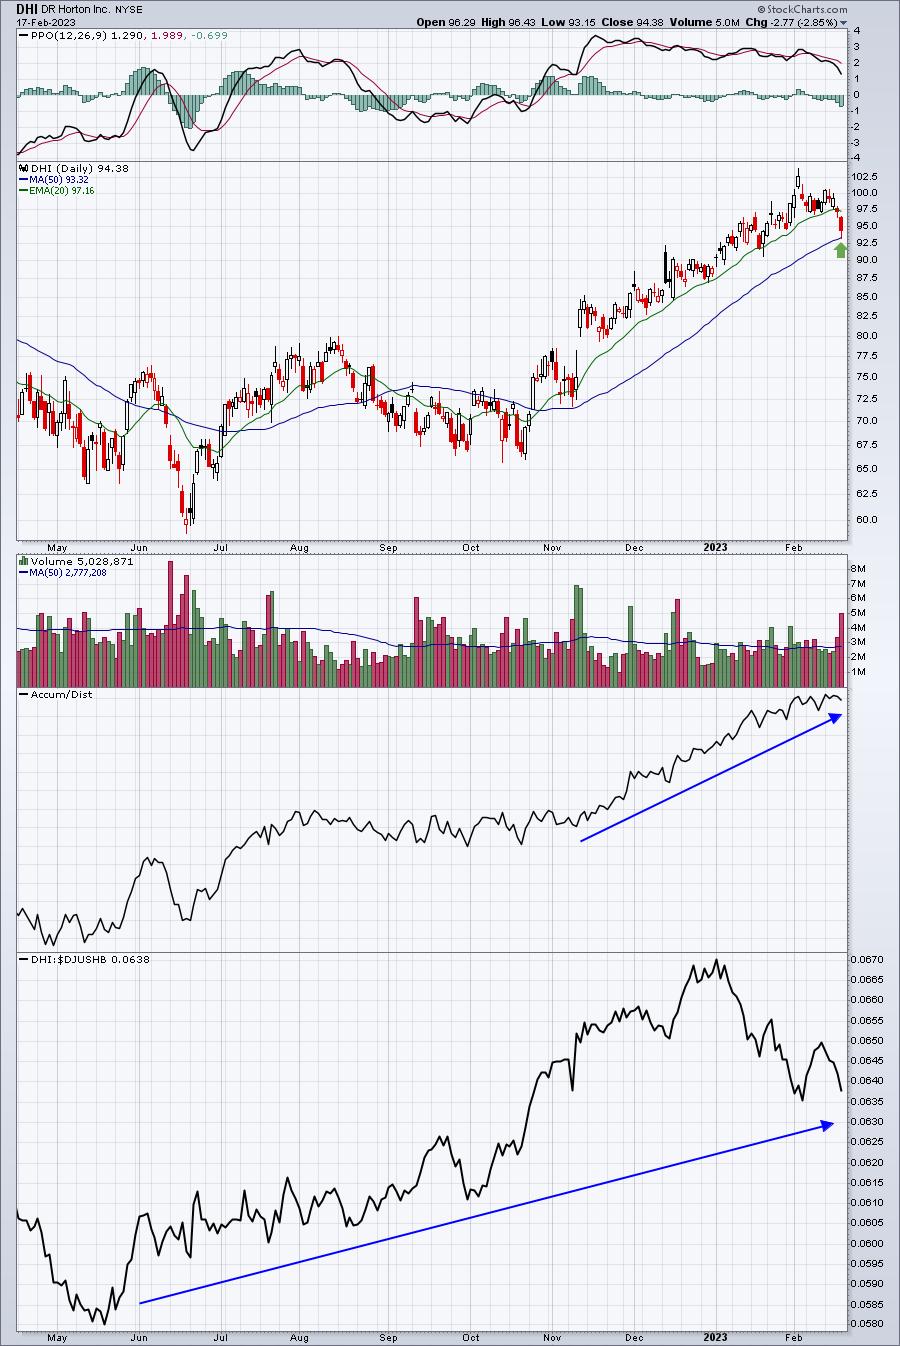
First 50-day SMA test since the big rally began. The 10-year treasury yield ($TNX) hit key yield resistance on Friday. If the TNX pulls back, even temporarily, it could result in a nice rebound for DHI and other homebuilders.
The Week Ahead
We will have bearish historical forces battling bullish technical forces as we open up a holiday-shortened week on Tuesday. It's not necessarily a bearish historical period ahead. It's just not it's not nearly as bullish. Q1 (Jan 1-Mar 31) can be broken down by halves and the disparity of historical performance is somewhat alarming. Check out the S&P 500 annualized performance by half since 1950:
- January 1 - February 15: +11.51%
- February 16 - March 31: +5.41%
Performance in the first half of Q1 more than doubles the performance of the second half. But it gets worse. There are two bullish periods in the second half of Q1. The March 1-5 period historically yields annualized performance of +39.41% and the March 11-18 period historically produces annualized returns of +33.25%. The rest of the second half of Q1 (Feb 16-29, Mar 6-10, and Mar 19-31) has an annualized return of -9.30%. So we generally see some bullishness with money inflows around the beginning and middle of March. Other than that, we tend to see selling.
Technically, however, we saw nice rebounds on the S&P 500 ($SPX) and NASDAQ 100 ($NDX) as both major indices tested their rising 20-day EMAs. Here's the NDX chart:
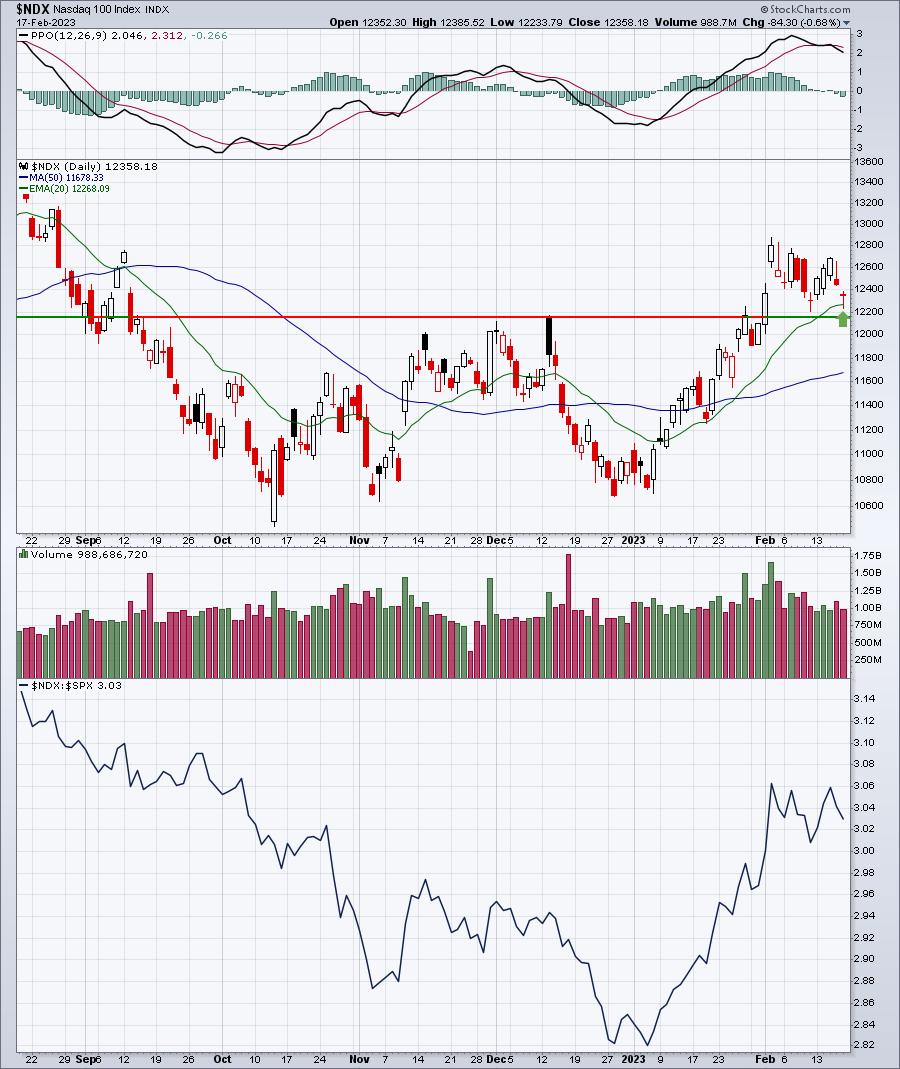
So what's likely to happen? Do we bounce at a key technical level or do the historical tendencies add to the recent bout of profit taking? Great questions. I wish I knew for certain. What I do believe is that we're going to be a lot higher at the end of the year than we are now. Do we chop in the first quarter and potentially scare retail traders one more time? I wouldn't rule it out. At MarketVision 2023, I provided a chart of how I thought price action might unfold in 2023. At the time, I believed we'd see a strong January and then struggle until Q2 began. Then we'd soar in April as earnings season approached. That's typical stock market behavior. This is how I thought it might look:
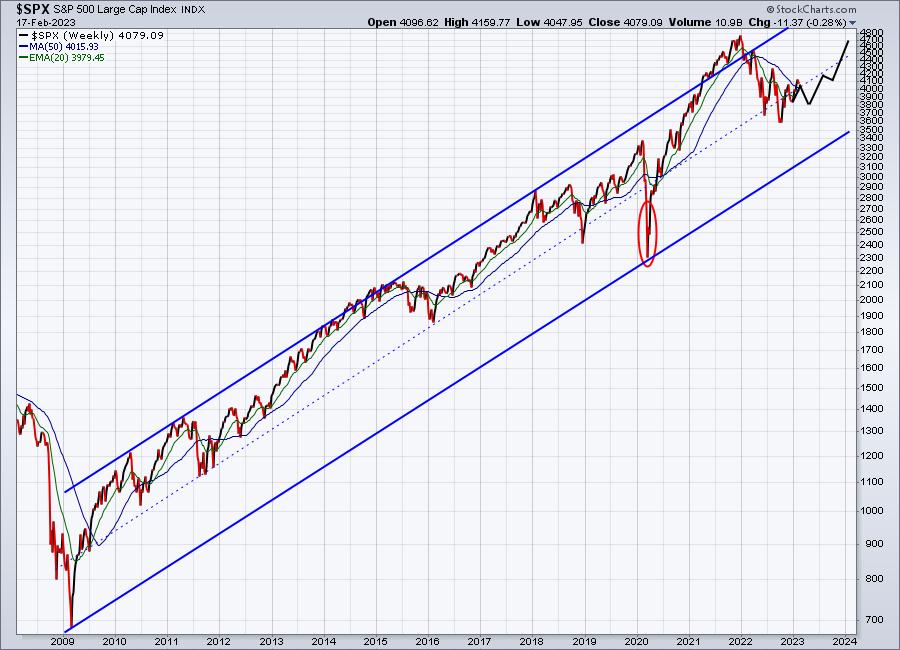
This is just my best guess based on my signals, which are bullish, and seasonal patterns that suggest the next several weeks could leave us a bit vulnerable.
Happy trading!
Tom Bowley, Chief Market Strategist
EarningsBeats.com
"Better timing. Better trades."