
EB Weekly Portfolio Report - Monday, July 3, 2023
Upcoming Earnings Reports
According to Zacks.com, the following companies will be reporting earnings this week and each is a component of one of our portfolios:
Monday, July 3: None
Tuesday, July 4: None - Market Closed
Wednesday, July 5: None
Thursday, July 6: None
Friday, July 7: None
PLEASE NOTE: The above companies were provided using Zacks.com. We do hold our portfolio stocks through one earnings report, but every EarningsBeats.com member must make his/her own investing/trading decisions about holding stocks into earnings reports as it's the most volatile (risky) time to own a stock.
Portfolio Rules and Objectives
Here are the common traits and objectives of our portfolios:
- There are 10 leading stocks from up to 10 leading industries in each portfolio (at the time of selection). Generally, there will only be one stock per industry group, but there could be exceptions.
- They are typically held for an entire 90-day period, with no stops in place. We strive for consistency, transparency, and simplicity in our portfolios. EB.com members may hold these stocks for the entire 90 days, trade them, use stops, etc., but for purposes of our calculation, we will likely make no exceptions to our "buy and hold for three months" strategy.
- Every stock will generally be held through ONE earnings report
- The expectation is that relative winners will carry the portfolio to outperformance
- All portfolio stocks were announced on Thursday, May 18th, and were all entered into as of the close on Friday, May 19th for tracking purposes
- Primary objective is to outperform the benchmark S&P 500 over time; quarter-to-quarter performance can be extremely volatile, especially if significant rotation takes place intra-quarter
Here are several considerations for EB members:
- The Income Portfolio should have the least amount of volatility as it will typically be comprised of quality large cap stocks with solid dividends
- The Model and Aggressive Portfolios should be viewed similar to aggressive growth funds; they will typically have a lot of volatility and periodic drawdowns can be significant from time to time
- The Income portfolio stocks will all pay dividends, with the expected average dividend yield to be at least 1.0%
- Drawdowns (losses) should be much milder on the Income portfolio, with more volatility expected on the other two; please review inception-to-date charts below to gain an idea of the volatility associated with each
- I believe the larger drawdown on the Income portfolio at the beginning of the pandemic was an anomaly, occurring as many defensive, higher-yielding companies uncharacteristically underperformed during a market decline.
- Large drawdowns in the February through May 2021 and the November 2021 to February 2022 periods were due to the rapid rotation from growth stocks to value stocks; each quarter, our portfolios are based on themes and there is never a guarantee that our analysis and beliefs will be proven correct
- Consider owning or trading these stocks in whatever manner is most comfortable for you; while we will buy all 10 stocks in the manner identified above, feel free to trade certain stocks or wait for pullbacks if the stocks are overbought
- We have no idea what risk each member is willing or able to take. We are not registered investment advisors so be sure you understand the risk you take. Please consult your financial advisor.
- EarningsBeats.com shareholders/employees may own all or some of the portfolio stocks from time to time.
Weekly Snapshot
Here's a weekly recap:
- S&P 500: +2.35%
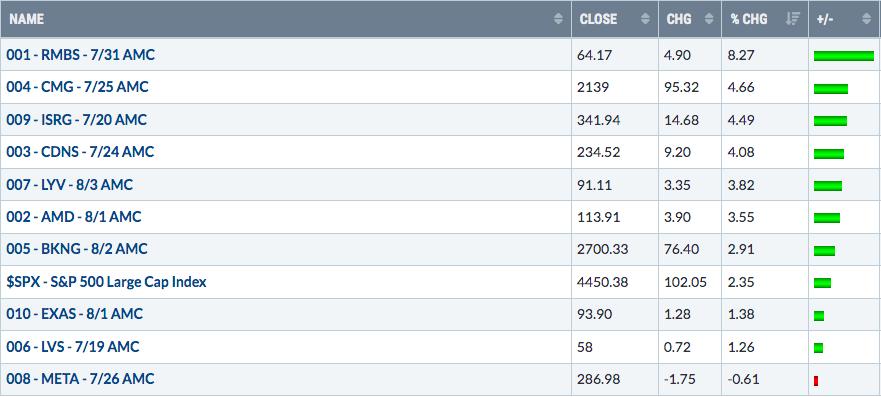
- Model Portfolio: +3.31%
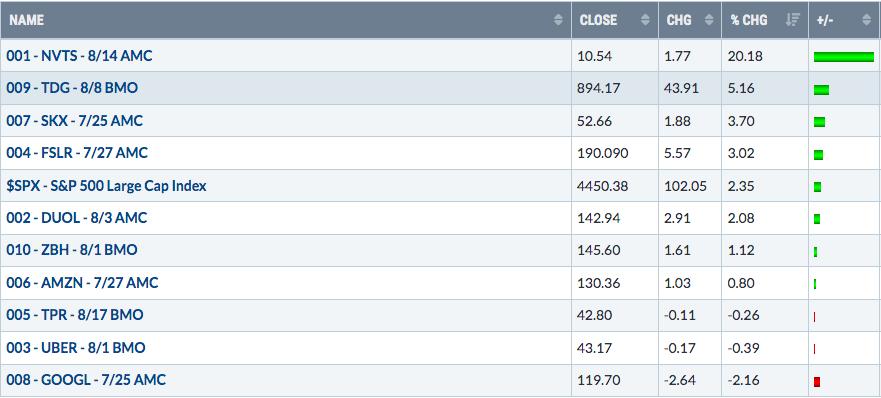
- Aggressive Portfolio: +3.32%
- Income Portfolio: +4.35%
- Model ETF Portfolio: +2.21%
Weekly Summary
Benchmark S&P 500:
The S&P 500 ($SPX, +2.35%) had another very solid week, closing on Friday at a 52-week high and its highest level since April 20, 2022. Leadership came from many areas, but the best-performing sector was actually real estate (XLRE, +5.10%). All 11 sectors finished the weak higher, which is bullish as the wealth gets spread in sectors other than the high-flying technology (XLK, +3.09%) and consumer discretionary (XLY, +2.64%) sectors.
Transportation stocks ($TRAN, +5.73%) had an outstanding week, led by the red-hot airlines ($DJUSAR, +9.63%). Speaking of red-hot, recreational services ($DJUSRQ, +9.22%) added to its impressive 2023 advance as Carnival Corp (CCL, +19.18%) exploded to the upside.
Biotechnology ($DJUSBT, -0.56%) was one of the few industry groups that ended in negative territory, but its favorite month of the year historically - July - is now upon us. After a nice rally in October/November 2022, biotechs have been mostly under significant selling pressure since. Perhaps July will kickstart the group.
Model Portfolio:
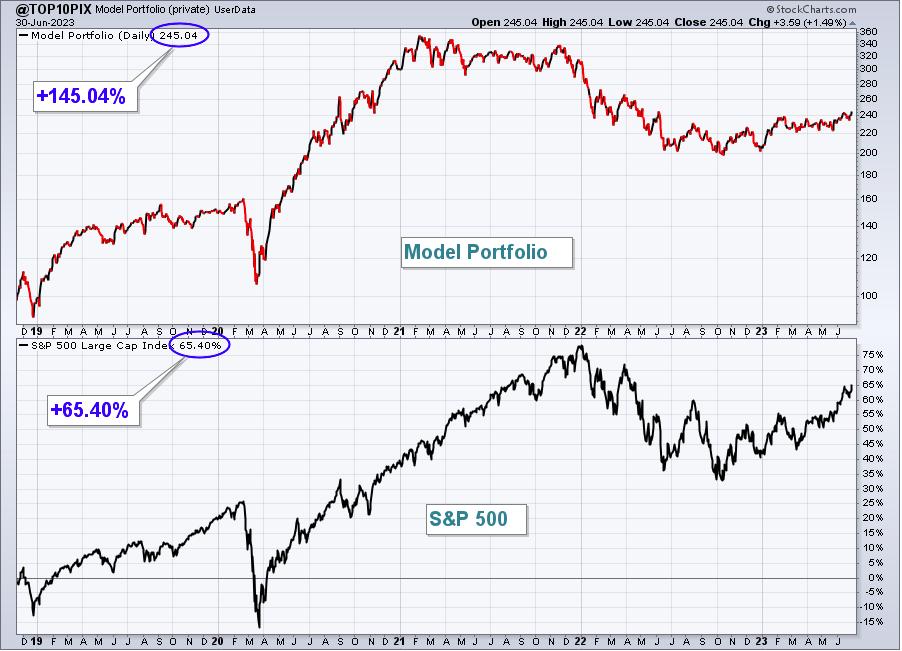
The Model Portfolio rose 3.31% last week, outperforming the S&P 500. Here's the updated inception-to-date chart of the portfolio:
Here are how the Model Portfolio component stocks performed last week:
Aggressive Portfolio:
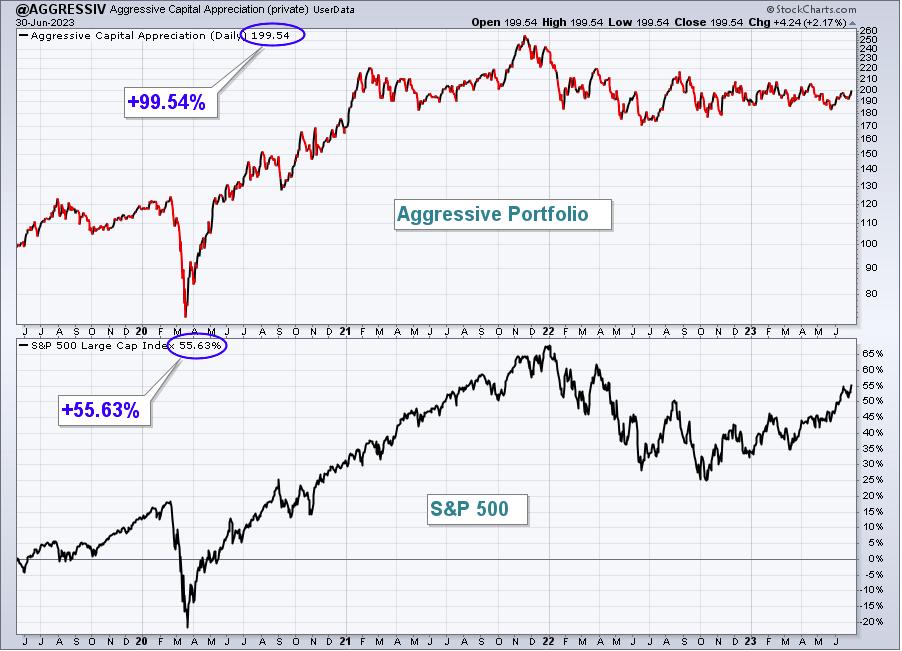
The Aggressive Portfolio jumped 3.32% last week, outperforming the S&P 500. Here's the updated inception-to-date chart of the portfolio:
Here are how the Aggressive Portfolio component stocks performed last week:
Income Portfolio:
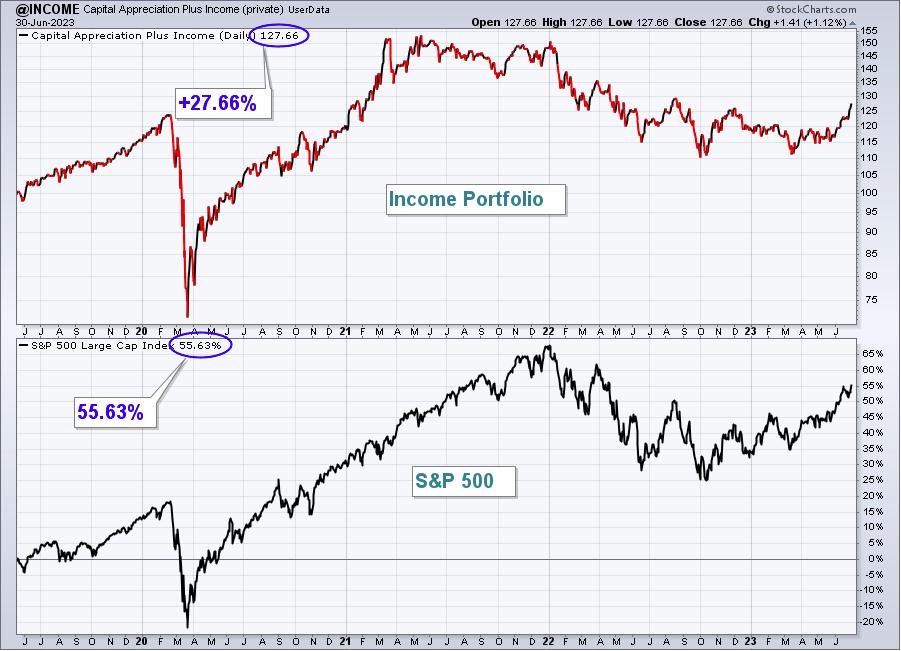
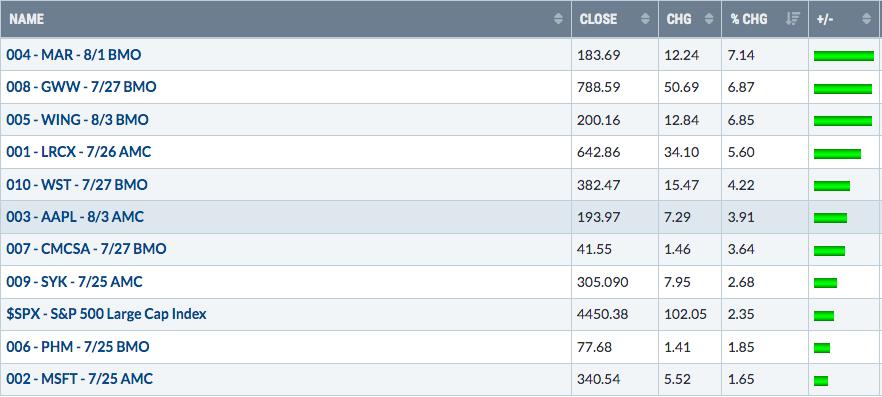
The Income Portfolio surged 4.35% last week, easily outperforming the S&P 500.
Here's the updated inception-to-date chart of the portfolio:
Here are how the Income Portfolio component stocks performed last week:
Model ETF Portfolio
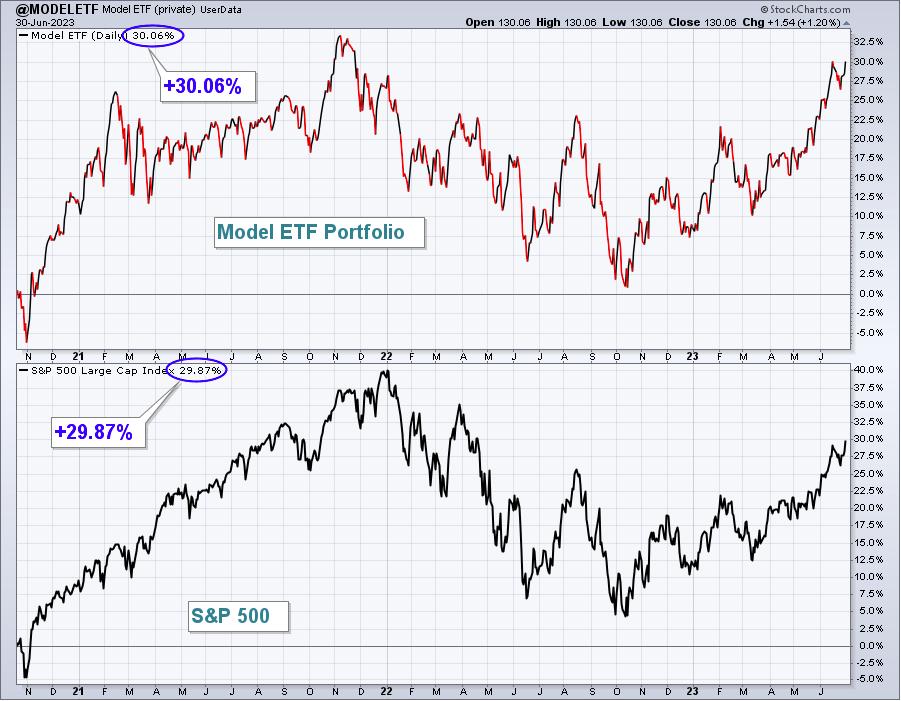
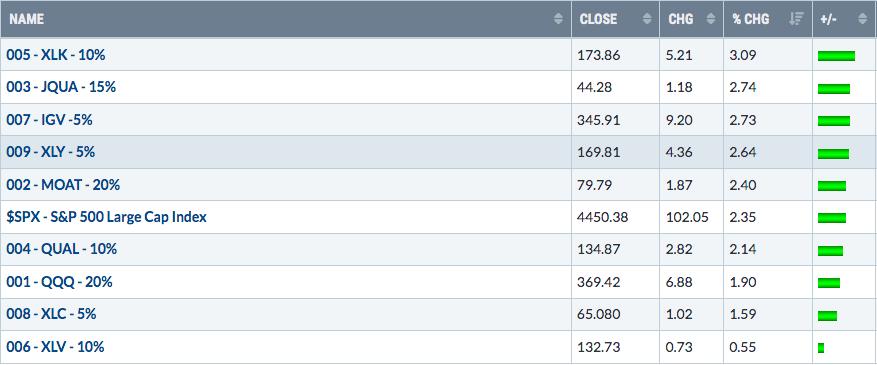
Our Model ETF Portfolio gained 2.21% last week, slightly underperforming the S&P 500.
Here's the updated inception-to-date chart of the Model ETF Portfolio:
Here are how the Model ETF Portfolio components performed last week:
Model Trade Setups
I will provide Model Trade Setups each week in this Weekly Portfolio Report, which will simply be to outline possible trades based on key support, resistance, relative strength, and where these trades come from. For instance, my trading strategy for Strong AD ChartList (SADCL) stocks might be completely different than my trading strategy on Strong Earnings ChartList (SECL) stocks. Obviously, it would be different from a Short Squeeze ChartList (SSCL) trading candidate. I'll lay out the annotated chart and my reasoning for the (potential) trade. I may provide follow-up on some or all of these setups in the Daily Market Report (DMR). I'll also provide full disclosure, if I own any of the setups provided. Feel free to trade these Model Trade Setups based on the annotated charts provided, or according to your own trading strategy. Or ignore them. It's completely up to you. I am not a Registered Investment Advisor (nor is EarningsBeats.com). THESE TRADING CANDIDATES SHOULD NOT BE VIEWED AS INVESTMENT ADVICE.
I view EarningsBeats.com as a market research, market guidance, and market education platform. We do not attempt, in any fashion, to manage anyone's money. We have no idea the risk tolerance of each of our members, nor do we have any idea of your financial goals and objectives. It would be irresponsible for us to provide advice to any of our members. Therefore, please consult your own financial advisor before considering any buy/sell decisions. You are completely responsible for the financial decisions that you make.
Last Week's Setups
There was no EB Weekly Portfolio Report last week as I was at a family reunion and wasn't able to publish it. We did have setups from two weeks ago, so let's check those out:
WSM:
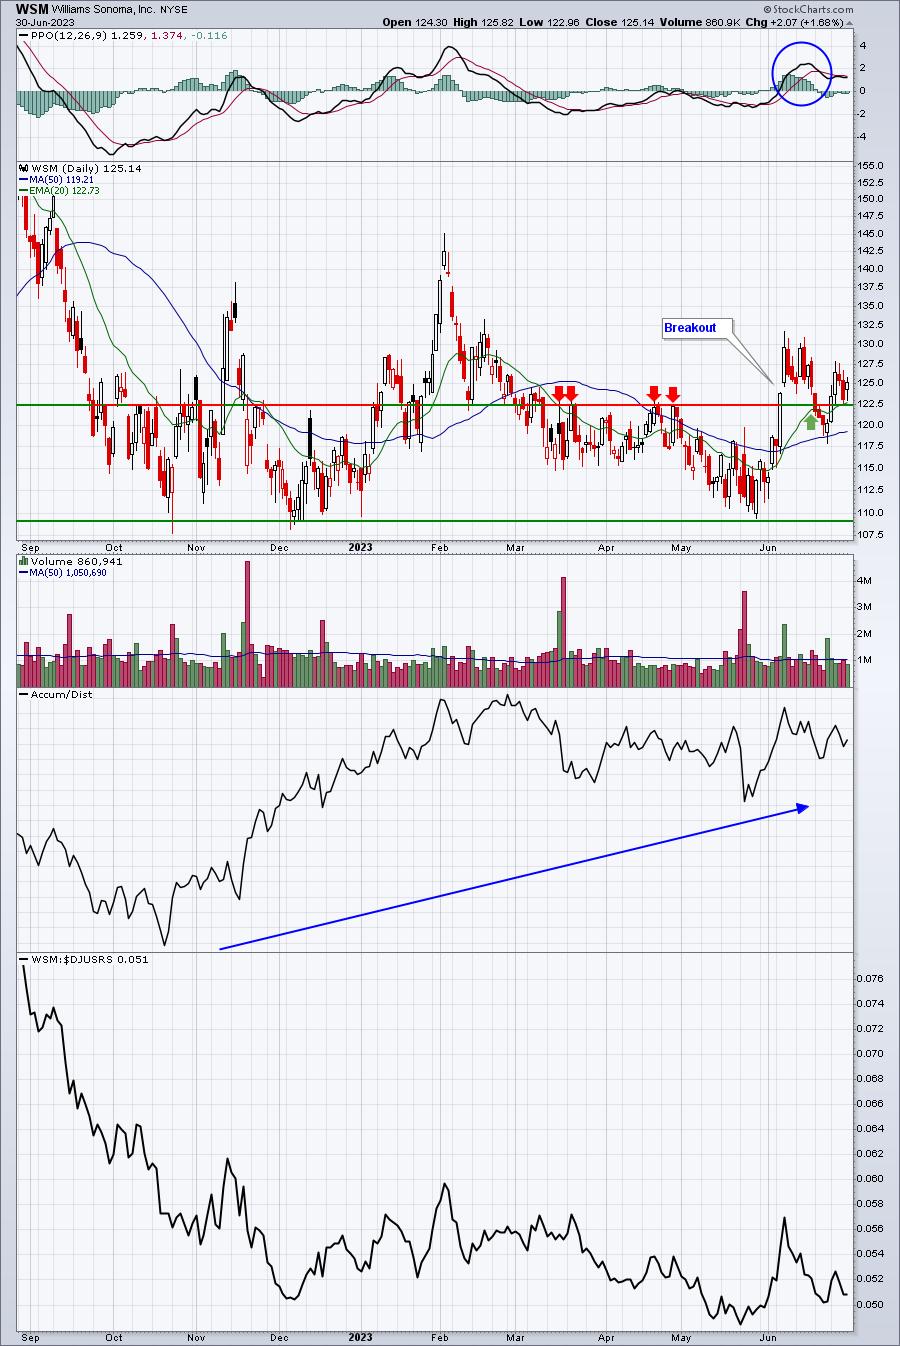
WSM did move beneath the rising 20-day EMA temporarily as it fell to test its 50-day SMA. It's since recovered and remains in relatively the same position it was in two weeks ago. Relative strength is weak and that's probably my biggest concern right now. If that bottom panel turns up and can clear the early-June relative high, the prospects for WSM turn much more bullish, in my opinion.
HAE:
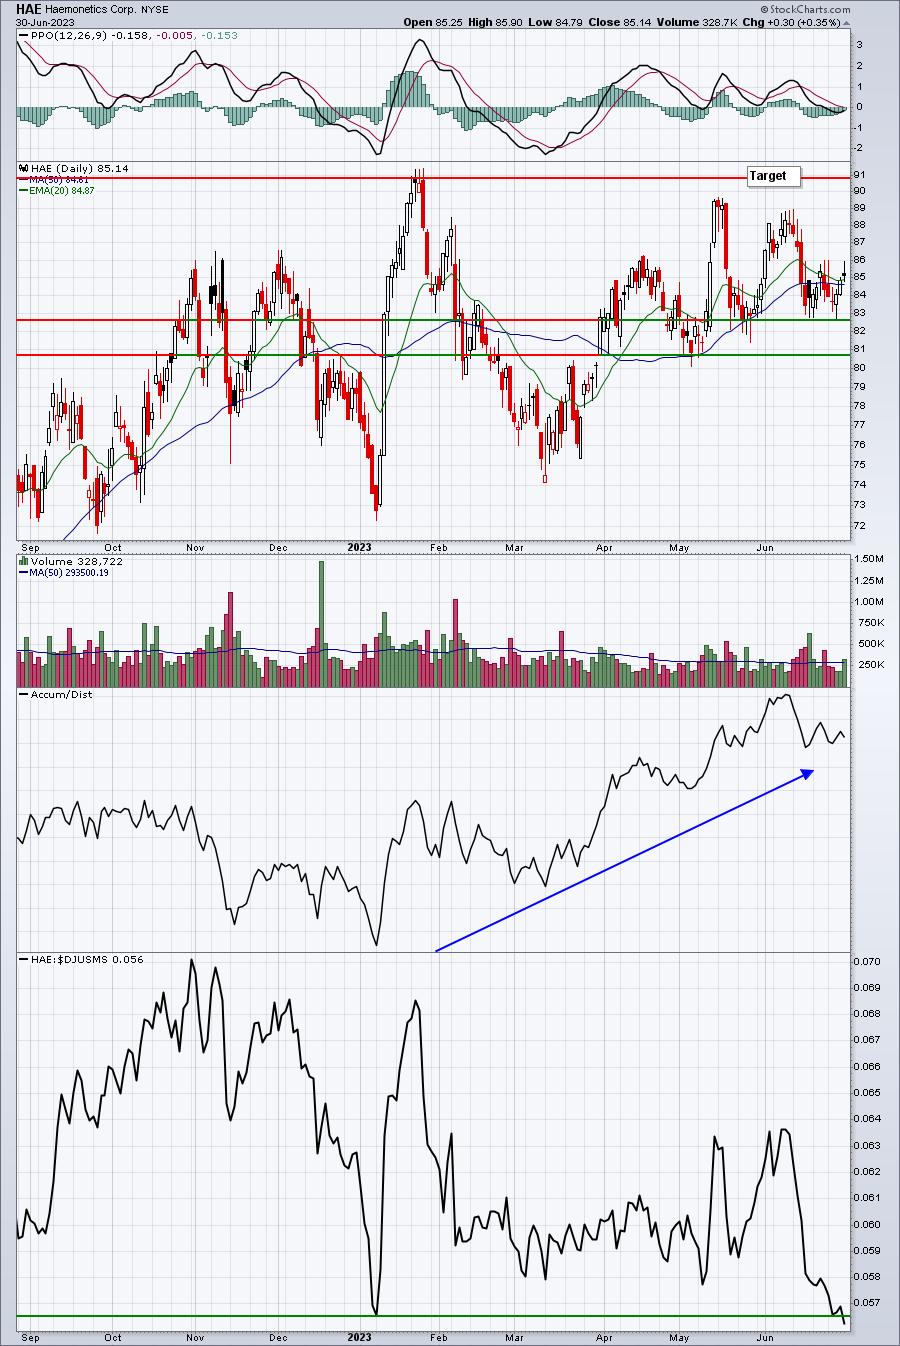
The lack of relative strength is clearly a problem here. But its industry group, medical equipment ($DJUSAM), has improved significantly and key support on HAE has not been lost. Ultimately, HAE needs a breakout above 91 and its relative strength needs to turn higher.
PLUG:
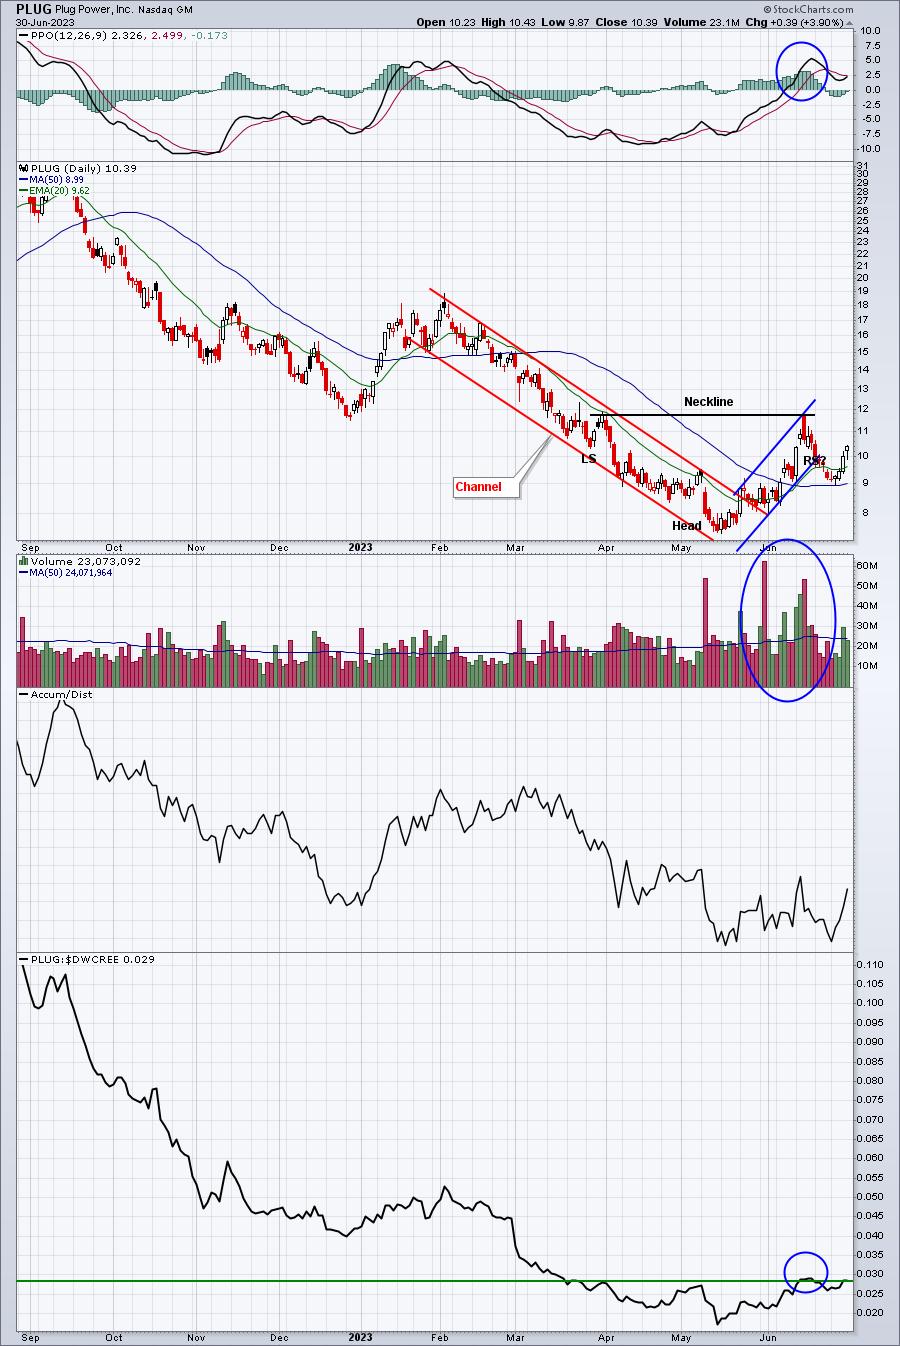
I still like PLUG, but it's definitely a risky trade. I was looking for the 20-day EMA to hold as support, but it didn't. Much like WSM, PLUG dropped and found support at its 50-day SMA. On the recent rebound, however, check out that increase in volume and the double bottom on the AD line. The latter could hold the key. I want to see PLUG finishing trading days towards the top of its daily range, much like it has over the past few trading sessions. A break above the neckline could trigger a much more significant rally.
EW:
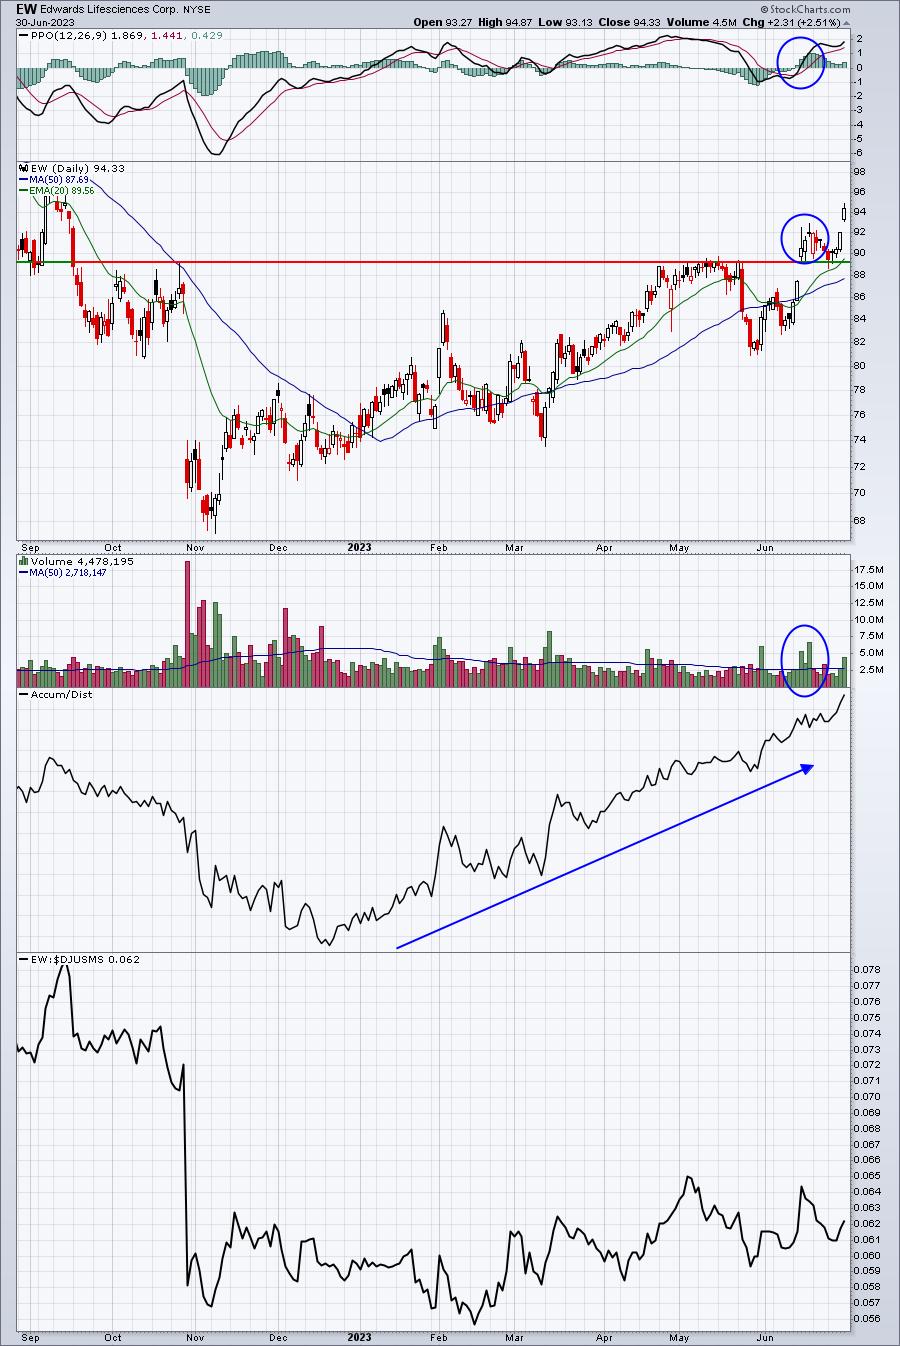
Though EW's relative strength could use a bit more strength, EW has clearly been the best performer of the four that I provided. Volume trends are very strong and the AD line is soaring. Last week's test of the rising 20-day EMA and immediate recovery to a new high is bullish and is exactly what I look for in an uptrending stock.
This Week's Setups
Every week, I will provide setups among our Portfolio stocks and our ChartList stocks. My preference is to trade Portfolio stocks, when appropriate. These stocks are in our portfolios for a reason - they're generally leaders within leading or improving industries.
Here are two portfolio stocks that I believe could be ripe for a big rebound as we move towards earnings season:
LVS:
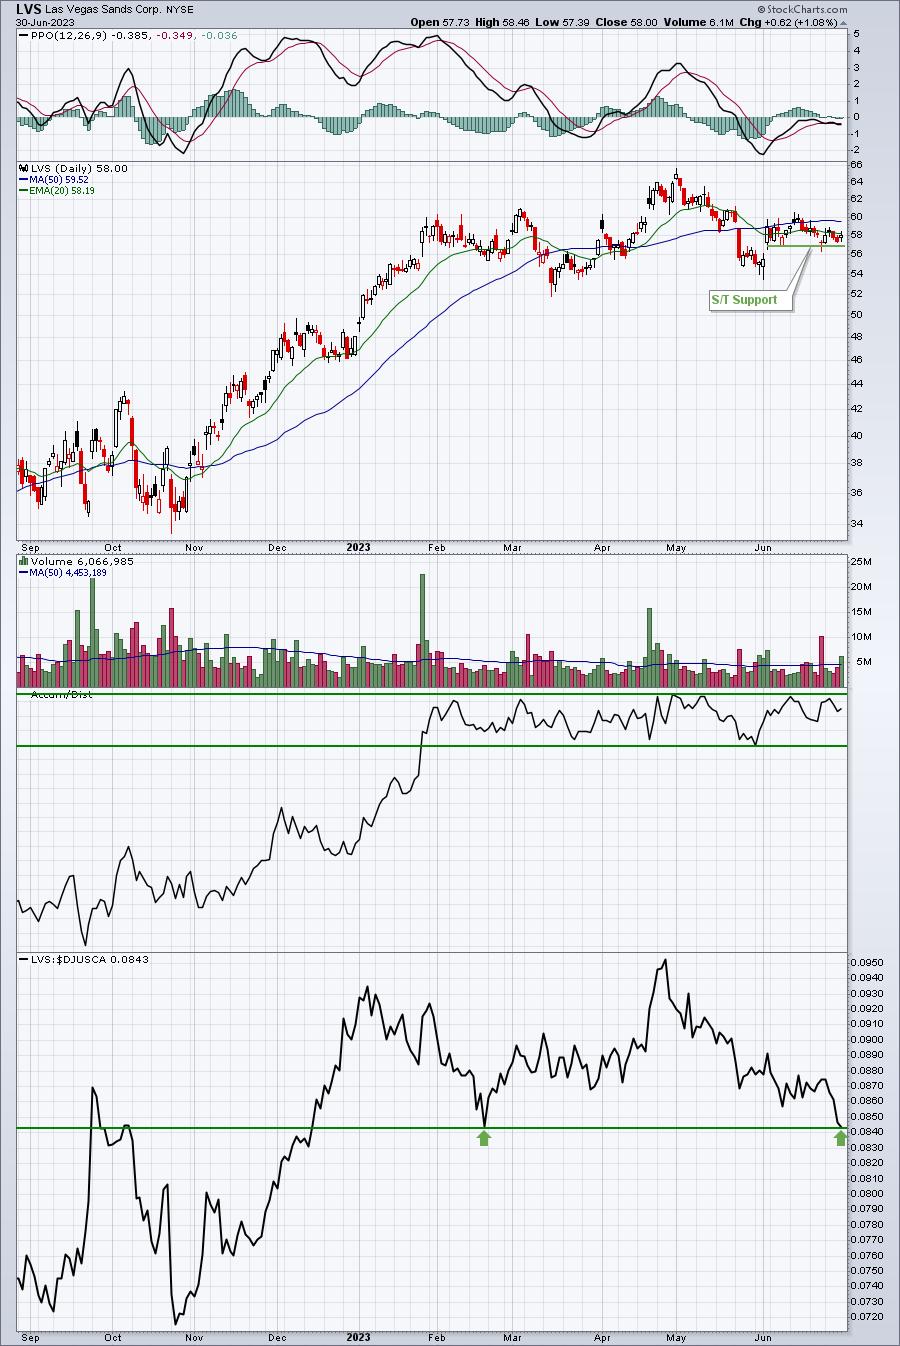
LVS has hit key absolute and relative price support. I'd like to see a bounce from here.
DUOL:
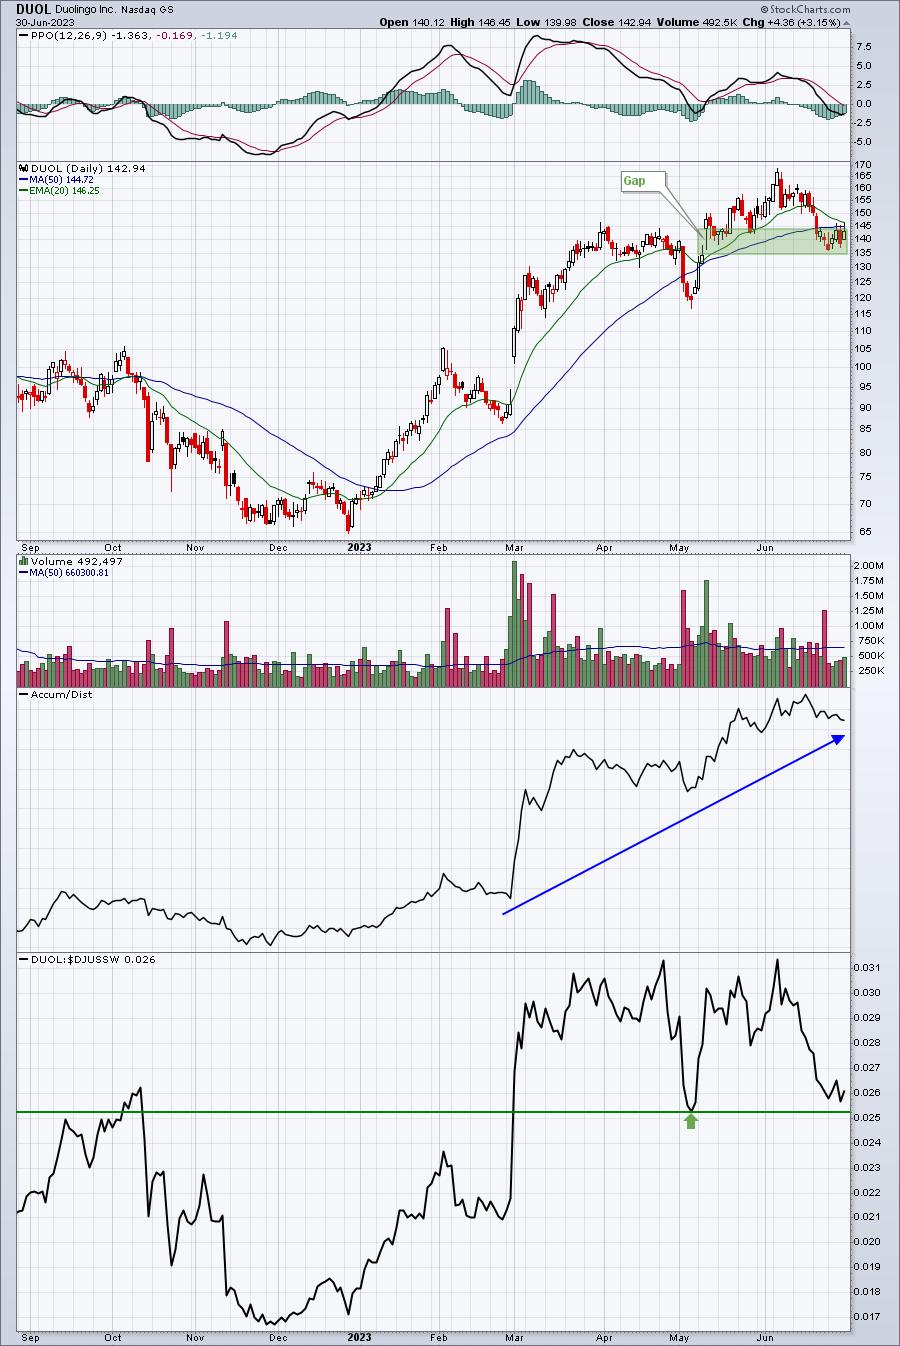
DUOL appears to be consolidating in a gap support zone. Its AD line remains strong and its relative price support is rapidly approaching. I like the reward to risk on the long side here.
FSLR:
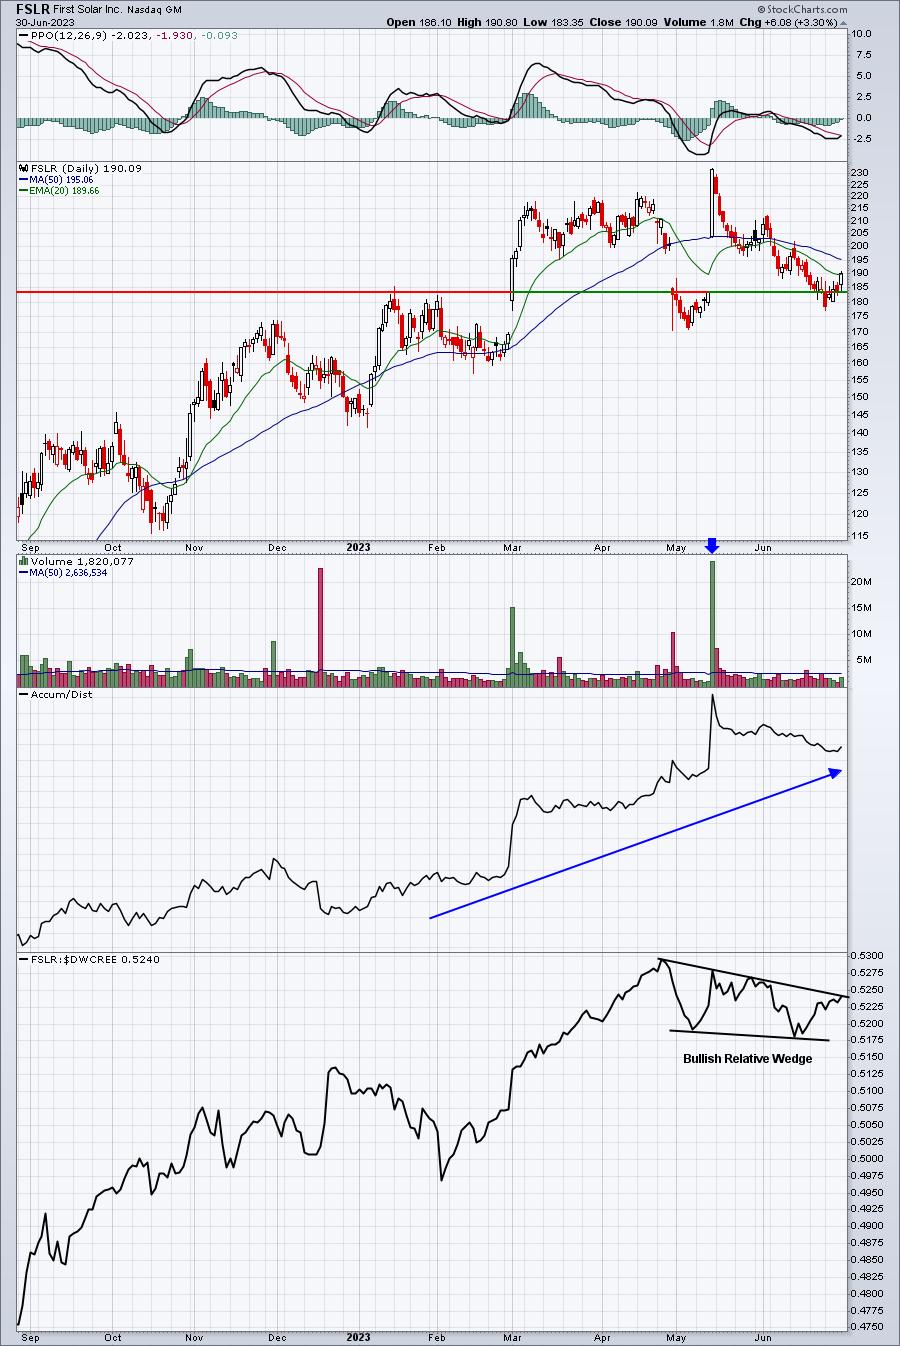
FSLR is setting up nicely. After failing at gap support on average volume for one day, it's rebounded nicely. I love its relative wedge pattern and the fact that renewable energy stocks have a history of performing well in July. FSLR closed just above its 20-day EMA on Friday and needs to build upon that bullish technical development.
The Week Ahead
This is the time of the calendar quarter where we typically see pre-earnings advances. It could be argued that we've already made a pre-earnings run, given the June performance as the S&P 500 gained 6.47%, the NASDAQ 100 gained 6.49%, and the 2023 laggard, the S&P 600 Small Cap Index, surged 8.03% to lead the pack. But I still would not bet against further strength. Rotation will be the key. We saw leadership last week from real estate, energy, and materials, and that type of renewed leadership from underperforming sectors in 2023 could be the recipe for further market gains.
Historically, as I discussed in the July Seasonality Report, the first half of July tends to be very strong. The annualized returns for the July 1st through July 17th period is +25.91% on the S&P 500 since 1950.
I was a bit cautious two weeks ago because of overbought conditions and history that suggested we be careful. That's changed somewhat as strength returned late last week as historical tendencies turned from bearish to bullish. I expect that our major indices will be higher on July 17th than they are today. Obviously, I'm not providing a guarantee, but based on what I'm seeing technically and historically, I'd be surprised if there's a meaningful decline before the banks kick off earnings season on Friday, July 14th.
Happy trading!
Tom Bowley, Chief Market Strategist
EarningsBeats.com
"Better timing. Better trades."