
EB Weekly Portfolio Report - Saturday, July 8, 2023
Earnings Date Changes
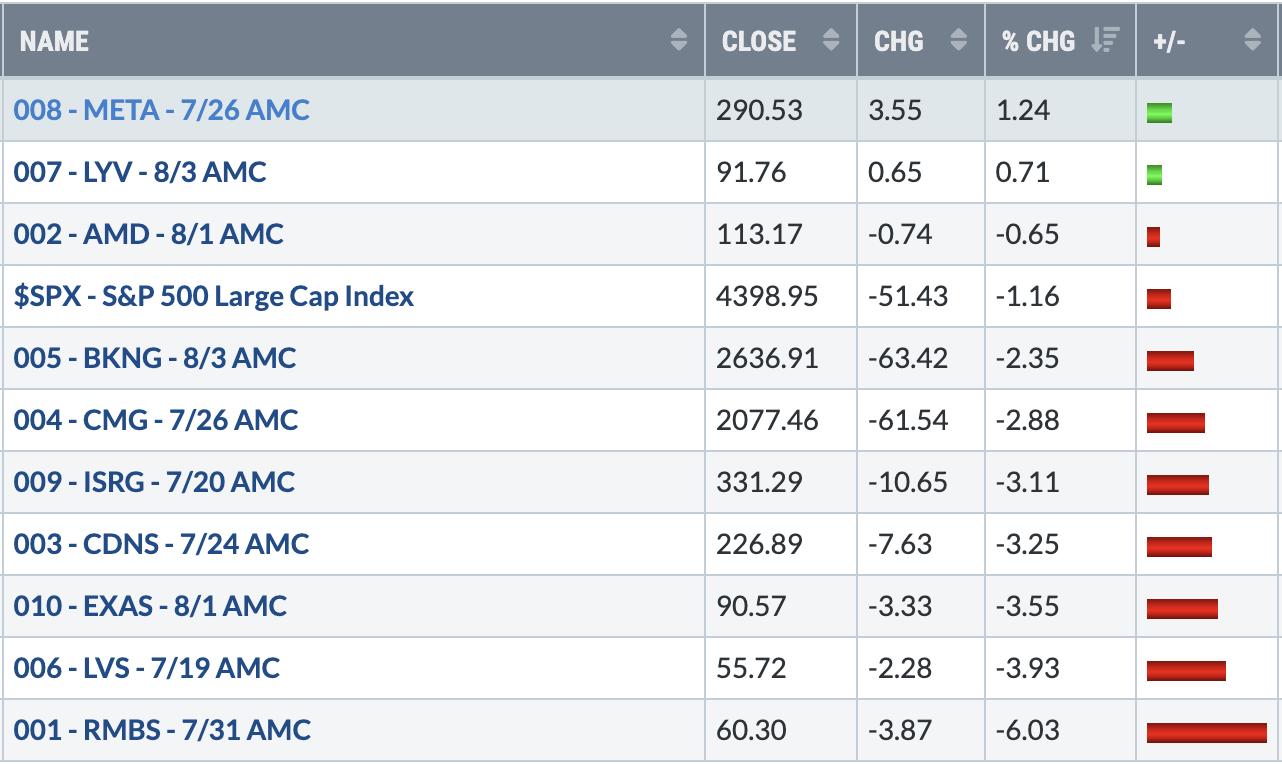
All of our Portfolio ChartLists provide an earnings report date in the name of every chart. For instance, in our Model Portfolio, I show Rambus, Inc. (RMBS) as "001 - RMBS - 7/31 AMC". This is simply a reminder for all of our members that RMBS reports its next quarterly earnings on 7/31 "after the market close" (AMC). These dates can and do change, however, so you CANNOT rely 100% on the dates that I provide in these ChartLists. I do check in on these dates from time to time as earnings season approaches and I've just done that today. Here are the changes:
Model Portfolio
- CMG's earnings date moved from 7/25 AMC to 7/26 AMC
- BKNG's earnings date moved from 8/2 AMC to 8/3 AMC
Aggressive Portfolio
- SKX's earnings date moved from 7/25 AMC to 7/27 AMC
Income Portfolio
- WING's earnings date moved from 8/4 BMO to 8/2 BMO
- SYK's earnings date moved from 7/25 AMC to 8/3 AMC
If you re-download the Portfolio ChartLists, these changes will have been made and you'll be up to date. Just please keep in mind that further earnings date changes could be made over the next few weeks, so if that's important in your trading, be sure to continue to check those dates.
Upcoming Earnings Reports
According to Zacks.com, the following companies will be reporting earnings this week and each is a component of one of our portfolios:
Monday, July 10: None
Tuesday, July 11: None
Wednesday, July 12: None
Thursday, July 13: None
Friday, July 14: None
PLEASE NOTE: The above companies were provided using Zacks.com. We do hold our portfolio stocks through one earnings report, but every EarningsBeats.com member must make his/her own investing/trading decisions about holding stocks into earnings reports as it's the most volatile (risky) time to own a stock.
Portfolio Rules and Objectives
Here are the common traits and objectives of our portfolios:
- There are 10 leading stocks from up to 10 leading industries in each portfolio (at the time of selection). Generally, there will only be one stock per industry group, but there could be exceptions.
- They are typically held for an entire 90-day period, with no stops in place. We strive for consistency, transparency, and simplicity in our portfolios. EB.com members may hold these stocks for the entire 90 days, trade them, use stops, etc., but for purposes of our calculation, we will likely make no exceptions to our "buy and hold for three months" strategy.
- Every stock will generally be held through ONE earnings report
- The expectation is that relative winners will carry the portfolio to outperformance
- All portfolio stocks were announced on Thursday, May 18th, and were all entered into as of the close on Friday, May 19th for tracking purposes
- Primary objective is to outperform the benchmark S&P 500 over time; quarter-to-quarter performance can be extremely volatile, especially if significant rotation takes place intra-quarter
Here are several considerations for EB members:
- The Income Portfolio should have the least amount of volatility as it will typically be comprised of quality large cap stocks with solid dividends
- The Model and Aggressive Portfolios should be viewed similar to aggressive growth funds; they will typically have a lot of volatility and periodic drawdowns can be significant from time to time
- The Income portfolio stocks will all pay dividends, with the expected average dividend yield to be at least 1.0%
- Drawdowns (losses) should be much milder on the Income portfolio, with more volatility expected on the other two; please review inception-to-date charts below to gain an idea of the volatility associated with each
- I believe the larger drawdown on the Income portfolio at the beginning of the pandemic was an anomaly, occurring as many defensive, higher-yielding companies uncharacteristically underperformed during a market decline.
- Large drawdowns in the February through May 2021 and the November 2021 to February 2022 periods were due to the rapid rotation from growth stocks to value stocks; each quarter, our portfolios are based on themes and there is never a guarantee that our analysis and beliefs will be proven correct
- Consider owning or trading these stocks in whatever manner is most comfortable for you; while we will buy all 10 stocks in the manner identified above, feel free to trade certain stocks or wait for pullbacks if the stocks are overbought
- We have no idea what risk each member is willing or able to take. We are not registered investment advisors so be sure you understand the risk you take. Please consult your financial advisor.
- EarningsBeats.com shareholders/employees may own all or some of the portfolio stocks from time to time.
Weekly Snapshot
Here's a weekly recap:
- S&P 500: -1.16%
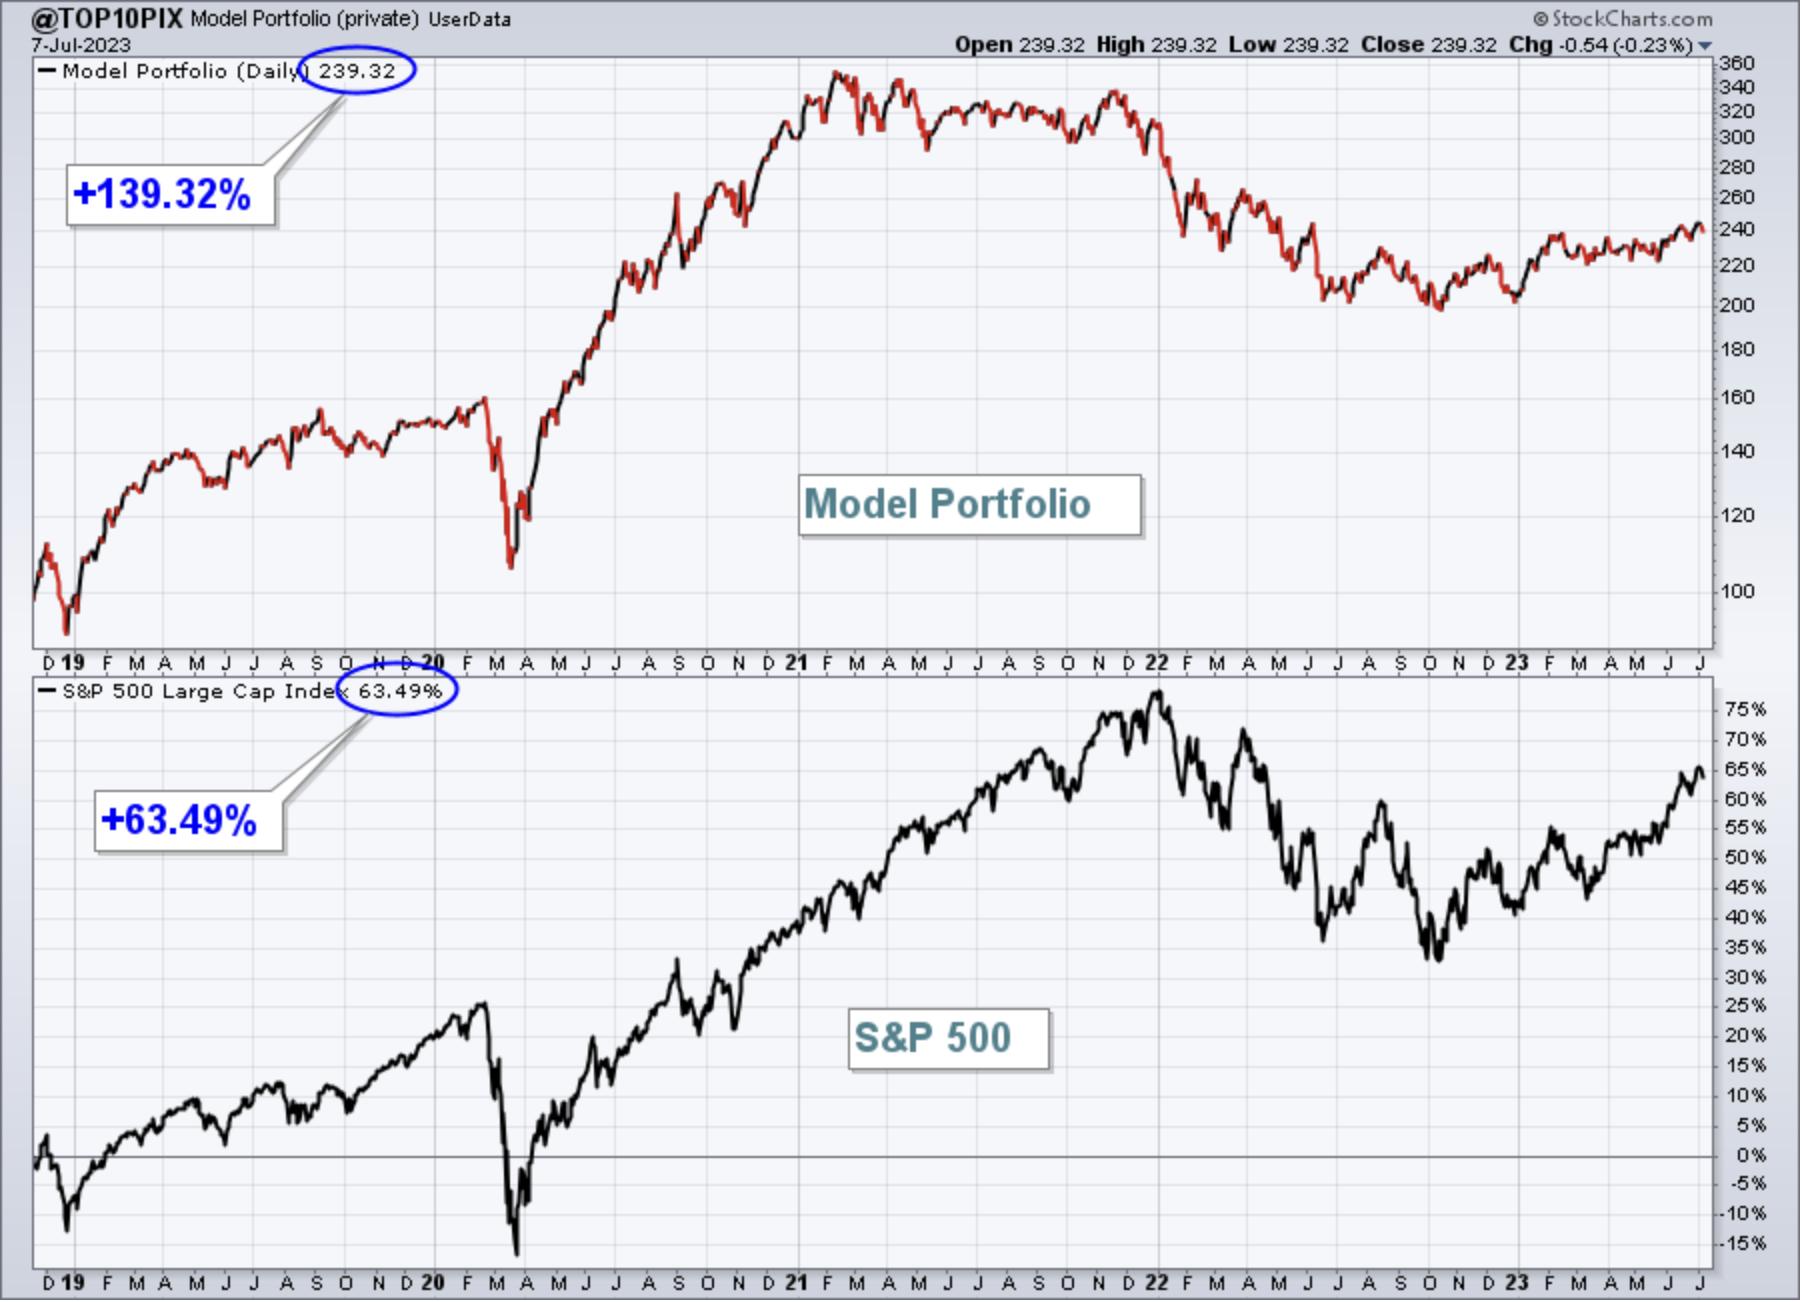
- Model Portfolio: -2.34%
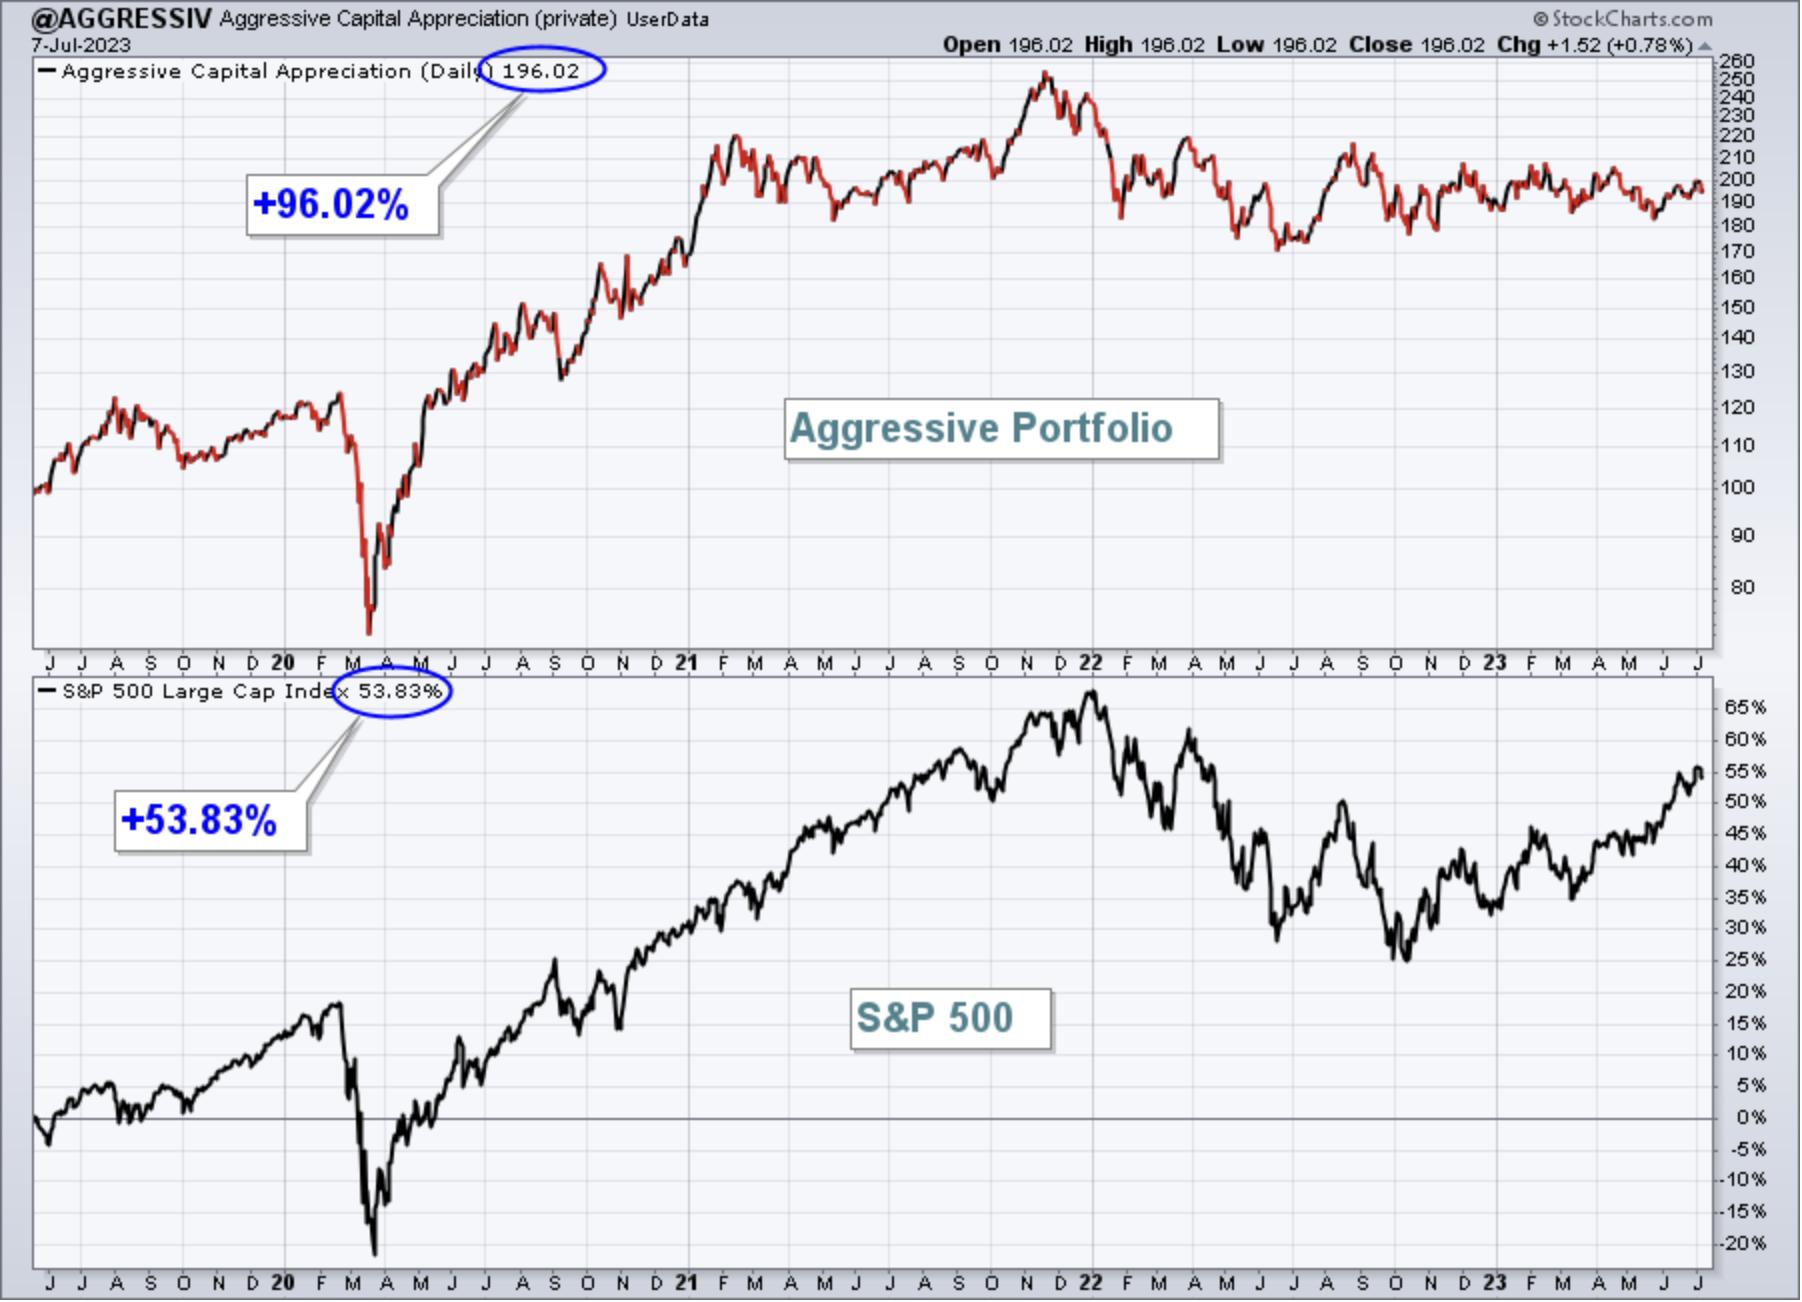
- Aggressive Portfolio: -1.76%
- Income Portfolio: -2.36%
- Model ETF Portfolio: -1.38%
Weekly Summary
Benchmark S&P 500:
The S&P 500 ($SPX, -1.16%), not too surprisingly, saw a bit of profit taking - finally. There are a few short-term signals that suggest we could see a bit more selling near-term, but many times secular bull market advances completely ignore short-term signals and keep powering forward. So each individual must decide which risk is bigger - missing out on a continuing rally or holding during a period of normal profit taking.
The 5-day moving average of the equity only put call ratio ($CPCE) is one signal that says we could see a little selling, along with just routine overbought conditions. Check out this CPCE chart:
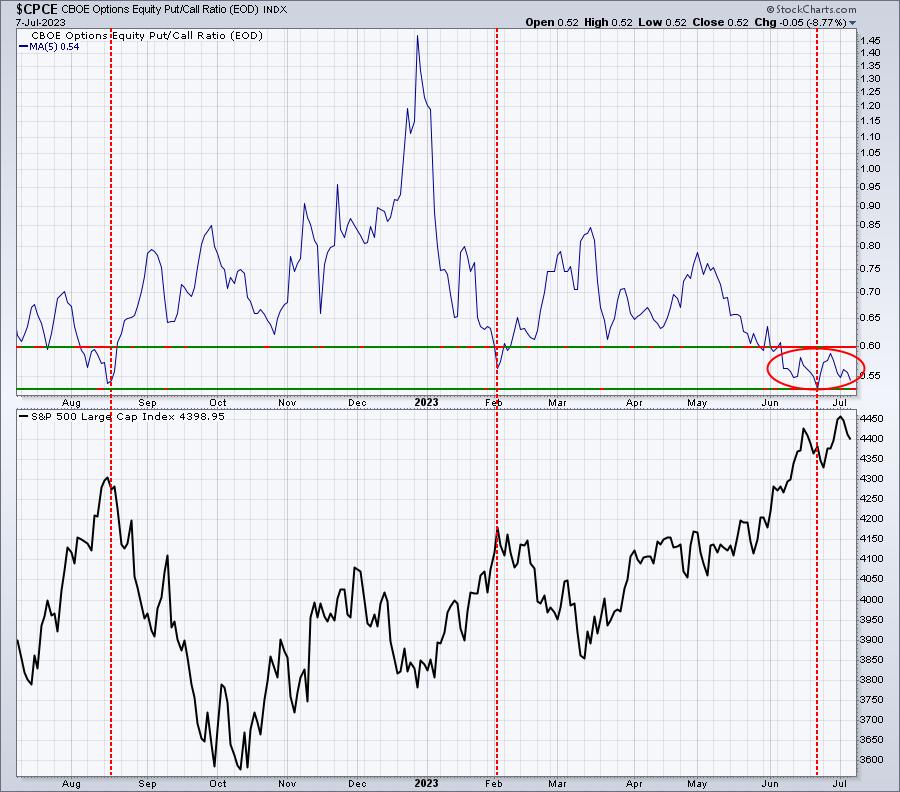
You can see that 5-day SMA readings of the CPCE in the .50-.60 range have marked recent market tops. So we need to be aware of that. HOWEVER, if we truly are rotating back into a secular bull market advance, these 5-day readings will begin to move lower. That's why I don't necessarily trust this signal this time. I really don't like being in cash for long during what I believe is a bull market rally, so I usually am willing to risk the downside in order to enjoy the upside potential. But perhaps this signal suggests we be careful with those leveraged ETFs. If we do see a short-term period of selling/consolidation, we'll have other opportunities down the road to increase our exposure with leveraged ETF products. I do own leveraged ETFs right now (I frequently increase/decrease my leveraged positions intraday - lowering my exposure when prices rise, then increasing my exposure when prices fall), but taking that higher risk is a decision I've made. That may not be appropriate for many of you. I'm not a registered investment advisor and, therefore, am not recommending the purchase or sale of ANY securities. I simply give you my opinion on the state of the market.
Most sectors fell last week, but real estate (XLRE, +0.27%) decided to, in the words of Fleetwood Mac, go its own way, reversing its recent lagging ways. The two worst sectors did not include any of our aggressive sectors as health care (XLV, -2.81%) and materials (XLB, -1.97%) "took one for the team".
Model Portfolio:
The Model Portfolio gave back 2.34% last week, underperforming the S&P 500. Here's the updated inception-to-date chart of the portfolio:
Here are how the Model Portfolio component stocks performed last week:
Aggressive Portfolio:
The Aggressive Portfolio lost 1.76% last week, underperforming the S&P 500. Here's the updated inception-to-date chart of the portfolio:
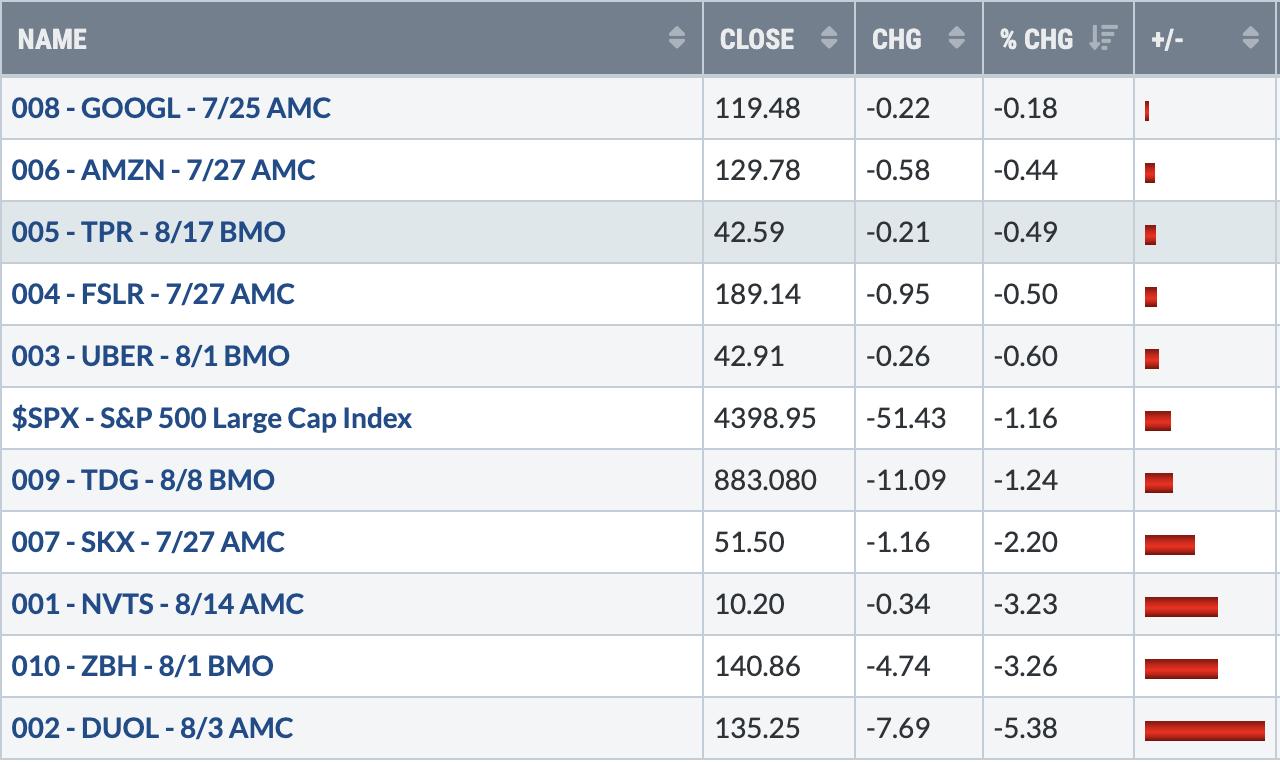
Here are how the Aggressive Portfolio component stocks performed last week:
Income Portfolio:
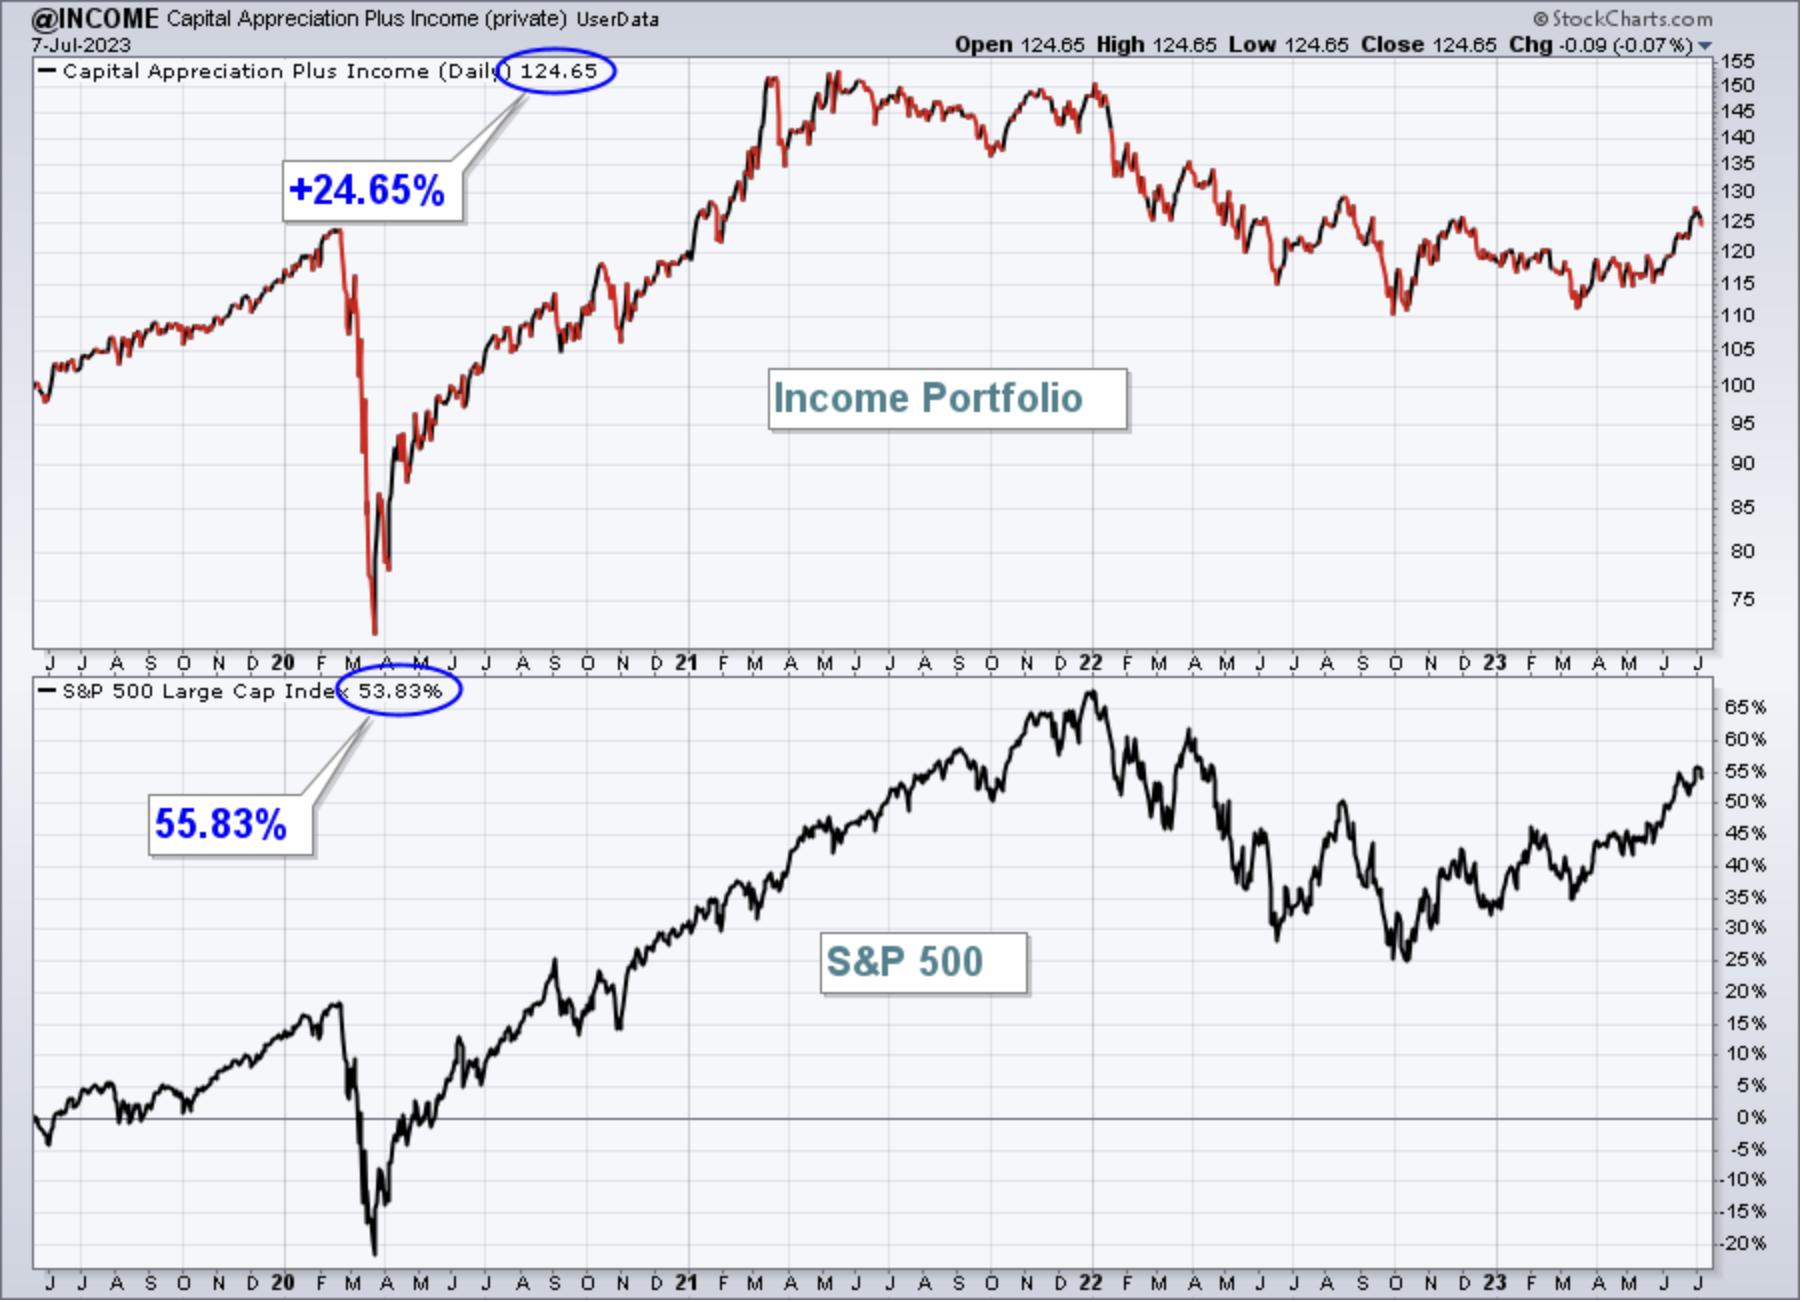
The Income Portfolio fell 2.36% last week, underperforming the S&P 500.
Here's the updated inception-to-date chart of the portfolio:
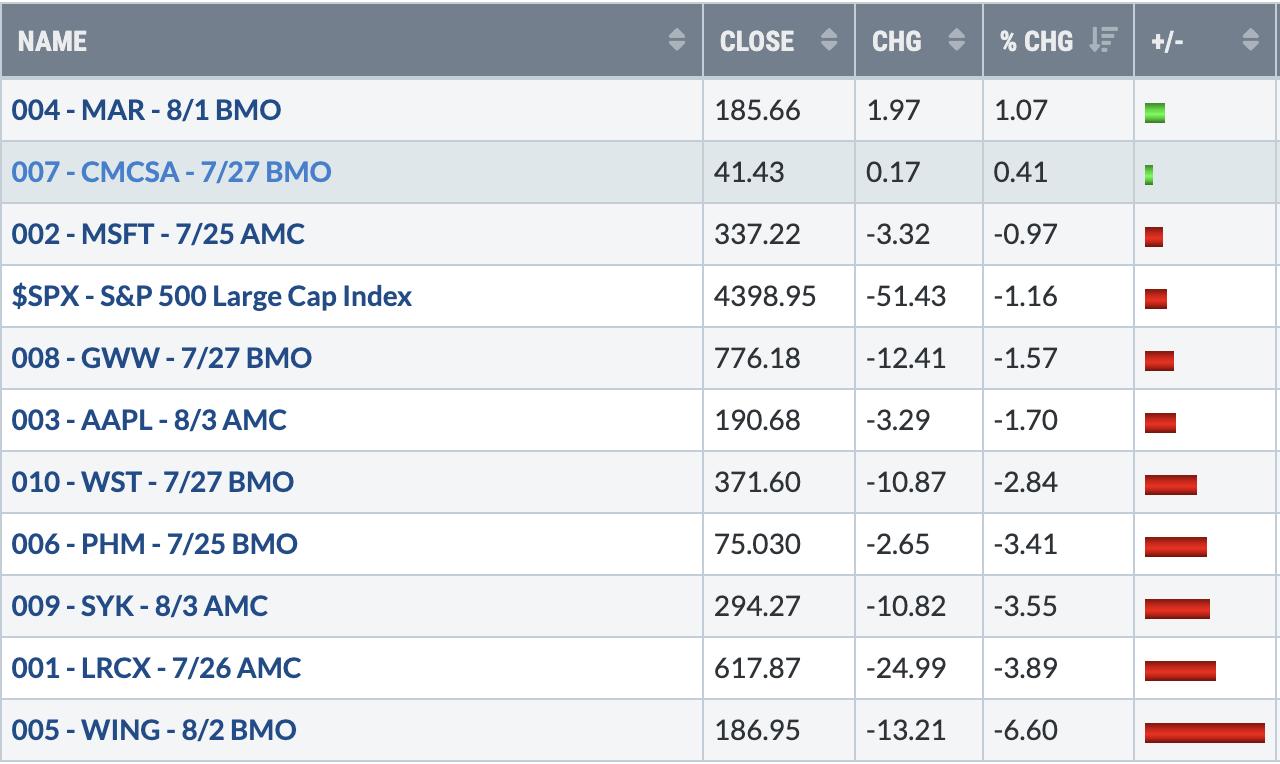
Here are how the Income Portfolio component stocks performed last week:
Model ETF Portfolio
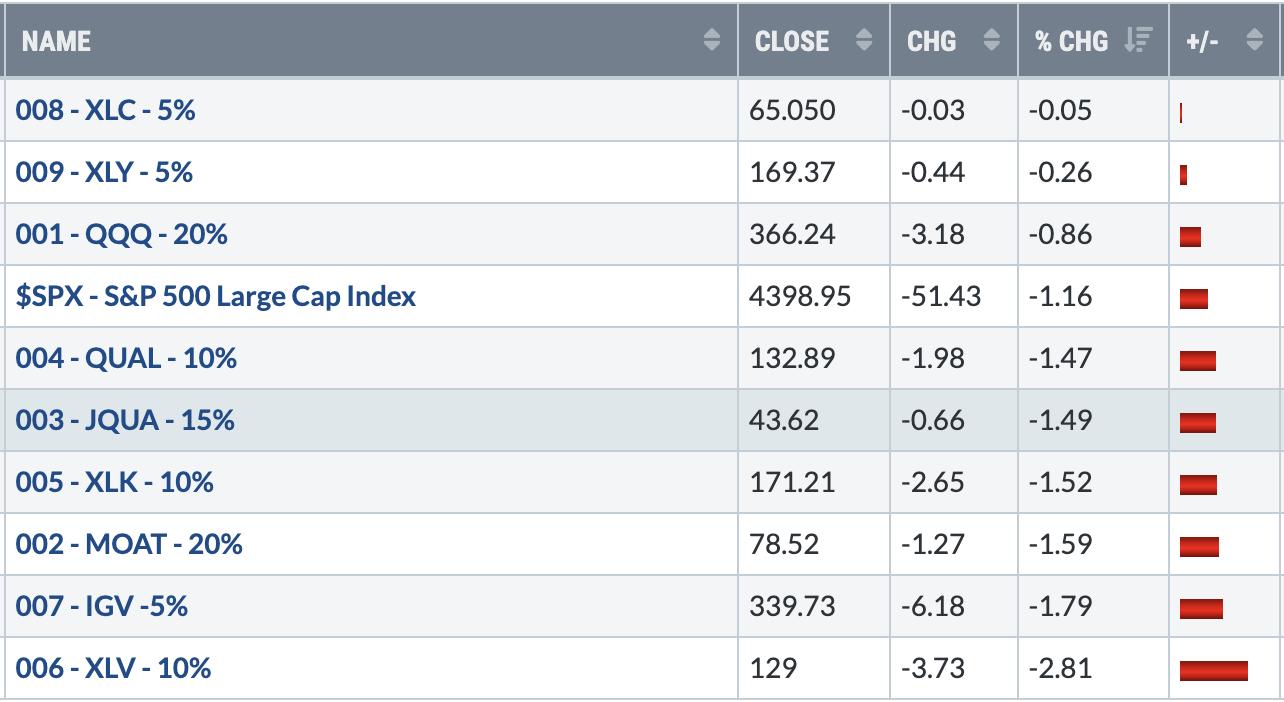
Our Model ETF Portfolio dropped 1.38% last week, slightly underperforming the S&P 500.
Here's the updated inception-to-date chart of the Model ETF Portfolio:
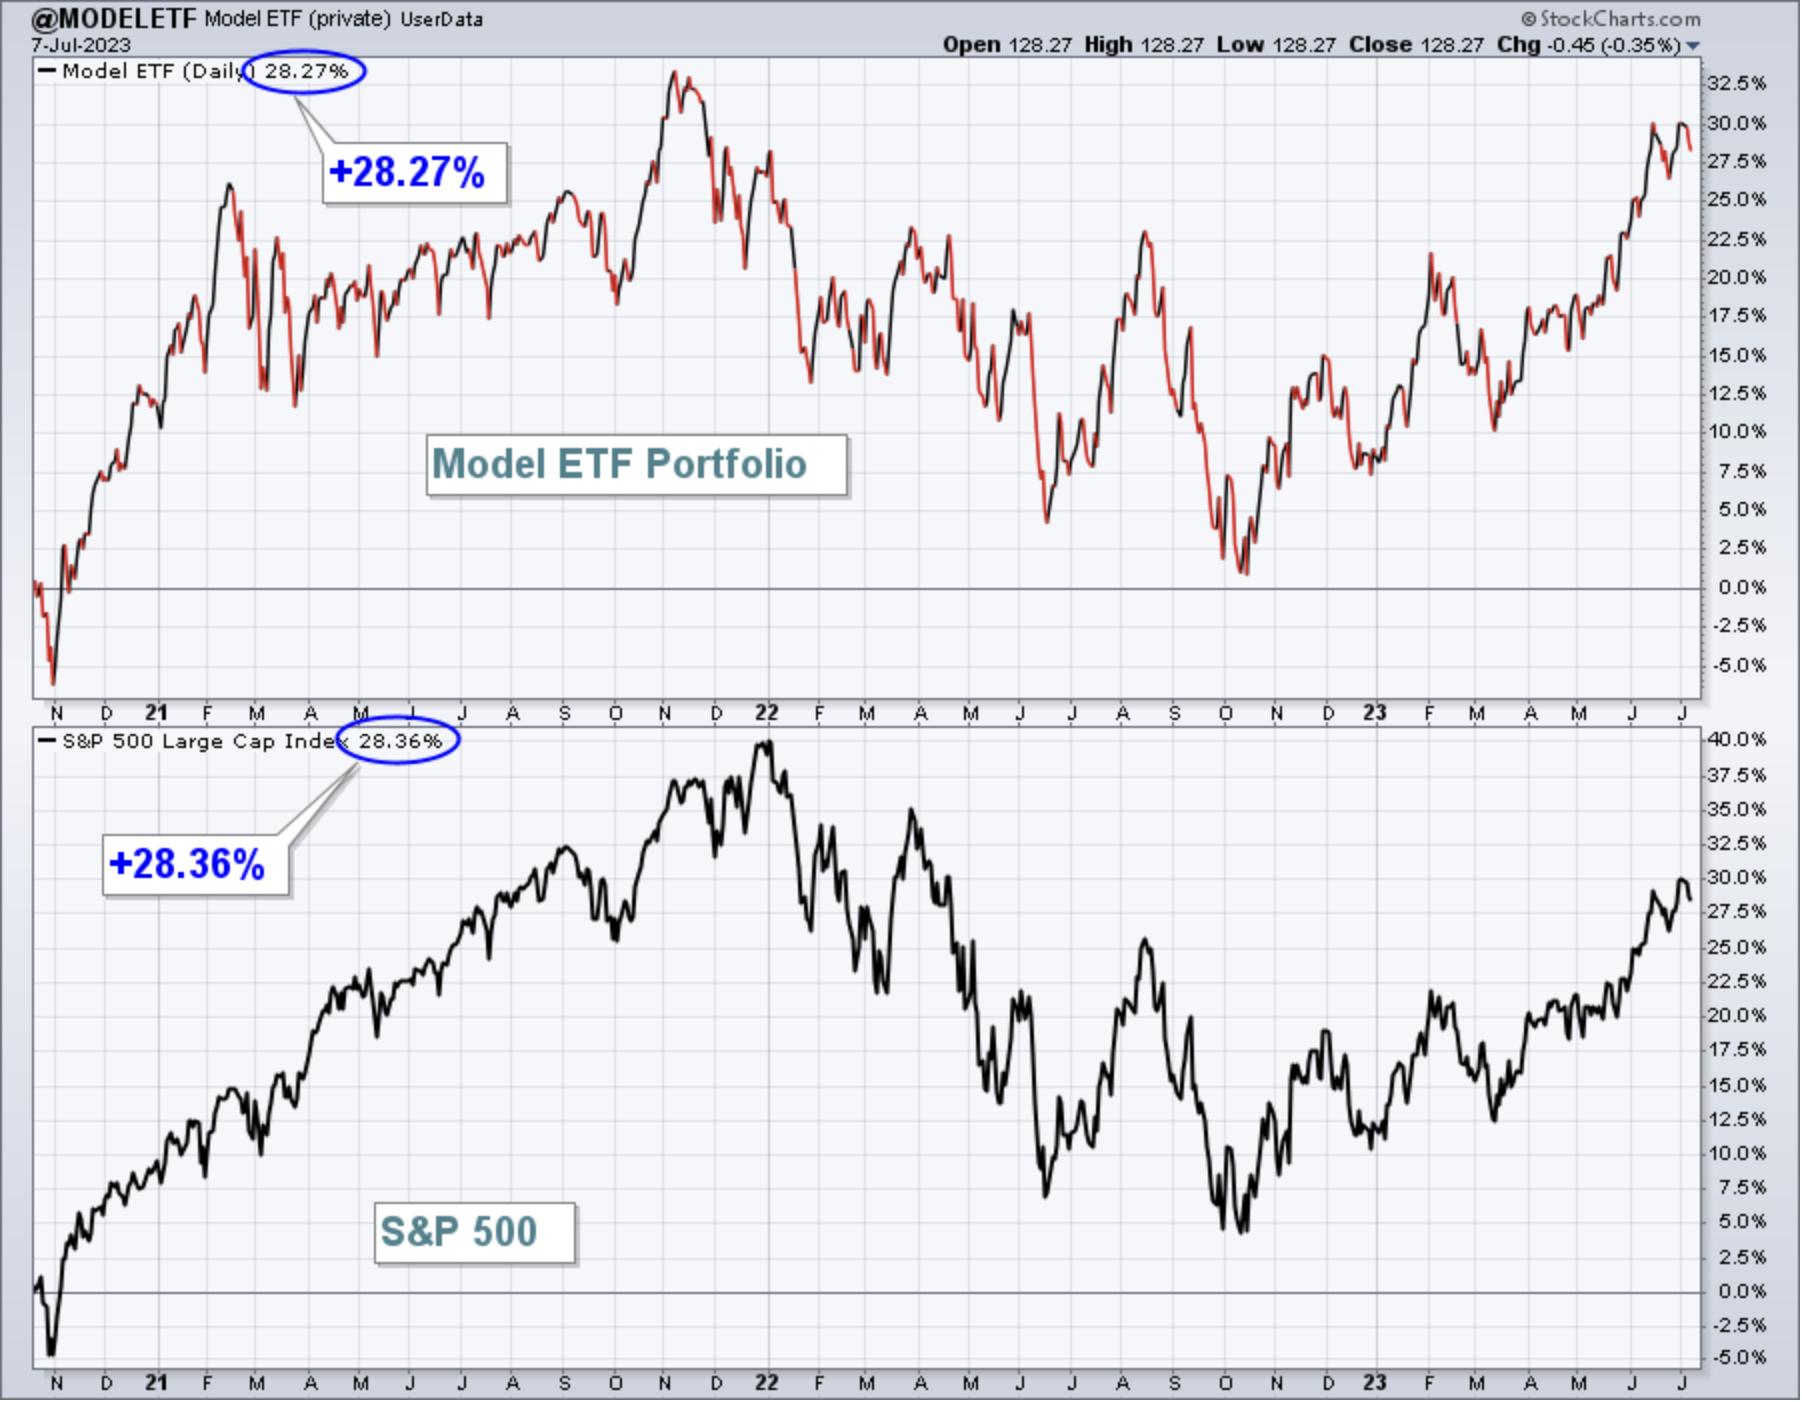
Here are how the Model ETF Portfolio components performed last week:
Model Trade Setups
I will provide Model Trade Setups each week in this Weekly Portfolio Report, which will simply be to outline possible trades based on key support, resistance, relative strength, and where these trades come from. For instance, my trading strategy for Strong AD ChartList (SADCL) stocks might be completely different than my trading strategy on Strong Earnings ChartList (SECL) stocks. Obviously, it would be different from a Short Squeeze ChartList (SSCL) trading candidate. I'll lay out the annotated chart and my reasoning for the (potential) trade. I may provide follow-up on some or all of these setups in the Daily Market Report (DMR). I'll also provide full disclosure, if I own any of the setups provided. Feel free to trade these Model Trade Setups based on the annotated charts provided, or according to your own trading strategy. Or ignore them. It's completely up to you. I am not a Registered Investment Advisor (nor is EarningsBeats.com). THESE TRADING CANDIDATES SHOULD NOT BE VIEWED AS INVESTMENT ADVICE.
I view EarningsBeats.com as a market research, market guidance, and market education platform. We do not attempt, in any fashion, to manage anyone's money. We have no idea the risk tolerance of each of our members, nor do we have any idea of your financial goals and objectives. It would be irresponsible for us to provide advice to any of our members. Therefore, please consult your own financial advisor before considering any buy/sell decisions. You are completely responsible for the financial decisions that you make.
Last Week's Setups
Last week, I commented on setups from two weeks ago. Here's just a quick blurb on each of those, but I won't follow them after this week:
- WSM - continues to struggle vs its peers, which gives me heartache
- HAE - clearly, the key support level remains at 82
- PLUG - very risky and the AD line remains in a downtrend; want to see stronger afternoon performance
- EW - still like this one. AD line strong, peer group strong, and gap support holding near 90. The big key going forward will be, "can EW begin to strengthen on a relative basis vs. its peers?" If not, then others in medical supplies might be more appropriate.
Now here's an update on the weekly setups provided last week, with the charts shown first:
LVS:
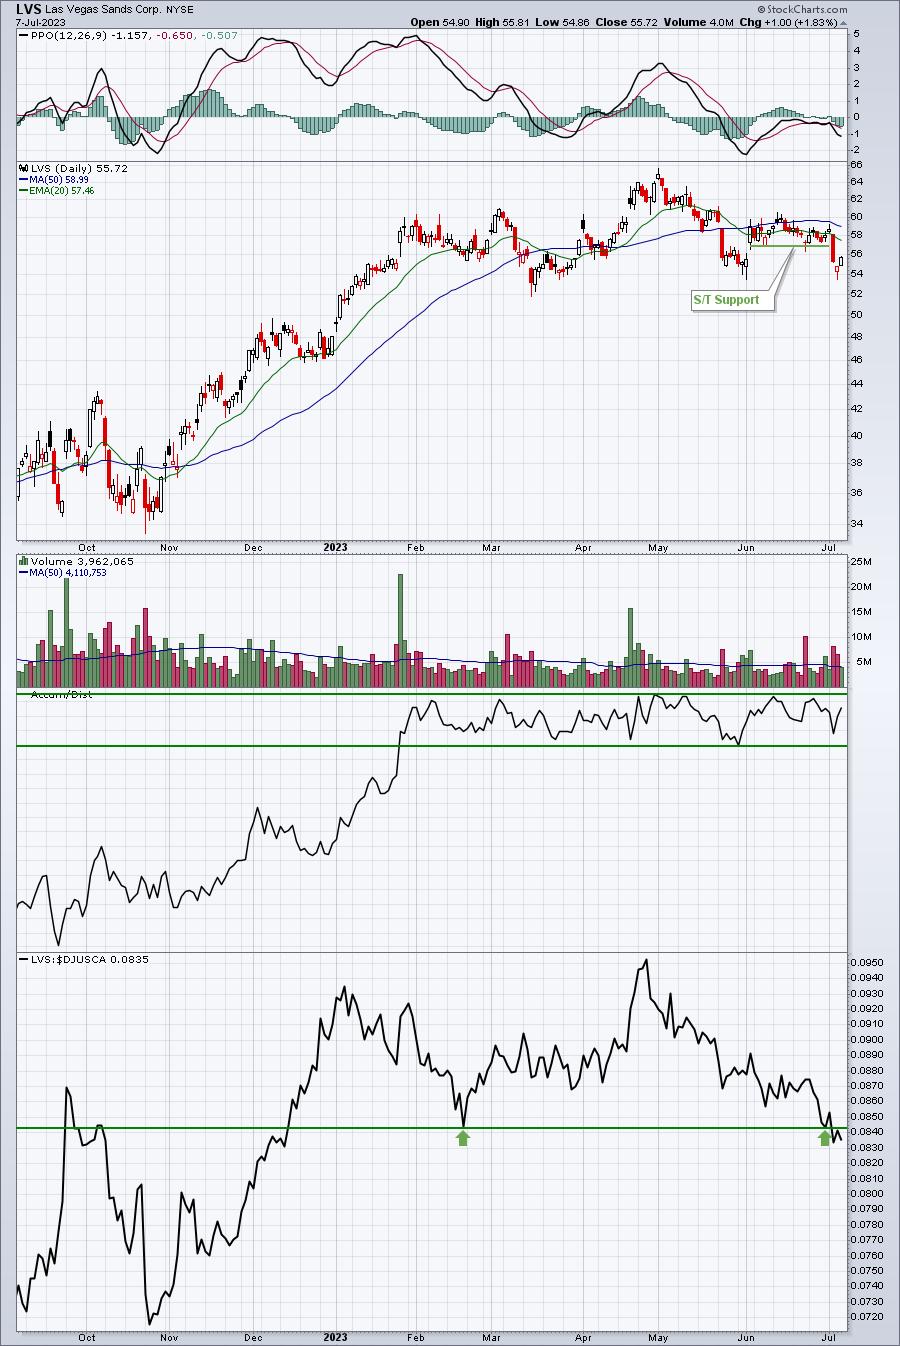
I traded LVS last week and got stopped out with a loss on that red candle that lost recent price support. Its AD line suggests it could begin another run heading into its earnings report on July 19th. The reversal last week came off of its next price support level near 54. A close beneath that level would add further downward pressure to the stock.
DUOL:
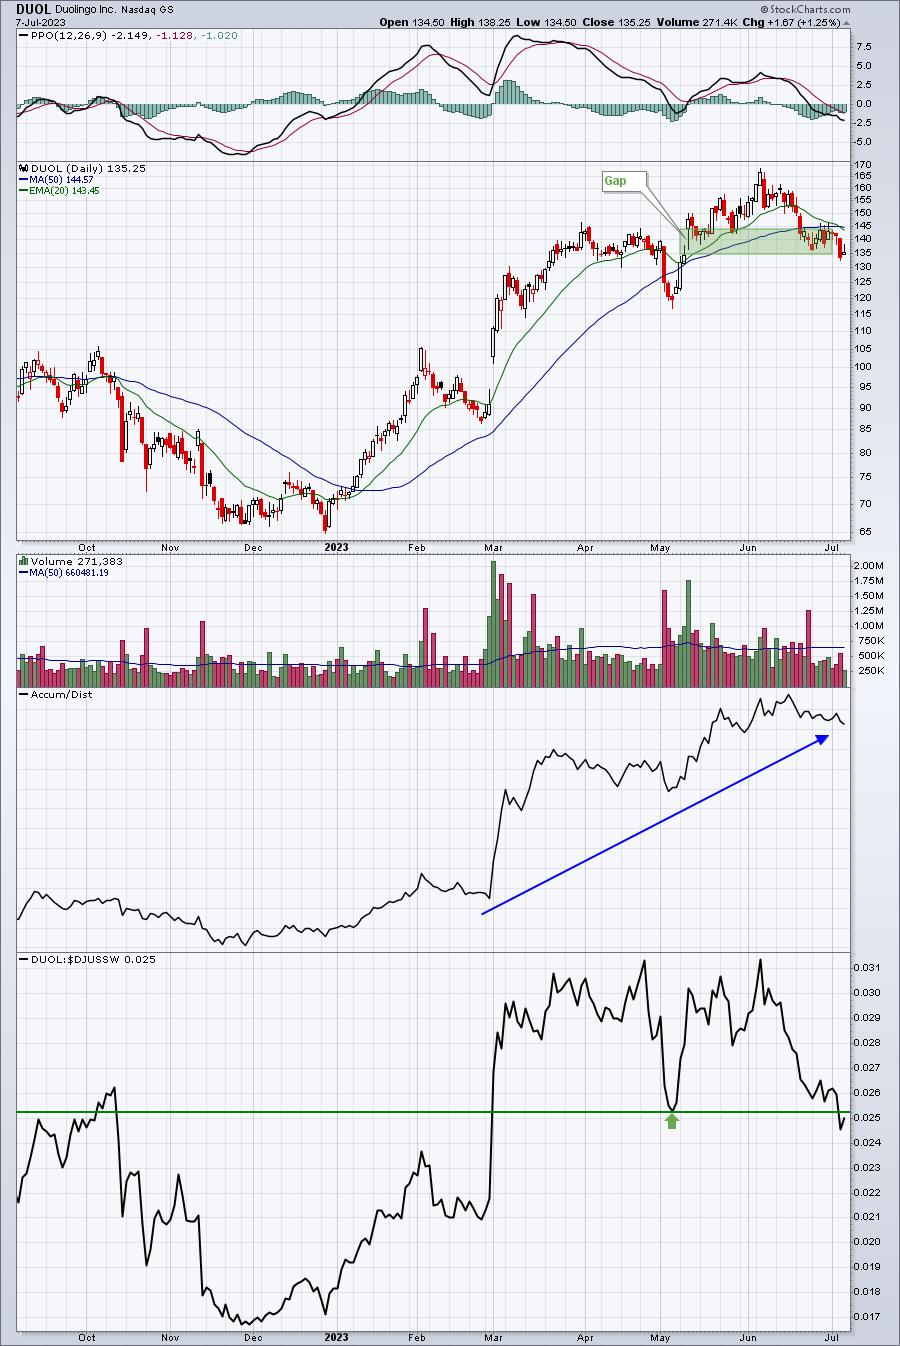
It turned almost perfectly off of gap support, but the current technicals don't look great. I don't like stocks trending beneath their declining 20-day EMA. I can make a bullish argument if it doesn't break to another fresh low, but I can't ignore the relative support breakdown last week. It needs to turn now.
FSLR:
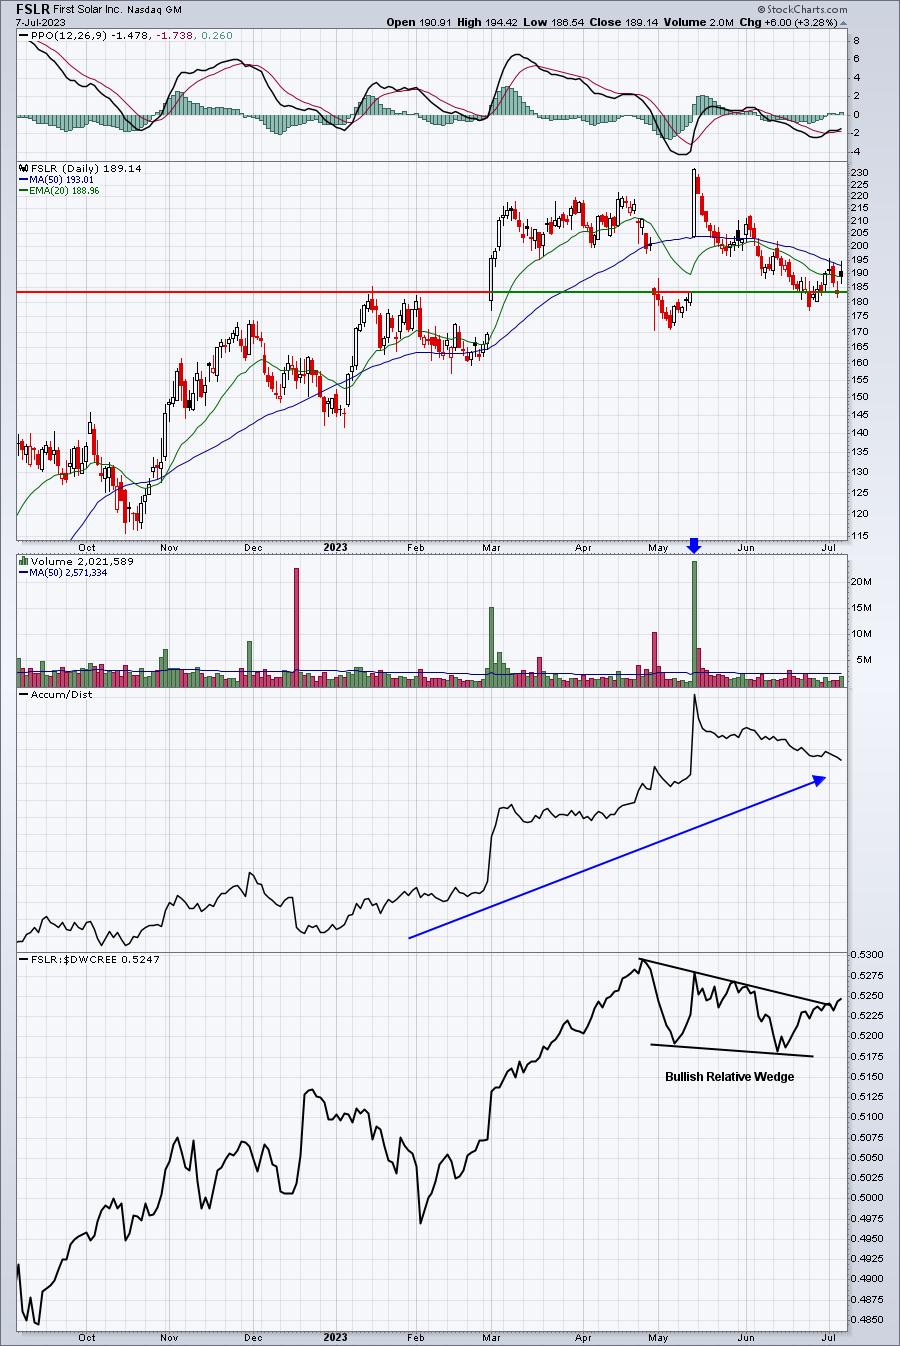
Well, there's good news and bad news on FSLR. First, I really like the bullish relative wedge breakout. This suggests we'll see further relative strength in FSLR vs. its renewable energy peers ($DWCREE). Typically, the DWCREE loves the month of July, but that hasn't helped this group yet (similar to the seasonal strength in biotechs).
This Week's Setups
Every week, I will provide setups among our Portfolio stocks and our ChartList stocks. My preference is to trade Portfolio stocks, when appropriate. These stocks are in our portfolios for a reason - they're generally leaders within leading or improving industries.
Here are two Model Portfolio stocks that I believe could have very big weeks ahead. Both reside almost squarely on their 20-day EMAs. If you want to keep a very tight stop on any close beneath this moving average, I wouldn't blame you:
ISRG:
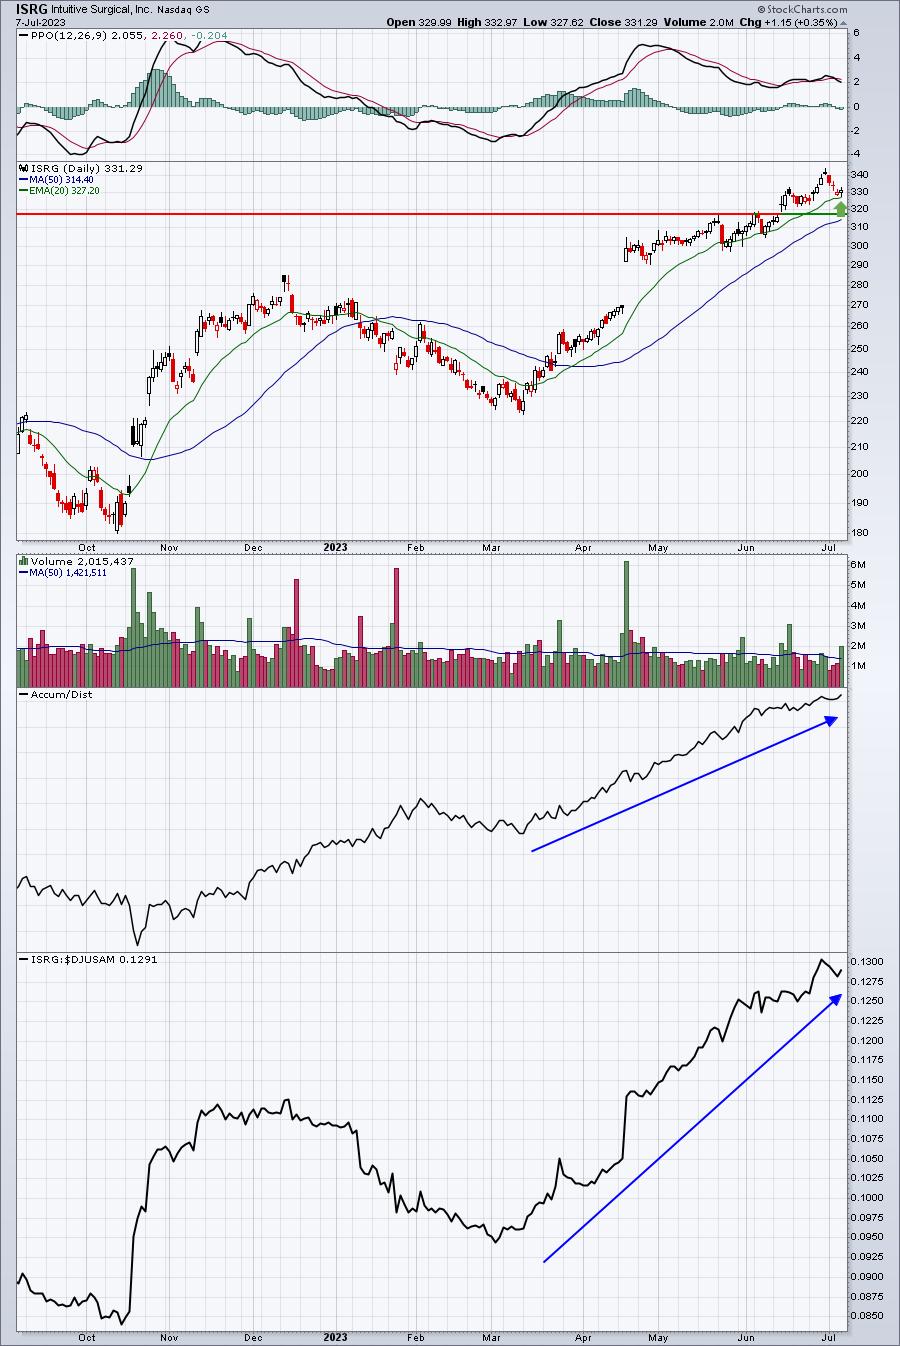
ISRG has one of the best AD lines out there and its relative strength is beautiful. A quick, light-volume pullback could turn out to be a superb setup.
CMG:
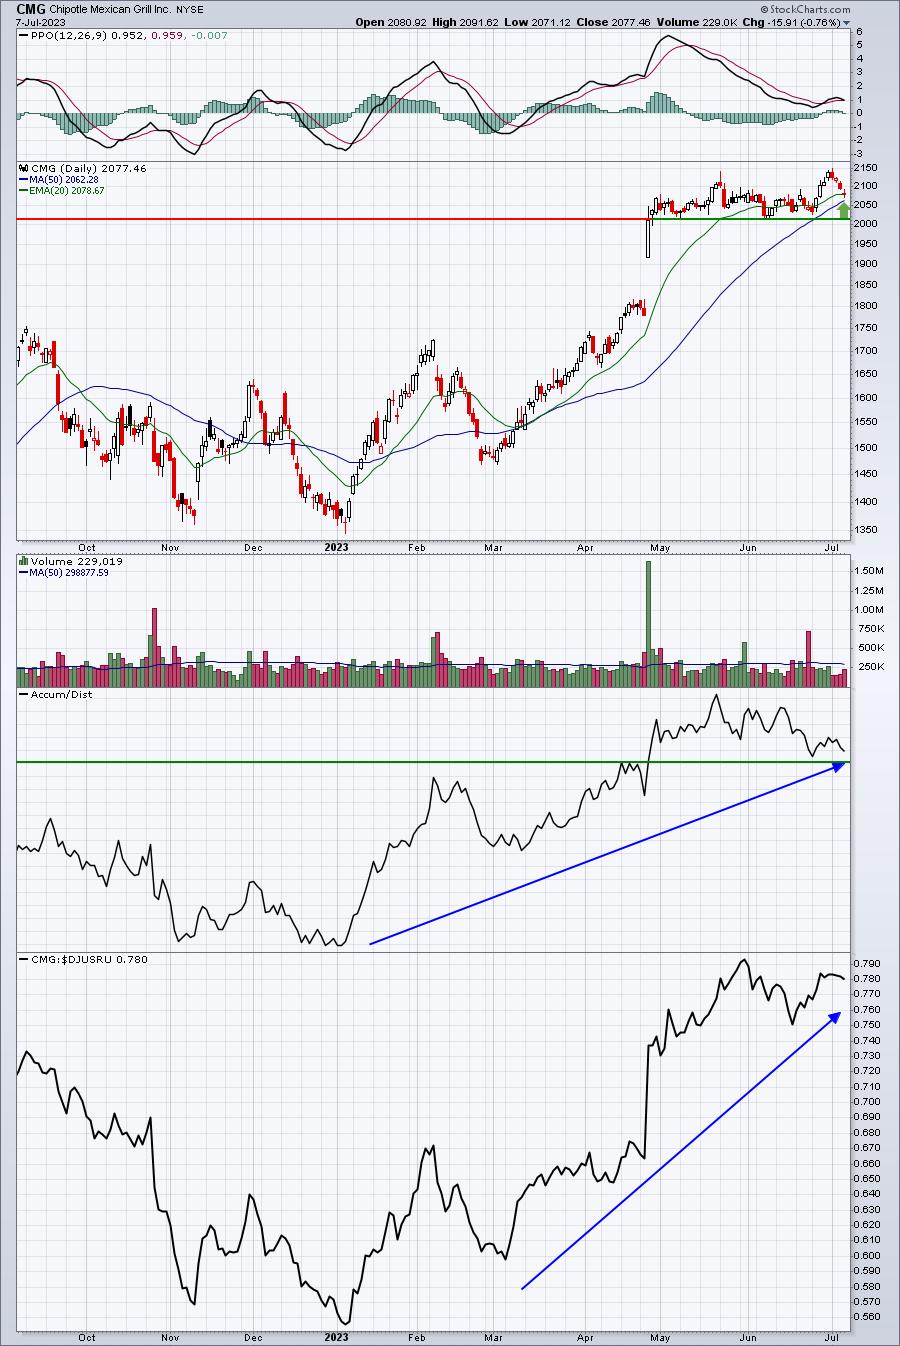
CMG gapped up on massive volume with its last earnings report. It's been consolidating ever since. After a very brief breakout on moderate volume, CMG has fallen back to test its 20-day EMA. It certainly wouldn't surprise me to see a rapid bounce. It too has been a very strong relative performer.
The Week Ahead
Well, it's earnings season! We're going to get our first look at earnings on Thursday from the likes of Pepsi (PEP), Cintas (CTAS), Fastenal (FAST), Delta Air Lines (DAL), and Conagra Brands (CAG). I expect a solid report from CTAS as it's been consolidating after showing relative strength vs. its peers in the business support services group ($DJUSIV). By the way, the DJUSIV has been an excellent industry performer, so a big report by CTAS could be rewarded nicely.
DAL is one that's been on FIRE! I cannot imagine a bad report coming from this stock, or maybe ANY airline, for that matter. Airlines ($DJUSAR) have been smoking hot and I'm not aware of any airline outperforming DAL of late. Look for another great report here. FAST is mixed. Its AD line suggests possible accumulation, but its very weak relative strength does not confirm this. I'd be careful with FAST.
On Friday, we hear from a "gaggle" of big banks ($DJUSBK), which should be rather interesting. As long as the Fed keeps talking rate hikes, which they are now, I don't see how it translates into a strong or strengthening banking sector. I suppose when Wall Street believes the worst of the Fed is over, we'll see it reflected in banks' relative strength. For now, though, we simply wait to look at this group. Having said that, JP Morgan (JPM) will report on Friday and this is one of the few banks I'd have any interest in. They could still report better-than-expected results, given their excellent relative strength.
It's going to be an interesting start to earnings season!
Happy trading!
Tom Bowley, Chief Market Strategist
EarningsBeats.com
"Better timing. Better trades."